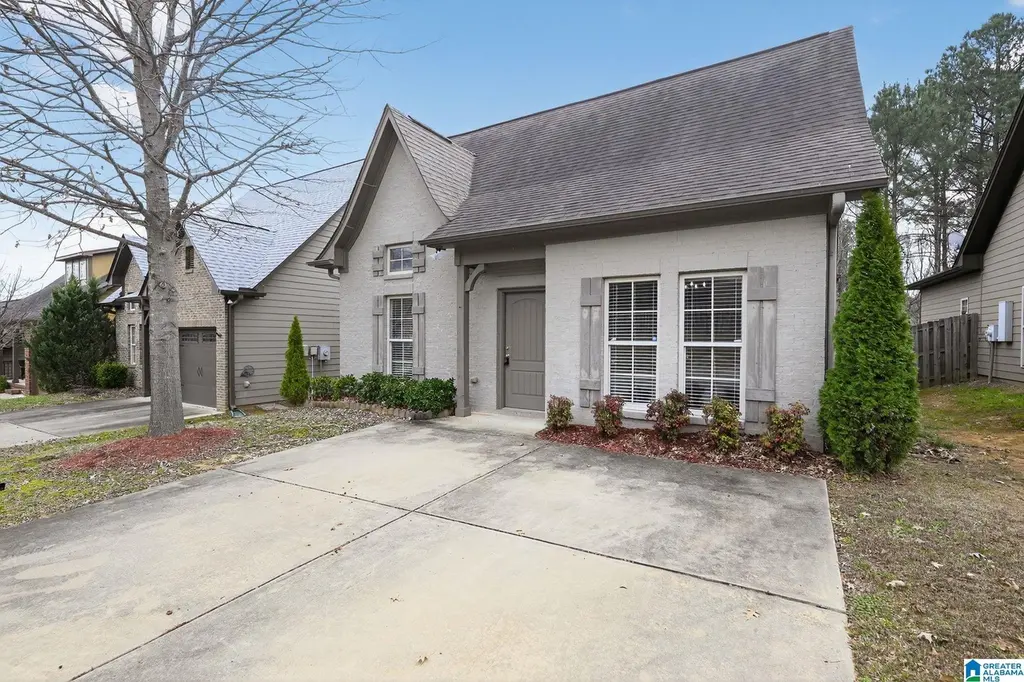
121 Kingston Ct · Birmingham, AL
Flood risk 1/10 · Minimal
- FEMA flood zone
- X (unshaded)
- Chance of flooding over 30 yrs
- 0.0%
- Est. flood insurance / yr
- $507 – $1,088
Fire risk 4/10 · Minor
- Est. fire insurance / yr
- $916 – $1,700
Heat risk 6/10 · Moderate
- Hot days now (above 106°F)
- 7 days/yr
- Hot days in 30 yrs
- 19 days/yr
Wind risk 6/10 · Moderate
- Chance of severe wind over 30 yrs
- 27.0%
Air-quality risk 3/10 · Minor
- Unhealthy air days now
- 2 days/yr
- Unhealthy air days in 30 yrs
- 5 days/yr
Risk factors via First Street. Map © Google.
Why this score? — see what drove the D grade
The composite is a weighted blend of 9 inputs, each scored 0–100. Each bar is that input's sub-score; the figure is the points it added to the 100-point composite (weight × sub-score).
- ARV discount +15.0/15.0
- Cash flow +10.4/30.0
- Livability +3.4/5.0
- 1% rule +3.3/10.0
- DSCR +3.0/10.0
- Rent growth +2.5/5.0
- Condition / age +2.5/5.0
- Schools +0.9/10.0
- Appreciation +0.0/10.0
$239,900
🖨 Deal sheet (PDF) 📄 Offer letter ✓ Due diligence
Listing remarks MLS
Located at 121 Kingston Ct, this one-story home offers 3 bedrooms and 2 full bathrooms with a practical and comfortable layout. The home features a welcoming living area with plenty of natural light and space for everyday living and gatherings. The kitchen provides functional workspace for cooking and meal preparation and includes an adjacent dining area. The bedrooms offer comfortable private spaces, while the two full bathrooms add convenience to the floor plan.
Key facts
- 5,227 sq ft lot
- Built 2010
- Listed 97 days
Neighborhood map
What this means for you Summary
Snapshot
- This is a 3-bed/2.0-bath single-family listed at $240k.
Deal economics
- At list price, monthly cash flow is $-126 ($-2k/yr) — negative.
- To cash-flow at today's rent, offer at most $218k (9.3% below list).
- To meet the 1% rule (rent ≥ 1% of price), the offer needs to be $200k (16.7% below list).
- Recommended offer: $200k (16.7% below list) — sets the bar for 1% rule.
Location & tenants
- Location reads 67/100 on livability (#78 in AL) — a middle-class / working-renter tenant base. Strengths: commute A+, cost of living A+, housing A+; Watch: amenities C-, schools F, crime F.
- Birmingham City (urban): math 4% / reading 20% proficiency, ranked #116 of 129 in AL (top 90%) — low school quality limits family demand, transient renter base, plan for 1-2y turnover; 82% free/reduced lunch — lower-income household profile, screen leases tightly.
- Market conditions: Rents soft (-0.0%/yr); 154 active listings in the ZIP; 13 comparable units currently listed for rent nearby; rentals at typical pace (median 26d on market — plan ~3-4 weeks tenant-placement turnaround); lower-income renter base — watch delinquency; 2,114 units permitted in Jefferson County in 2024 (556 in 5+ unit buildings).
- At $1,998/mo this rent would consume 69% of the median local household income ($35k/yr) (locally 2161% of renters already pay >50% of income on rent) — very limited rent-growth headroom before tenants either downsize or default.
Forward outlook
- Local home prices are declining (-3.0%/yr); year-one equity from $2k of loan paydown is wiped out by about $7k of value loss. Plan a longer hold.
- Jefferson County population projected to shrink 4% by 2050 — rents likely to lag national; underwrite the cash flow, not the appreciation.
Negotiation context
- It's been on market 97 days — a 9% lower offer ($218k) is reasonable based on typical stale-listing flexibility.
- 2 sale attempts since 5y ago; this cycle's ask has dropped $15k (6%) from the opening price — seller is motivated, your offer sets the floor, not the list.
Risks & watch-outs
- Climate carrying-cost: major wind risk, 27% chance of damaging wind over 30y; extreme-heat days projected 7→19/yr by 2055 (HVAC capex compounding) — expect insurance premiums to compound above CPI over the hold.
Questions for the listing agent
- What do current leases actually rent for vs. the listed asking? Can we see a recent rent roll and the last 12 months of T-12 income?
- It's been on market 97 days. Have you received any prior offers? Is the seller open to a 17% concession, seller financing, or rate buy-down credit?
- What does the HOA fee cover, when was the last increase, and are there any pending special assessments or reserve-fund shortfalls?
- Why hasn't it sold? Are there any deal-killer items the seller is aware of (foundation, flood, title, zoning, code violations)?
- Is there a deadline driving the sale (1031 exchange, divorce, estate, relocation)? That informs how much negotiation room exists.
- Schools are F-rated, which usually means shorter tenancies and higher turnover. Who's the typical renter profile here, and what's been the actual vacancy rate?
- Crime grade is F in this area — have there been break-ins, vandalism, or insurance claims at this property in the last 3 years? What carrier currently insures it and at what premium?
- The area grade is low — what's the realistic commute time and amenity access for the typical tenant pool here? Any planned neighborhood developments (good or bad) we should know about?
- What's the average days-on-market for RENTAL listings here right now (not sales)? A rising rental-DOM trend means longer vacancies and softer asking-rent achievability than the comps imply.
- What's the recent tenant-quality profile in this submarket — average credit score on applications, eviction rate, late-payment / NSF rate, and stable-employment percentage? A property-management company in the area should have these aggregated.
- How much new for-sale + rental construction is in the pipeline within 1–3 miles? Heavy new supply typically softens prices + rents 12–24 months out; constrained supply supports both.
Investment metrics
- 1% rule
- 0.83% ✗
- Cap rate
- 5.66%
- Cash-on-cash
- -2.25%
- DSCR
- 0.90
- GRM
- 10.0
CMA / ARV
- ARV (median comp)
- $310,542
- List price
- $239,900
- Delta
- -22.75%
- Verdict
- UNDERPRICED
- Comps
- 20 within 1.0 mi
Show comp detail 12 sales within ~0.75 mi
| Address | Dist | Beds/Ba | Sqft | Sold | Price | $/sf | Match |
|---|---|---|---|---|---|---|---|
| 315 Kingston Cir | 0.15mi | 3/2.0 | 1,316 (+2%) | 2mo | $309,900 | $235 | 88 |
| 317 Kingston Cir | 0.15mi | 2/2.0 (-1) | 1,275 (-1%) | 1mo | $314,000 | $246 | 86 |
| 261 Kingston Cir | 0.14mi | 3/2.0 | 1,463 (+14%) | 1mo | $347,500 | $238 | 70 |
| 348 Kingston Cir | 0.27mi | 3/2.0 | 1,378 (+7%) | 10mo | $310,000 | $225 | 67 |
| 353 Kingston Cir | 0.30mi | 3/2.0 | 1,394 (+8%) | 12mo | $314,900 | $226 | 63 |
| 350 Kingston Cir | 0.28mi | 3/2.0 | 1,394 (+8%) | 13mo | $305,000 | $219 | 62 |
| 369 Kingston Cir | 0.34mi | 2/2.0 (-1) | 1,160 (-10%) | 0mo | $270,000 | $233 | 62 |
| 365 Kingston Cir | 0.33mi | 2/2.0 (-1) | 1,160 (-10%) | 4mo | $272,500 | $235 | 60 |
| 3942 Sydney Trl | 0.56mi | 3/2.0 | 1,412 (+10%) | 2mo | $385,000 | $273 | 56 |
| 3956 Sydney Trl | 0.60mi | 3/2.0 | 1,463 (+14%) | 1mo | $390,000 | $267 | 48 |
| 3954 Sydney Trl | 0.59mi | 3/2.0 | 1,463 (+14%) | 2mo | $389,900 | $267 | 48 |
| 303 Oxmoor Pl | 0.75mi | 3/2.0 | 1,428 (+11%) | 9mo | $340,000 | $238 | 39 |
Match score weights: distance 35% · size 25% · config 20% · recency 20%. Top-matched comps best support the ARV.
Projected returns pro-forma
-3.0% appreciation · 0.0% rent growth · sell at horizon
- IRR
- -23.5%
- Equity multiple
- 0.22×
- Total profit
- $-52,707
- Equity at exit
- $35,770
- IRR
- -29.9%
- Equity multiple
- -0.17×
- Total profit
- $-78,635
- Equity at exit
- $20,742
Cash invested: $67,172 (down + closing). Projections, not guarantees.
Landlord ↔ Tenant lean methodology
- Overall (STATE)
- 90 Strongly Landlord-Friendly
- State Alabama
- 90 Strongly Landlord-Friendly · R+15
- County
- — inherits STATE
- City
- — inherits STATE
ZIP-level market 35211
- Rents YoY
- -0.0%
- Active inventory
- 154
- Price-to-rent
- 10.0×
Monthly cashflow live
- Estimated rent
- $1,998 high interval (Pro) →
- Mortgage (P&I)
- −$1,258
- Tax from tax record
- −$318 /mo · $3,812/yr
- Insurance
- −$100
- HOA
- −$29
- Vacancy / Maint / Mgmt
- −$420
- Net cashflow
- $-126
Break-even live
Sensitivity live
| Price | -10% $10 | -5% $-58 | +0% $-126 | +5% $-194 | +10% $-262 |
|---|---|---|---|---|---|
| Rent | -10% $-284 | -5% $-205 | +0% $-126 | +5% $-47 | +10% $32 |
| Rate | -1.0pp $-5 | -0.5pp $-65 | base $-126 | +0.5pp $-188 | +1.0pp $-252 |
UW: 25.0% down · 7.5% · 30yr · 1.5% tax · 5.0% vac · 8.0% maint · 8.0% mgmt
Financing live
Cash to close
- Down payment
- $59,975
- Closing costs
- $7,197
- Reserves months
- —
- Total cash needed
- —
Loan-product check · same deal, 3 products live
Conventional
25% down · 7.5% · 30yr
- Down + closing
- —
- Monthly P&I
- —
- Monthly cashflow
- —
- DSCR
- —
- Eligible?
- —
Personal DTI + credit; lowest rate.
DSCR
20% down · 8.5% · 30yr
- Down + closing
- —
- Monthly P&I
- —
- Monthly cashflow
- —
- DSCR
- —
- Eligible?
- —
No personal income docs; deal must DSCR.
Hard money
10% down · 12.0% · 12mo
- Down + closing
- —
- Monthly P&I
- —
- Monthly cashflow
- —
- DSCR
- —
- Eligible?
- —
Short-term bridge; refi at stabilization.
Rent comps 13 comps
| Address | Beds | Baths | Sqft | Rent | $/sqft | DOM | Units | Dist |
|---|---|---|---|---|---|---|---|---|
| 122 Singapore Cir Birmingham, AL | 2.0 | 2.0 | 1340 | $1,850 | $1.38 | 45d | 1 | 0.55mi |
| 982 Webb Cir Birmingham, AL | 3.0 | 2.0 | 1147 | $1,700 | $1.48 | 25d | 1 | 0.71mi |
| 2817 Oxmoor Glen Dr Birmingham, AL | 3.0 | 2.0 | 1428 | $2,150 | $1.51 | 45d | 1 | 0.78mi |
| 273 Oxmoor Pl Birmingham, AL | 3.0 | 2.0 | 1545 | $2,073 | $1.34 | 45d | 1 | 0.78mi |
| 2758 Village Pl Birmingham, AL | 3.0 | 2.0 | 1402 | $2,451 | $1.75 | 25d | 1 | 0.89mi |
| 1700 Lakeshore Rdg Birmingham, AL | 1.0–3.0 | 1.0–2.0 | 978 | $1,697 | $1.74 | 3d | 17 | 0.90mi |
| 222 Oxmoor Pl Birmingham, AL | 3.0 | 2.0 | 1336 | $1,950 | $1.46 | 5d | 1 | 0.94mi |
| 2807 Village Ln Birmingham, AL | 3.0 | 2.0 | 1266 | $2,061 | $1.63 | 45d | 1 | 0.98mi |
| 251 London Pkwy Unit 414 Birmingham, AL | 2.0 | 2.0 | 1202 | $3,395 | $2.82 | 45d | 1 | 1.00mi |
| 251 London Pkwy Birmingham, AL | 1.0–3.0 | 1.0–2.0 | 1192 | $1,850 | $1.55 | 3d | 27 | 1.02mi |
| 2850 Venice Rd Birmingham, AL | 1.0–3.0 | 1.0–2.0 | 1190 | $1,957 | $1.64 | 3d | 18 | 1.12mi |
| 2800 Milan Ct Birmingham, AL | 1.0–2.0 | 1.0–2.0 | 976 | $2,551 | $2.61 | 23d | 10 | 1.23mi |
| 901 Wildwood Xing Birmingham, AL | 3.0 | 1.0–2.0 | 925 | $1,599 | $1.73 | 4d | 35 | 1.43mi |
HOA detail
- Monthly dues
- $29 · $348/yr
Listing history 17 events
-
2026-06-13statusdays on market $239,900 Pending 97 DOM
-
2026-06-10days on market $239,900 Active 96 DOM
-
2026-06-09days on market $239,900 Active 95 DOM
-
2026-06-08days on market $239,900 Active 94 DOM
-
2026-06-07days on market $239,900 Active 93 DOM
-
2026-06-03days on market $239,900 Active 89 DOM
-
2026-06-02days on market $239,900 Active 88 DOM
-
2026-06-01days on market $239,900 Active 87 DOM
-
2026-05-31days on market $239,900 Active 86 DOM
-
2026-04-11price $249,900 468-char remark
Show marketing remark (468 chars)
Located at 121 Kingston Ct, this one-story home offers 3 bedrooms and 2 full bathrooms with a practical and comfortable layout. The home features a welcoming living area with plenty of natural light and space for everyday living and gatherings. The kitchen provides functional workspace for cooking and meal preparation and includes an adjacent dining area. The bedrooms offer comfortable private spaces, while the two full bathrooms add convenience to the floor plan.
-
2026-03-06$254,900 Active 468-char remark
Show marketing remark (468 chars)
Located at 121 Kingston Ct, this one-story home offers 3 bedrooms and 2 full bathrooms with a practical and comfortable layout. The home features a welcoming living area with plenty of natural light and space for everyday living and gatherings. The kitchen provides functional workspace for cooking and meal preparation and includes an adjacent dining area. The bedrooms offer comfortable private spaces, while the two full bathrooms add convenience to the floor plan.
-
2022-03-01soldstatus $242,504
-
2021-06-17soldstatus $225,000
-
2021-06-16soldstatus $225,000 Sold 296-char remark
Show marketing remark (296 chars)
Welcome home to 3 spacious bedrooms and 2 full baths all on ONE level!! Open floor plan great for entertaining the family. The backyard is flat and already fenced. The best part is the LOCATION, LOCATION, LOCATION. You will love being convenient to EVERYTHING! Call today for your private tour.
-
2021-05-10historical Contingent 296-char remark
Show marketing remark (296 chars)
Welcome home to 3 spacious bedrooms and 2 full baths all on ONE level!! Open floor plan great for entertaining the family. The backyard is flat and already fenced. The best part is the LOCATION, LOCATION, LOCATION. You will love being convenient to EVERYTHING! Call today for your private tour.
-
2021-05-06$225,000 Active 296-char remark
Show marketing remark (296 chars)
Welcome home to 3 spacious bedrooms and 2 full baths all on ONE level!! Open floor plan great for entertaining the family. The backyard is flat and already fenced. The best part is the LOCATION, LOCATION, LOCATION. You will love being convenient to EVERYTHING! Call today for your private tour.
-
2021-04-30historical $225,000 296-char remark
Show marketing remark (296 chars)
Welcome home to 3 spacious bedrooms and 2 full baths all on ONE level!! Open floor plan great for entertaining the family. The backyard is flat and already fenced. The best part is the LOCATION, LOCATION, LOCATION. You will love being convenient to EVERYTHING! Call today for your private tour.
ⓘ Source: listings_history table (triggers on properties + properties_extension) + one-shot
backfill from property_details.listing_events for pre-trigger history.
Tax reassessment forecast AL · Resets to sale price
- Current annual tax
- $3,812 · $318/mo
- Projected year-2 tax
- $3,812 · $318/mo
- Expected delta
- $0/yr ($0/mo · 0.0%)
ⓘ Screening estimate from a state-policy table — verify with the county assessor before closing.
Climate risk First Street
- Flood 1/10 Low FEMA zone X (unshaded) · 0% chance over 30 yrs
- Wildfire 4/10 Moderate
- Heat 6/10 Major 7 d/yr ≥106°F today · 19 d/yr by 30 yrs out
- Wind 6/10 Major 27% chance of damaging wind over 30 yrs
- Air quality 3/10 Moderate 2 unhealthy d/yr today · 5 by 30 yrs out
Nearby sold comps map
Loading sold comps map…
Walkable amenities ~0.75 mi
Loading nearby amenities…
Taxation est. · year 1
- Rental income
- $23,977
- − Mortgage interest
- −$13,438
- − Property taxes
- −$3,812
- − Insurance
- −$1,200
- − Repairs & maintenance
- −$1,918
- − Management
- −$1,918
- − HOA
- −$348
- − Depreciation
- −$6,979
- Taxable loss
- −$5,636
- Est. tax savings @ 24.0%
- +$1,353
- After-tax cash flow
- $-162/yr
For passive investors: Depreciation is non-cash, so a rental often shows a tax loss while cash-flowing — sheltering income. Rental losses are passive: they offset passive income freely, and up to $25,000/yr can offset ordinary (W-2) income if you actively participate and your MAGI is under $100k (phasing out to $0 by $150k); unused losses carry forward. On sale, claimed depreciation is recaptured at up to 25%, and gains may owe capital-gains tax (a 1031 exchange can defer both). Figures are a year-1 estimate at your 24.0% rate — not tax advice; consult a CPA.
Schools (NCES district)
- District
- Birmingham City
- NCES district ID
- 0100390
- Math proficiency
- 4% ▼ -17.00%
- Reading proficiency
- 20% ▼ -4.00%
- Median HH income
- $31,988
- Composite
- 9.49/100
- National rank
- #9850
- State rank
- #116 of 129 in AL
Livability — Birmingham
- Score
- 67/100
- State rank
- #78
- US rank
- #10412
Category grades
Schools grade is shown separately in the Schools card above.
Census & demographics
- Census place
- Birmingham, AL
- County
- Jefferson County · 527,445 people
- City population
- 210,422
- Metro
- Birmingham-Hoover, AL
- Population (ZIP)
- 24,924
- Household income
- $34,884
- Rent vs Own
- Severe rent burden
- 2161.0
Population outlook (Jefferson County) Hauer SSP2
- Today (2025)
- 669,185 people
- By 2030
- 669,694 · +0.1%
- By 2040
- 661,388 · -1.2%
- By 2050
- 643,086 · -3.9%
- By 2075
- 577,267 · -13.7%
- By 2100
- 474,758 · -29.1%
Race, ethnicity, and origin ACS 2023
- Neighborhood character
- Predominantly Black (77%)
- Race & ethnicity
- Black 77% White 10% Hispanic / Latino 10% Two or more races 4%
- Hispanic origin (detail)
- Mexican 7%
- Foreign-born
- 6% · Canada
- Languages at home
- 91% English-only · Spanish 8% French/Haitian/Cajun 1%
Political lean MEDSL · Jefferson
- 2024 margin
- D (+10.4) · D 54.6% · R 44.2% · Other 1.2%
- 2008→2024 swing
- +5.4pp toward D · 2008: 5.1pp · 2024: 10.4pp
- All cycles
- 2024: D+10.4 2020: D+13.2 2016: D+7.2 2012: D+6.0 2008: D+5.1
Not yet ingested
- Civics
- —
Market trends
- HPI YoY
- ▼ -49.29%
- Current HPI
- 91.2903
- Rent YoY
- ▬ -0.01%
- Metro
- Birmingham-Hoover, AL
- State GDP YoY
- ▲ 2.94%
- F500 in state
- 4
Industry mix (Fortune 500 HQ in AL)
| Industry | F500 HQs | Revenue |
|---|---|---|
| Financial Services | 1 | $8B |
|
||
| Healthcare | 1 | $5B |
|
||
Price history
+11.1% since first listed8 events — show timeline
- 2026-04-11 Price Changed $249,900 Greater Alabama MLS
- 2026-03-06 Listed $254,900 Greater Alabama MLS
- 2022-03-01 Sold (Public Records) $242,504 Public Records
- 2021-06-17 Sold (Public Records) $225,000 Public Records
- 2021-06-16 Sold (MLS) $225,000 Greater Alabama MLS
- 2021-05-10 Contingent — Greater Alabama MLS
- 2021-05-06 Listed $225,000 Greater Alabama MLS
- 2021-04-30 Coming Soon $225,000 Greater Alabama MLS
Property tax history
+11.9%/yrLatest (2025): $3,812 · +1.4% YoY. Source: county tax records.
Cash-flow waterfall
monthlySold comps — $/sqft
last 12 mo · ≤1 miLoading sold comps…