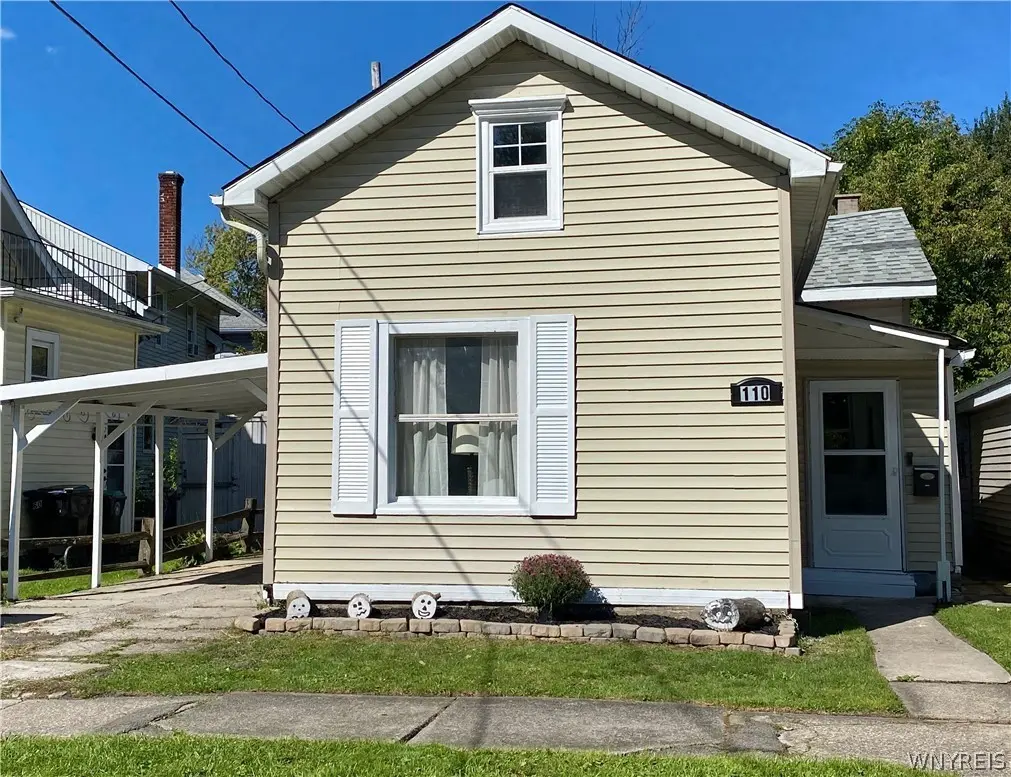
110 Hill St · Tonawanda, NY
Flood risk 4/10 · Minor
- FEMA flood zone
- X (unshaded)
- Chance of flooding over 30 yrs
- 0.23%
- Est. flood insurance / yr
- $473 – $860
Fire risk 1/10 · Minimal
- Est. fire insurance / yr
- $691 – $1,283
Heat risk 2/10 · Minimal
- Hot days now (above 93°F)
- 7 days/yr
- Hot days in 30 yrs
- 15 days/yr
Wind risk 1/10 · Minimal
- Chance of severe wind over 30 yrs
- —
Air-quality risk 3/10 · Minor
- Unhealthy air days now
- 3 days/yr
- Unhealthy air days in 30 yrs
- 4 days/yr
Risk factors via First Street. Map © Google.
Why this score? — see what drove the C+ grade
The composite is a weighted blend of 9 inputs, each scored 0–100. Each bar is that input's sub-score; the figure is the points it added to the 100-point composite (weight × sub-score).
- Cash flow +25.1/30.0
- DSCR +8.2/10.0
- ARV discount +7.5/15.0
- 1% rule +5.8/10.0
- Livability +4.5/5.0
- Rent growth +4.2/5.0
- Schools +3.5/10.0
- Condition / age +2.5/5.0
- Appreciation +0.0/10.0
$160,000
🖨 Deal sheet (PDF) 📄 Offer letter ✓ Due diligence
Listing remarks MLS
Affordable home for the budget minded home buyer or to add to your rental portfolio. 3 bedrooms and 1 1/2 baths. There are 3 built in fire places to keep the cold off in the winter. Newer electrical service and heat. Close to all the attractions Tonawanda has to offer. Weekday showings preferred after 6:00 pm , weekends by appointment.
Key facts
- Hot water tank
- Enclosed foyer
- Electrical service
Tags
Neighborhood map
What this means for you Summary
Snapshot
- This is a 3-bed/1.5-bath single-family listed at $160k.
Deal economics
- At list price, monthly cash flow is $355 ($4k/yr) — positive.
- The deal already cash-flows at list — no discount required.
- Meets the 1% rule at list price ($2k rent vs $160k).
Location & tenants
- Location reads 89/100 on livability (#8 in NY, #169 nationally) — a professional / high-income tenant draw. Strengths: amenities A+, commute A+, cost of living A+.
- Tonawanda City School District (suburban): math 39% / reading 43% proficiency, ranked #508 of 590 in NY (top 86%) — families likely to look elsewhere, expect single-tenant / working-renter base with shorter leases.
- Zoned schools: Riverview Elementary School (math 24% / reading 54%, grade F, #1,444 of 2,108 statewide, top 71%, 366 students, 50% FRL); Fletcher Elementary School (math 27% / reading 37%); Tonawanda Middle/High School (math 49% / reading 43%, grade D-, #1,023 of 1,100 statewide, top 93%, 1,011 students, 46% FRL).
- Market conditions: Rents rising fast (+6.8%/yr); 193 active listings in the ZIP; 4 comparable units currently listed for rent nearby; rentals leasing fast (median 5d on market — plan ~1-2 weeks tenant-placement turnaround); 1,244 units permitted in Erie County in 2024 (563 in 5+ unit buildings).
Forward outlook
- Local home prices are declining (-3.0%/yr); year-one equity from $1k of loan paydown is wiped out by about $5k of value loss. Plan a longer hold.
- At projected returns (-3.0% appreciation + 6.8% rent growth), your $45k cash investment doubles in ~8 years — after that, you're playing with house money.
Negotiation context
- Only 8 days on market — expect competitive offers; lowballing is unlikely to land.
- 5 sale attempts since 6y ago with the ask held roughly flat each time — persistent listings suggest the price (not the market) is what's stuck; bring a comps-based counter.
- Current owner paid $130k; 23% above their basis — modest negotiation headroom, anchor on the comps not their cost.
Risks & watch-outs
- Watch-outs: built in 1900 — expect roof / HVAC / electrical / plumbing capex.
Questions for the listing agent
- Built in 1900 — when were the roof, HVAC, electrical panel, plumbing, and water heater last replaced?
- Is there a deadline driving the sale (1031 exchange, divorce, estate, relocation)? That informs how much negotiation room exists.
- Schools are B-rated — typically a magnet for longer-tenancy family renters. What's the average tenant stay here, and is there a school-zone premium baked into asking?
- What's the average days-on-market for RENTAL listings here right now (not sales)? A rising rental-DOM trend means longer vacancies and softer asking-rent achievability than the comps imply.
- What's the recent tenant-quality profile in this submarket — average credit score on applications, eviction rate, late-payment / NSF rate, and stable-employment percentage? A property-management company in the area should have these aggregated.
- How much new for-sale + rental construction is in the pipeline within 1–3 miles? Heavy new supply typically softens prices + rents 12–24 months out; constrained supply supports both.
Investment metrics
- 1% rule
- 1.08% ✓
- Cap rate
- 8.95%
- Cash-on-cash
- 9.50%
- DSCR
- 1.42
- GRM
- 7.7
CMA / ARV
No comps found within radius.
Projected returns pro-forma
-3.0% appreciation · 6.75% rent growth · sell at horizon
- IRR
- 1.9%
- Equity multiple
- 1.08×
- Total profit
- $3,390
- Equity at exit
- $23,857
- IRR
- 14.7%
- Equity multiple
- 2.38×
- Total profit
- $61,874
- Equity at exit
- $13,834
Cash invested: $44,800 (down + closing). Projections, not guarantees.
Landlord ↔ Tenant lean methodology
- Overall (STATE)
- 15 Strongly Tenant-Friendly
- State New York
- 15 Strongly Tenant-Friendly · D+10
- County
- — inherits STATE
- City
- — inherits STATE
ZIP-level market 14150
- Rents YoY
- 6.8%
- Active inventory
- 193
- Price-to-rent
- 7.7×
Monthly cashflow live
- Estimated rent
- $1,727 medium interval (Pro) →
- Mortgage (P&I)
- −$839
- Tax from tax record
- −$104 /mo · $1,243/yr
- Insurance
- −$67
- HOA
- −$0
- Vacancy / Maint / Mgmt
- −$363
- Net cashflow
- $355
Break-even live
Sensitivity live
| Price | -10% $445 | -5% $400 | +0% $355 | +5% $309 | +10% $264 |
|---|---|---|---|---|---|
| Rent | -10% $218 | -5% $286 | +0% $355 | +5% $423 | +10% $491 |
| Rate | -1.0pp $435 | -0.5pp $395 | base $355 | +0.5pp $313 | +1.0pp $271 |
UW: 25.0% down · 7.5% · 30yr · 1.5% tax · 5.0% vac · 8.0% maint · 8.0% mgmt
Financing live
Cash to close
- Down payment
- $40,000
- Closing costs
- $4,800
- Reserves months
- —
- Total cash needed
- —
Loan-product check · same deal, 3 products live
Conventional
25% down · 7.5% · 30yr
- Down + closing
- —
- Monthly P&I
- —
- Monthly cashflow
- —
- DSCR
- —
- Eligible?
- —
Personal DTI + credit; lowest rate.
DSCR
20% down · 8.5% · 30yr
- Down + closing
- —
- Monthly P&I
- —
- Monthly cashflow
- —
- DSCR
- —
- Eligible?
- —
No personal income docs; deal must DSCR.
Hard money
10% down · 12.0% · 12mo
- Down + closing
- —
- Monthly P&I
- —
- Monthly cashflow
- —
- DSCR
- —
- Eligible?
- —
Short-term bridge; refi at stabilization.
Rent comps 4 comps
| Address | Beds | Baths | Sqft | Rent | $/sqft | DOM | Units | Dist |
|---|---|---|---|---|---|---|---|---|
| 115 Klinger Ave Tonawanda, NY | 3.0 | 1.0 | 1200 | $1,450 | $1.21 | 5d | 1 | 0.33mi |
| 184 Sweeney St North Tonawanda, NY | 2.0 | 2.0 | 1155 | $2,000 | $1.73 | 3d | 1 | 0.81mi |
| 53 Winkler Dr Tonawanda, NY | 3.0 | 1.0 | 1060 | $2,100 | $1.98 | 13d | 1 | 1.03mi |
| 330 E Niagara St Tonawanda, NY | 1.0–2.0 | 1.0–2.0 | 975 | $1,900 | $1.95 | 3d | 1 | 1.23mi |
Listing history 20 events
-
2026-04-16status Pending
-
2026-04-08$160,000 Active
-
2024-12-05historical
-
2024-11-24price $163,900
-
2024-10-28status Active
-
2024-10-25status Pending
-
2024-10-05$168,900 Active
-
2024-08-30soldstatus $130,000
-
2024-08-27soldstatus $130,000 Closed 339-char remark
Show marketing remark (339 chars)
Affordable home for the budget minded home buyer or to add to your rental portfolio. 3 bedrooms and 1 1/2 baths. There are 3 built in fire places to keep the cold off in the winter. Newer electrical service and heat. Close to all the attractions Tonawanda has to offer. Weekday showings preferred after 6:00 pm , weekends by appointment.
-
2024-06-23status Pending 339-char remark
Show marketing remark (339 chars)
Affordable home for the budget minded home buyer or to add to your rental portfolio. 3 bedrooms and 1 1/2 baths. There are 3 built in fire places to keep the cold off in the winter. Newer electrical service and heat. Close to all the attractions Tonawanda has to offer. Weekday showings preferred after 6:00 pm , weekends by appointment.
-
2024-06-10$109,900 Active 339-char remark
Show marketing remark (339 chars)
Affordable home for the budget minded home buyer or to add to your rental portfolio. 3 bedrooms and 1 1/2 baths. There are 3 built in fire places to keep the cold off in the winter. Newer electrical service and heat. Close to all the attractions Tonawanda has to offer. Weekday showings preferred after 6:00 pm , weekends by appointment.
-
2021-02-02soldstatus $65,800
-
2021-01-21soldstatus $65,800 Closed Sale or Rented
-
2020-11-11status Pending Sale
-
2020-10-26status Under Contract- Do Not Show
-
2020-09-24price $65,000
-
2020-08-10price $60,000
-
2020-08-04$65,000 Active
-
2000-07-21soldstatus $32,000
-
1993-01-15soldstatus $13,755
ⓘ Source: listings_history table (triggers on properties + properties_extension) + one-shot
backfill from property_details.listing_events for pre-trigger history.
Tax reassessment forecast NY · Partial reset (capped growth)
- Current annual tax
- $1,243 · $104/mo
- Projected year-2 tax
- $1,974 · $164/mo
- Expected delta
- +$730/yr (+$61/mo · 58.8%)
ⓘ Screening estimate from a state-policy table — verify with the county assessor before closing.
Climate risk First Street
- Flood 4/10 Moderate FEMA zone X (unshaded) · 23% chance over 30 yrs
- Wildfire 1/10 Low
- Heat 2/10 Low 7 d/yr ≥93°F today · 15 d/yr by 30 yrs out
- Wind 1/10 Low
- Air quality 3/10 Moderate 3 unhealthy d/yr today · 4 by 30 yrs out
Nearby sold comps map
Loading sold comps map…
Walkable amenities ~0.75 mi
Loading nearby amenities…
Taxation est. · year 1
- Rental income
- $20,719
- − Mortgage interest
- −$8,962
- − Property taxes
- −$1,243
- − Insurance
- −$800
- − Repairs & maintenance
- −$1,658
- − Management
- −$1,658
- − Depreciation
- −$4,655
- Taxable income
- $1,744
- Est. tax owed @ 24.0%
- −$419
- After-tax cash flow
- $3,838/yr
For passive investors: Depreciation is non-cash, so a rental often shows a tax loss while cash-flowing — sheltering income. Rental losses are passive: they offset passive income freely, and up to $25,000/yr can offset ordinary (W-2) income if you actively participate and your MAGI is under $100k (phasing out to $0 by $150k); unused losses carry forward. On sale, claimed depreciation is recaptured at up to 25%, and gains may owe capital-gains tax (a 1031 exchange can defer both). Figures are a year-1 estimate at your 24.0% rate — not tax advice; consult a CPA.
Schools (NCES district)
- District
- Tonawanda City School District
- NCES district ID
- 3628740
- Math proficiency
- 39% ▼ -19.00%
- Reading proficiency
- 43% ▼ -7.00%
- Median HH income
- $47,061
- Composite
- 35.03/100
- National rank
- #5041
- State rank
- #508 of 590 in NY
Livability — Tonawanda
- Score
- 89/100
- State rank
- #8
- US rank
- #169
Category grades
Schools grade is shown separately in the Schools card above.
Census & demographics
- Census place
- Tonawanda, NY
- County
- Erie County · 714,559 people
- City population
- 41,260
- Metro
- Buffalo-Cheektowaga, NY
- Population (ZIP)
- 41,260
- Household income
- $71,406
- Rent vs Own
- Severe rent burden
- 1427.0
Population outlook (Erie County) Hauer SSP2
- Today (2025)
- 933,037 people
- By 2030
- 935,181 · +0.2%
- By 2040
- 928,531 · -0.5%
- By 2050
- 905,725 · -2.9%
- By 2075
- 834,037 · -10.6%
- By 2100
- 708,033 · -24.1%
Race, ethnicity, and origin ACS 2023
- Neighborhood character
- Predominantly White (87%)
- Race & ethnicity
- White 87% Two or more races 5% Hispanic / Latino 5% Black 4% Asian 2%
- Common ancestry
- Romanian 13% Lithuanian 3% Slovak 2%
- Foreign-born
- 6% · Canada, Philippines, Vietnam
- Languages at home
- 94% English-only · Other Indo-European 2% Spanish 1% Russian/Polish/Slavic 1%
Political lean MEDSL · Erie
- 2024 margin
- Lean D (+9.7) · D 54.8% · R 45.2%
- 2008→2024 swing
- -7.9pp toward R · 2008: 17.5pp · 2024: 9.7pp
- All cycles
- 2024: D+9.7 2020: D+14.7 2016: D+4.8 2012: D+15.6 2008: D+17.5
Not yet ingested
- Civics
- —
Market trends
- HPI YoY
- ▼ -260.43%
- Current HPI
- 334.5893
- Rent YoY
- ▲ 6.75%
- Metro
- Buffalo-Cheektowaga, NY
- State GDP YoY
- ▲ 2.60%
- F500 in state
- 92
Industry mix (Fortune 500 HQ in NY)
| Industry | F500 HQs | Revenue |
|---|---|---|
| Financial Services | 10 | $950B |
|
||
| Consumer Goods | 9 | $162B |
|
||
| Insurance | 4 | $225B |
|
||
| Telecommunications | 2 | $144B |
|
||
| Pharmaceuticals | 2 | $112B |
|
||
| Media / Entertainment | 2 | $69B |
|
||
Price history
+1063.2% since first listed20 events — show timeline
- 2026-04-16 Pending — WNYREIS
- 2026-04-08 Listed $160,000 WNYREIS
- 2024-12-05 Listing Removed — WNYREIS
- 2024-11-24 Price Changed $163,900 WNYREIS
- 2024-10-28 Relisted — WNYREIS
- 2024-10-25 Pending — WNYREIS
- 2024-10-05 Listed $168,900 WNYREIS
- 2024-08-30 Sold (Public Records) $130,000 Public Records
- 2024-08-27 Sold (MLS) $130,000 UNYREIS
- 2024-06-23 Pending — UNYREIS
- 2024-06-10 Listed $109,900 UNYREIS
- 2021-02-02 Sold (Public Records) $65,800 Public Records
- 2021-01-21 Sold (MLS) $65,800 WNYREIS
- 2020-11-11 Pending — WNYREIS
- 2020-10-26 Pending — WNYREIS
- 2020-09-24 Price Changed $65,000 WNYREIS
- 2020-08-10 Price Changed $60,000 WNYREIS
- 2020-08-04 Listed $65,000 WNYREIS
- 2000-07-21 Sold (Public Records) $32,000 Public Records
- 1993-01-15 Sold (Public Records) $13,755 Public Records
Property tax history
+5.9%/yrLatest (2025): $1,243 · +2.8% YoY. Source: county tax records.
Cash-flow waterfall
monthlySold comps — $/sqft
last 12 mo · ≤1 miLoading sold comps…