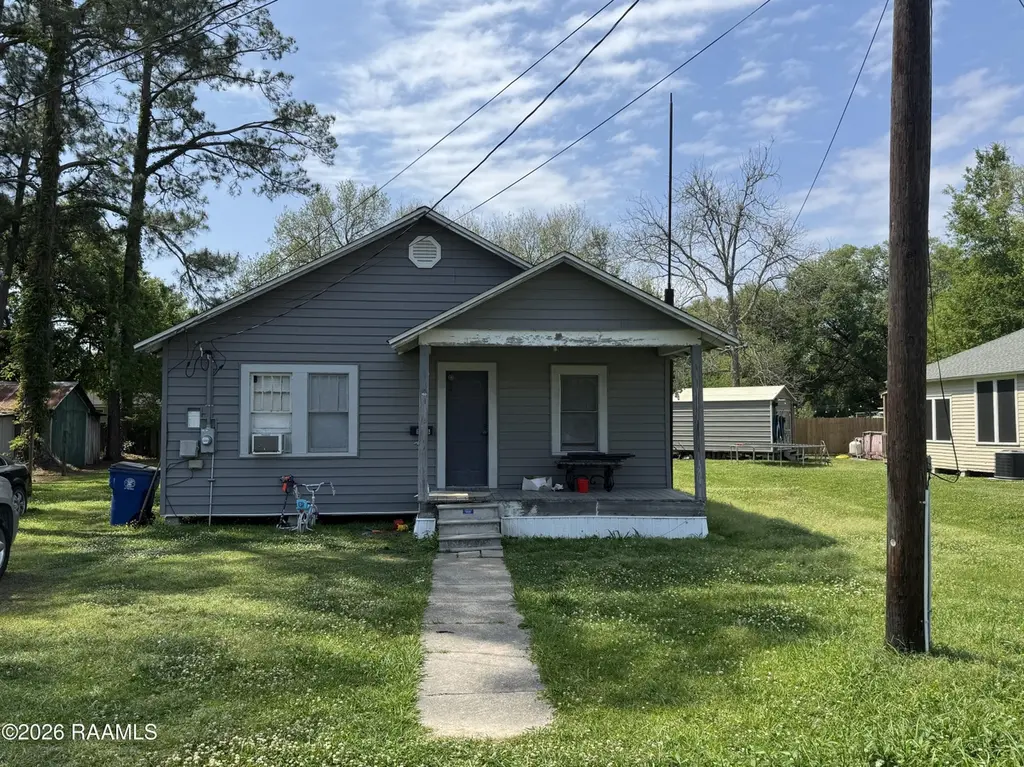
1408 Robert St · Rayne, LA
Flood risk 1/10 · Minimal
- FEMA flood zone
- X (unshaded)
- Chance of flooding over 30 yrs
- 0.0%
- Est. flood insurance / yr
- $507 – $1,088
Fire risk 1/10 · Minimal
- Est. fire insurance / yr
- $1,269 – $2,357
Heat risk 9/10 · Severe
- Hot days now (above 109°F)
- 7 days/yr
- Hot days in 30 yrs
- 20 days/yr
Wind risk 9/10 · Severe
- Chance of severe wind over 30 yrs
- 99.0%
Air-quality risk 1/10 · Minimal
- Unhealthy air days now
- 0 days/yr
- Unhealthy air days in 30 yrs
- 0 days/yr
Risk factors via First Street. Map © Google.
Why this score? — see what drove the C+ grade
The composite is a weighted blend of 9 inputs, each scored 0–100. Each bar is that input's sub-score; the figure is the points it added to the 100-point composite (weight × sub-score).
- Cash flow +24.6/30.0
- ARV discount +15.0/15.0
- DSCR +7.9/10.0
- 1% rule +5.4/10.0
- Livability +3.8/5.0
- Schools +3.2/10.0
- Rent growth +2.5/5.0
- Condition / age +2.5/5.0
- Appreciation +0.0/10.0
$95,800
🖨 Deal sheet 📄 Offer letter ✓ Due diligence
Listing remarks MLS
Nice starter home or investment property. In need of tender care.
Key facts
- 100 occupancy rate
- 2 city lots
- 9,583 sq ft lot
Tags
Property features AI
Exterior
- Parking: Open parking
- Utilities: Public sewer; City electric
- Home design: Single family residence
- Construction: Vinyl siding; Asbestos shingle roof
- Exterior features: No fencing; City street frontage (paved)
Interior
- Kitchen: Gas stove
- Flooring: Carpet; Vinyl
- Bathrooms: 1 full bathroom
- Heating & cooling: Central heating (natural gas); Central air conditioning
- Interior features: Formica counters
- Laundry & utility: Washer hookup; Electric dryer hookup
Neighborhood map
What this means for you Summary
Snapshot
- This is a 2-bed/1.0-bath single-family listed at $96k.
Deal economics
- At list price, monthly cash flow is $198 ($2k/yr) — positive.
- The deal already cash-flows at list — no discount required.
- Meets the 1% rule at list price ($995 rent vs $96k).
- Recommended offer: $90k (6.0% below list) — sets the bar for market timing.
- Cap rate 8.8% vs local median 5.4% in Rayne — top-decile yield for the area; either an underpriced asset or a hidden risk that comps aren't pricing in. Stress-test before assuming the spread holds.
Location & tenants
- Location reads 75/100 on livability (#18 in LA, #3,895 nationally) — a middle-class / working-renter tenant base. Strengths: crime A+, cost of living A+, housing A+; Watch: amenities F, commute F, employment F.
- Acadia Parish (rural): math 32% / reading 44% proficiency, ranked #28 of 98 in LA (top 29%) — families likely to look elsewhere, expect single-tenant / working-renter base with shorter leases; 62% free/reduced lunch — lower-income household profile, screen leases tightly.
- Zoned schools: Martin Petitjean Elementary School (math 32% / reading 47%, grade F, #224 of 646 statewide, top 37%, 342 students, 85% FRL); Armstrong Middle School (math 15% / reading 38%, grade F, #135 of 218 statewide, top 62%, 340 students, 79% FRL); Rayne High School (math 30% / reading 47%, grade F, #88 of 265 statewide, top 33%, 640 students, 63% FRL).
- Market conditions: 95 active listings in the ZIP; 1 comparable units currently listed for rent nearby; 137 units permitted in Acadia Parish in 2024 (0 in 5+ unit buildings).
Forward outlook
- Local home prices are declining (-3.0%/yr); year-one equity from $662 of loan paydown is wiped out by about $3k of value loss. Plan a longer hold.
Negotiation context
- It's been on market 74 days — a 6% lower offer ($90k) is reasonable based on typical stale-listing flexibility.
- 2 sale attempts since 9y ago with the ask held roughly flat each time — persistent listings suggest the price (not the market) is what's stuck; bring a comps-based counter.
- Current owner paid $44k; list at $96k implies a 120% gain — meaningful room to come down on a strong offer.
Risks & watch-outs
- Climate carrying-cost: severe wind risk, 99% chance of damaging wind over 30y; extreme-heat days projected 7→20/yr by 2055 (HVAC capex compounding) — expect insurance premiums to compound above CPI over the hold.
Questions for the listing agent
- It's been on market 74 days. Have you received any prior offers? Is the seller open to a 6% concession, seller financing, or rate buy-down credit?
- Why hasn't it sold? Are there any deal-killer items the seller is aware of (foundation, flood, title, zoning, code violations)?
- Is there a deadline driving the sale (1031 exchange, divorce, estate, relocation)? That informs how much negotiation room exists.
- Schools are B-rated — typically a magnet for longer-tenancy family renters. What's the average tenant stay here, and is there a school-zone premium baked into asking?
- What's the average days-on-market for RENTAL listings here right now (not sales)? A rising rental-DOM trend means longer vacancies and softer asking-rent achievability than the comps imply.
- What's the recent tenant-quality profile in this submarket — average credit score on applications, eviction rate, late-payment / NSF rate, and stable-employment percentage? A property-management company in the area should have these aggregated.
- How much new for-sale + rental construction is in the pipeline within 1–3 miles? Heavy new supply typically softens prices + rents 12–24 months out; constrained supply supports both.
Investment metrics
- 1% rule
- 1.04% ✓
- Cap rate
- 8.77%
- Cash-on-cash
- 8.86%
- DSCR
- 1.39
- GRM
- 8.0
CMA / ARV
- ARV (on-the-fly)
- $118,908
- Comps found
- 9
Show comp detail 9 sales within ~0.75 mi
| Address | Dist | Beds/Ba | Sqft | Sold | Price | $/sf | Match |
|---|---|---|---|---|---|---|---|
| 1207 Robert St | 0.22mi | 2/1.0 | 1,093 (-1%) | 3mo | $108,000 | $99 | 86 |
| 1306 Barbara St | 0.10mi | 3/1.0 (+1) | 1,186 (+8%) | 6mo | $130,000 | $110 | 72 |
| 215 E Branche St | 0.43mi | 2/2.0 | 1,160 (+5%) | 2mo | $121,700 | $105 | 65 |
| 1213 S Marie St | 0.20mi | 3/2.0 (+1) | 1,203 (+9%) | 6mo | $165,000 | $137 | 61 |
| 1111 Barbara St | 0.28mi | 3/1.0 (+1) | 1,192 (+8%) | 10mo | $149,500 | $125 | 60 |
| 607 Leblanc Ave | 0.39mi | 3/2.0 (+1) | 1,008 (-8%) | 15mo | $95,000 | $94 | 46 |
| 805 S Mcgown St | 0.54mi | 3/1.0 (+1) | 968 (-12%) | 10mo | $42,500 | $44 | 41 |
| 608 S Parkerson St | 0.61mi | 2/1.0 | 1,237 (+12%) | 12mo | $134,020 | $108 | 41 |
| 808 6th St | 0.68mi | 2/1.0 | 940 (-15%) | 10mo | $125,000 | $133 | 35 |
Match score weights: distance 35% · size 25% · config 20% · recency 20%. Top-matched comps best support the ARV.
Projected returns pro-forma
-3.0% appreciation · 3.0% rent growth · sell at horizon
- IRR
- -2.9%
- Equity multiple
- 0.89×
- Total profit
- $-2,936
- Equity at exit
- $14,284
- IRR
- 6.8%
- Equity multiple
- 1.51×
- Total profit
- $13,568
- Equity at exit
- $8,283
Cash invested: $26,824 (down + closing). Projections, not guarantees.
Landlord ↔ Tenant lean methodology
- Overall (STATE)
- 90 Strongly Landlord-Friendly
- State Louisiana
- 90 Strongly Landlord-Friendly · R+12
- County
- — inherits STATE
- City
- — inherits STATE
ZIP-level market 70578
- Active inventory
- 95
- Price-to-rent
- 8.0×
Monthly cashflow live
- Estimated rent
- $995 medium interval (Pro) →
- Mortgage (P&I)
- −$502
- Tax from tax record
- −$46 /mo · $548/yr
- Insurance
- −$40
- HOA
- −$0
- Vacancy / Maint / Mgmt
- −$209
- Net cashflow
- $198
Break-even live
UW: 25.0% down · 7.5% · 30yr · 1.5% tax · 5.0% vac · 8.0% maint · 8.0% mgmt
Financing live
Cash to close
- Down payment
- $23,950
- Closing costs
- $2,874
- Reserves months
- —
- Total cash needed
- —
Loan-product check · same deal, 3 products live
Conventional
25% down · 7.5% · 30yr
- Down + closing
- —
- Monthly P&I
- —
- Monthly cashflow
- —
- DSCR
- —
- Eligible?
- —
Personal DTI + credit; lowest rate.
DSCR
20% down · 8.5% · 30yr
- Down + closing
- —
- Monthly P&I
- —
- Monthly cashflow
- —
- DSCR
- —
- Eligible?
- —
No personal income docs; deal must DSCR.
Hard money
10% down · 12.0% · 12mo
- Down + closing
- —
- Monthly P&I
- —
- Monthly cashflow
- —
- DSCR
- —
- Eligible?
- —
Short-term bridge; refi at stabilization.
Rent comps 1 comps
| Address | Beds | Baths | Sqft | Rent | $/sqft | DOM | Units | Dist |
|---|---|---|---|---|---|---|---|---|
| 422 Ann Dr Rayne, LA | 3.0 | 1.0 | 1100 | $995 | $0.90 | 21d | 1 | 1.39mi |
Listing history 19 events
-
2026-06-18days on market $95,800 Active 74 DOM
-
2026-06-17days on market $95,800 Active 73 DOM
-
2026-06-16days on market $95,800 Active 72 DOM
-
2026-06-15days on market $95,800 Active 71 DOM
-
2026-06-13days on market $95,800 Active 69 DOM
-
2026-06-12days on market $95,800 Active 68 DOM
-
2026-06-09days on market $95,800 Active 65 DOM
-
2026-06-08days on market $95,800 Active 64 DOM
-
2026-06-07days on market $95,800 Active 63 DOM
-
2026-06-07days on market $95,800 Active 62 DOM
-
2026-06-04days on market $95,800 Active 59 DOM
-
2026-06-02days on market $95,800 Active 58 DOM
-
2026-06-01days on market $95,800 Active 57 DOM
-
2026-05-31days on market $95,800 Active 56 DOM
-
2026-05-31days on market $95,800 Active 55 DOM
-
2026-04-01$95,800 Active
-
2018-02-05soldstatus $43,500 66-char remark
Show marketing remark (66 chars)
Nice starter home or investment property. In need of tender care.
-
2018-02-05soldstatus $43,500
Show marketing remark (66 chars)
Nice starter home or investment property. In need of tender care.
-
2017-12-03$52,000 66-char remark
Show marketing remark (66 chars)
Nice starter home or investment property. In need of tender care.
ⓘ Source: listings_history table (triggers on properties + properties_extension) + one-shot
backfill from property_details.listing_events for pre-trigger history.
Tax reassessment forecast LA · Resets to sale price
- Current annual tax
- $548 · $46/mo
- Projected year-2 tax
- $548 · $46/mo
- Expected delta
- $0/yr ($0/mo · 0.0%)
ⓘ Screening estimate from a state-policy table — verify with the county assessor before closing.
Climate risk First Street
- Flood 1/10 Low FEMA zone X (unshaded) · 0% chance over 30 yrs
- Wildfire 1/10 Low
- Heat 9/10 Extreme 7 d/yr ≥109°F today · 20 d/yr by 30 yrs out
- Wind 9/10 Extreme 99% chance of damaging wind over 30 yrs
- Air quality 1/10 Low 0 unhealthy d/yr today · 0 by 30 yrs out
Nearby sold comps map
Loading sold comps map…
Walkable amenities ~0.75 mi
Loading nearby amenities…
Taxation est. · year 1
- Rental income
- $11,940
- − Mortgage interest
- −$5,366
- − Property taxes
- −$548
- − Insurance
- −$479
- − Repairs & maintenance
- −$955
- − Management
- −$955
- − Depreciation
- −$2,787
- Taxable income
- $850
- Est. tax owed @ 24.0%
- −$204
- After-tax cash flow
- $2,173/yr
For passive investors: Depreciation is non-cash, so a rental often shows a tax loss while cash-flowing — sheltering income. Rental losses are passive: they offset passive income freely, and up to $25,000/yr can offset ordinary (W-2) income if you actively participate and your MAGI is under $100k (phasing out to $0 by $150k); unused losses carry forward. On sale, claimed depreciation is recaptured at up to 25%, and gains may owe capital-gains tax (a 1031 exchange can defer both). Figures are a year-1 estimate at your 24.0% rate — not tax advice; consult a CPA.
Schools (NCES district)
- District
- Acadia Parish
- NCES district ID
- 2200030
- Math proficiency
- 32% ▼ -39.00%
- Reading proficiency
- 44% ▼ -32.00%
- Median HH income
- $38,012
- Composite
- 31.65/100
- National rank
- #5929
- State rank
- #28 of 98 in LA
Livability — Rayne
- Score
- 75/100
- State rank
- #18
- US rank
- #3895
Category grades
Schools grade is shown separately in the Schools card above.
Census & demographics
- Census place
- Rayne, LA
- City population
- 16,279
- Population (ZIP)
- 16,279
Population outlook (Acadia County) Hauer SSP2
- Today (2025)
- 63,846 people
- By 2030
- 64,141 · +0.5%
- By 2040
- 63,922 · +0.1%
- By 2050
- 62,263 · -2.5%
- By 2075
- 56,507 · -11.5%
- By 2100
- 46,316 · -27.5%
Race, ethnicity, and origin ACS 2023
- Neighborhood character
- Predominantly White (71%)
- Race & ethnicity
- White 71% Black 21% Two or more races 5% Hispanic / Latino 3%
- Common ancestry
- Lithuanian 15%
- Foreign-born
- 0%
- Languages at home
- 91% English-only · French/Haitian/Cajun 8% Spanish 1%
Political lean MEDSL · Acadia
- 2024 margin
- Solid R (+64.0) · D 17.6% · R 81.5%
- 2008→2024 swing
- -18.3pp toward R · 2008: -45.7pp · 2024: -64.0pp
- All cycles
- 2024: R+64.0 2020: R+60.3 2016: R+56.7 2012: R+49.8 2008: R+45.7
Not yet ingested
- Civics
- —
Market trends
- HPI YoY
- ▼ -77.19%
- Current HPI
- 118.9619
- Rent YoY
- —
- Metro
- —
- State GDP YoY
- ▲ 3.29%
- F500 in state
- 10
Industry mix (Fortune 500 HQ in LA)
| Industry | F500 HQs | Revenue |
|---|---|---|
| Telecommunications | 2 | $23B |
|
||
| Utilities | 1 | $12B |
|
||
| Wholesale / Distribution | 1 | $5B |
|
||
| Advertising | 1 | $2B |
|
||
Price history
+84.2% since first listed4 events — show timeline
- 2026-04-01 Listed $95,800 AcadianaMLS
- 2018-02-05 Sold (Public Records) $43,500 Public Records
- 2018-02-05 Sold (MLS) $43,500 AcadianaMLS
- 2017-12-03 Listed $52,000 AcadianaMLS
Property tax history
+11.8%/yrLatest (2025): $548 · +0.3% YoY. Source: county tax records.
Cash-flow waterfall
monthlySold comps — $/sqft
last 12 mo · ≤1 miLoading sold comps…