 Duplex
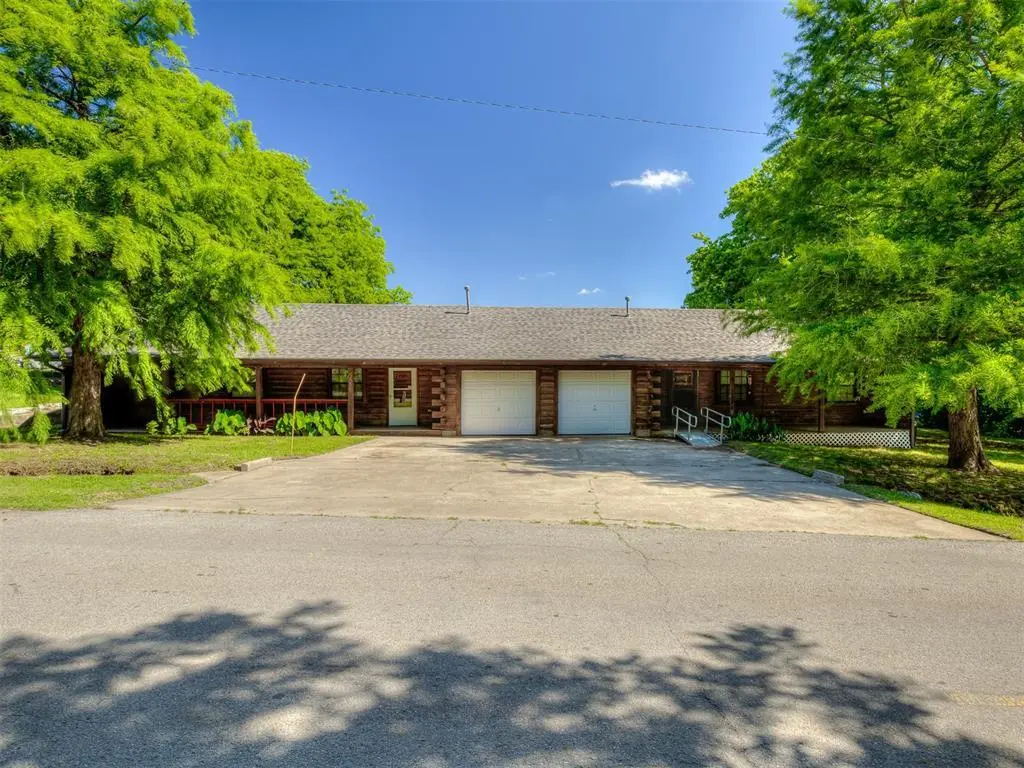
501 E Maple · Noble, OK
Flood risk 1/10 · Minimal
- FEMA flood zone
- X (unshaded)
- Chance of flooding over 30 yrs
- 0.0%
- Est. flood insurance / yr
- $507 – $1,088
Fire risk 4/10 · Minor
- Est. fire insurance / yr
- $2,463 – $4,575
Heat risk 6/10 · Moderate
- Hot days now (above 109°F)
- 7 days/yr
- Hot days in 30 yrs
- 18 days/yr
Wind risk 3/10 · Minor
- Chance of severe wind over 30 yrs
- 6.0%
Air-quality risk 2/10 · Minimal
- Unhealthy air days now
- 1 days/yr
- Unhealthy air days in 30 yrs
- 1 days/yr
Risk factors via First Street. Map © Google.
Why this score? — see what drove the B- grade
The composite is a weighted blend of 9 inputs, each scored 0–100. Each bar is that input's sub-score; the figure is the points it added to the 100-point composite (weight × sub-score).
- Cash flow +30.0/30.0
- DSCR +10.0/10.0
- 1% rule +8.5/10.0
- ARV discount +7.5/15.0
- Livability +3.3/5.0
- Rent growth +2.5/5.0
- Condition / age +2.5/5.0
- Schools +2.1/10.0
- Appreciation +0.0/10.0
$190,000
🖨 Deal sheet 📄 Offer letter ✓ Due diligence
Multi-family units
County records classify this as Multi-Family (2-4 Unit). Listing-text estimate: 2 units. confirmed
Listing remarks
Great investment opportunity or ideal multi-generational setup! This well-maintained duplex offers spacious layouts on both sides with large living areas and functional floor plans. One unit features 2 bedrooms and 1 bathroom, while the second unit includes 2 bedrooms, a dedicated study, and 1 bathroom—perfect for a home office or additional flex space. Situated on a large corner lot in a convenient location close to downtown and within walking distance to the elementary school, this property offers both comfort and accessibility.
Key facts
- Large living areas
- Dedicated study
- 0.24 acre lot
Tags
Property features AI
Finance
- Other: Property on 0.31 acre; Located in Noble Original Town
- Financial info: Not occupied; Listed as investor-friendly residential income (duplex) with 2 units
- HOA & community: No mandatory association dues
Exterior
- Parking: 2 parking spaces
- Utilities: No flood insurance required (per listing)
- Home design: Duplex residential income property; One level
- Construction: Log construction; Composition roof; Slab foundation; Existing property
- Exterior features: Corner lot
Interior
- Bedrooms: 4 bedrooms
- Bathrooms: 2 full bathrooms
- Interior features: Accessible approach with ramp; Handicap accessible
Neighborhood map
What this means for you Summary
Snapshot
- This is a 2 × 2-bed/1.0-bath units multifamily listed at $190k.
Deal economics
- At list price, monthly cash flow is $850 ($10k/yr) — positive. Per door: $425/mo.
- The deal already cash-flows at list — no discount required.
- Meets the 1% rule at list price ($3k rent vs $190k).
- Cap rate 11.7% vs local median 3.7% in Noble — top-decile yield for the area; either an underpriced asset or a hidden risk that comps aren't pricing in. Stress-test before assuming the spread holds.
Location & tenants
- Location reads 66/100 on livability (#107 in OK) — a middle-class / working-renter tenant base. Strengths: employment A+, cost of living A+, housing A+; Watch: amenities F, commute F, health & safety F.
- Noble (suburban): math 23% / reading 25% proficiency, ranked #108 of 270 in OK (top 40%) — low school quality limits family demand, transient renter base, plan for 1-2y turnover.
- Zoned schools: Katherine I Daily Es (379 students, 0% FRL); Noble Hs (math 17% / reading 27%, grade F, #222 of 447 statewide, top 52%, 883 students, 0% FRL) — zoned schools average 0% FRL vs 53% district-wide (53 pts lower); this property's tenant base skews higher-income than the district average.
- Market conditions: 214 active listings in the ZIP; 7 comparable units currently listed for rent nearby; rentals at typical pace (median 17d on market — plan ~3-4 weeks tenant-placement turnaround); 592 units permitted in Cleveland County in 2024 (12 in 5+ unit buildings).
- This rent runs 42% of the median local income ($74k/yr) — at the standard rent-burdened threshold; future hikes will face affordability resistance.
Forward outlook
- Local home prices are declining (-3.0%/yr); year-one equity from $1k of loan paydown is wiped out by about $6k of value loss. Plan a longer hold.
- Cleveland County population projected at +40% by 2050 — long-run rental-demand tailwind backs the buy-and-hold thesis.
- At projected returns (-3.0% appreciation + 3.0% rent growth), your $53k cash investment doubles in ~7 years — after that, you're playing with house money.
Negotiation context
- Only 4 days on market — expect competitive offers; lowballing is unlikely to land.
Risks & watch-outs
- Climate carrying-cost: extreme-heat days projected 7→18/yr by 2055 (HVAC capex compounding) — expect insurance premiums to compound above CPI over the hold.
Questions for the listing agent
- Can we see the unit-by-unit rent roll, current vacancy, and any below-market leases? What's the average tenancy length?
- What capital expenditures (roof, boiler, parking lot, exteriors) have been made in the last 5 years, and what's planned in the next 2?
- Built in 1972 — when were the roof, HVAC, electrical panel, plumbing, and water heater last replaced?
- Is there a deadline driving the sale (1031 exchange, divorce, estate, relocation)? That informs how much negotiation room exists.
- Schools are F-rated, which usually means shorter tenancies and higher turnover. Who's the typical renter profile here, and what's been the actual vacancy rate?
- What's the average days-on-market for RENTAL listings here right now (not sales)? A rising rental-DOM trend means longer vacancies and softer asking-rent achievability than the comps imply.
- What's the recent tenant-quality profile in this submarket — average credit score on applications, eviction rate, late-payment / NSF rate, and stable-employment percentage? A property-management company in the area should have these aggregated.
- How much new apartment / multifamily construction is in the pipeline within 1–3 miles? Heavy new supply (>2% of stock underway) typically softens rents 12–24 months out; light construction supports rent growth.
Investment metrics
- 1% rule
- 1.35% ✓
- Cap rate
- 11.66%
- Cash-on-cash
- 19.18%
- DSCR
- 1.85
- GRM
- 6.2
CMA / ARV
No comps found within radius.
Projected returns pro-forma
-3.0% appreciation · 3.0% rent growth · sell at horizon
- IRR
- 11.1%
- Equity multiple
- 1.44×
- Total profit
- $23,319
- Equity at exit
- $28,330
- IRR
- 20.1%
- Equity multiple
- 2.69×
- Total profit
- $89,847
- Equity at exit
- $16,428
Cash invested: $53,200 (down + closing). Projections, not guarantees.
Landlord ↔ Tenant lean methodology
- Overall (STATE)
- 83 Strongly Landlord-Friendly
- State Oklahoma
- 83 Strongly Landlord-Friendly · R+20
- County
- — inherits STATE
- City
- — inherits STATE
ZIP-level market 73068
- Home prices YoY
- -4.8%
- Active inventory
- 214
- Price-to-rent
- 12.4×
Monthly cashflow live
- Estimated rent
- $2,562 high interval (Pro) →
- Mortgage (P&I)
- −$996
- Tax from tax record
- −$98 /mo · $1,178/yr
- Insurance
- −$79
- HOA
- −$0
- Vacancy / Maint / Mgmt
- −$538
- Net cashflow
- $850
Break-even live
Sensitivity live
| Price | -10% $958 | -5% $904 | +0% $850 | +5% $796 | +10% $743 |
|---|---|---|---|---|---|
| Rent | -10% $648 | -5% $749 | +0% $850 | +5% $951 | +10% $1,053 |
| Rate | -1.0pp $946 | -0.5pp $899 | base $850 | +0.5pp $801 | +1.0pp $751 |
2-unit breakdown (identical units grouped — click to expand)
| Units | Beds | Baths | Est. rent |
|---|---|---|---|
| 2× units | 2 | 1 | $2,562 |
| #1 | 2 | 1 | $1,281 |
| #2 | 2 | 1 | $1,281 |
| Total (2 units) | $2,562 | ||
UW: 25.0% down · 7.5% · 30yr · 1.5% tax · 5.0% vac · 8.0% maint · 8.0% mgmt
Financing live
Cash to close
- Down payment
- $47,500
- Closing costs
- $5,700
- Reserves months
- —
- Total cash needed
- —
Loan-product check · same deal, 3 products live
Conventional
25% down · 7.5% · 30yr
- Down + closing
- —
- Monthly P&I
- —
- Monthly cashflow
- —
- DSCR
- —
- Eligible?
- —
Personal DTI + credit; lowest rate.
DSCR
20% down · 8.5% · 30yr
- Down + closing
- —
- Monthly P&I
- —
- Monthly cashflow
- —
- DSCR
- —
- Eligible?
- —
No personal income docs; deal must DSCR.
Hard money
10% down · 12.0% · 12mo
- Down + closing
- —
- Monthly P&I
- —
- Monthly cashflow
- —
- DSCR
- —
- Eligible?
- —
Short-term bridge; refi at stabilization.
Rent comps 7 comps
| Address | Beds | Baths | Sqft | Rent | $/sqft | DOM | Units | Dist |
|---|---|---|---|---|---|---|---|---|
| 834 Highgarden Cir Noble, OK | 3.0 | 2.0 | 1464 | $1,695 | $1.16 | 4d | 1 | 0.39mi |
| 1117 Magnolia Dr Noble, OK | 3.0 | 2.0 | 1763 | $1,995 | $1.13 | 24d | 1 | 0.63mi |
| 513 Redwood Dr Noble, OK | 4.0 | 1.5 | 1419 | $1,495 | $1.05 | 21d | 1 | 0.68mi |
| 513 Redwood Dr Noble, OK | 4.0 | 2.0 | 1419 | $1,495 | $1.05 | 24d | 1 | 0.68mi |
| 805 E Etowah Rd Noble, OK | 4.0 | 2.0 | 1608 | $1,550 | $0.96 | 2d | 1 | 0.69mi |
| 1200 Granite Ln Noble, OK | 3.0 | 2.0 | 1680 | $1,800 | $1.07 | 16d | 1 | 0.79mi |
| 1416 Sandstone Dr Noble, OK | 3.0 | 2.0 | 1420 | $1,595 | $1.12 | 4d | 1 | 1.16mi |
Listing history 2 events
-
2026-05-17status Pending
-
2026-05-13$190,000 Active
ⓘ Source: listings_history table (triggers on properties + properties_extension) + one-shot
backfill from property_details.listing_events for pre-trigger history.
Tax reassessment forecast OK · Resets to sale price
- Current annual tax
- $1,178 · $98/mo
- Projected year-2 tax
- $1,710 · $142/mo
- Expected delta
- +$532/yr (+$44/mo · 45.2%)
ⓘ Screening estimate from a state-policy table — verify with the county assessor before closing.
Climate risk First Street
- Flood 1/10 Low FEMA zone X (unshaded) · 0% chance over 30 yrs
- Wildfire 4/10 Moderate
- Heat 6/10 Major 7 d/yr ≥109°F today · 18 d/yr by 30 yrs out
- Wind 3/10 Moderate 6% chance of damaging wind over 30 yrs
- Air quality 2/10 Low 1 unhealthy d/yr today · 1 by 30 yrs out
Nearby sold comps map
Loading sold comps map…
Walkable amenities ~0.75 mi
Loading nearby amenities…
Taxation est. · year 1
- Rental income
- $30,744
- − Mortgage interest
- −$10,643
- − Property taxes
- −$1,178
- − Insurance
- −$950
- − Repairs & maintenance
- −$2,460
- − Management
- −$2,460
- − Depreciation
- −$5,527
- Taxable income
- $7,527
- Est. tax owed @ 24.0%
- −$1,806
- After-tax cash flow
- $8,397/yr
For passive investors: Depreciation is non-cash, so a rental often shows a tax loss while cash-flowing — sheltering income. Rental losses are passive: they offset passive income freely, and up to $25,000/yr can offset ordinary (W-2) income if you actively participate and your MAGI is under $100k (phasing out to $0 by $150k); unused losses carry forward. On sale, claimed depreciation is recaptured at up to 25%, and gains may owe capital-gains tax (a 1031 exchange can defer both). Figures are a year-1 estimate at your 24.0% rate — not tax advice; consult a CPA.
Schools (NCES district)
- District
- Noble
- NCES district ID
- 4021630
- Math proficiency
- 23% ▼ -8.00%
- Reading proficiency
- 25% ▼ -7.00%
- Median HH income
- $50,812
- Composite
- 21.31/100
- National rank
- #8384
- State rank
- #108 of 270 in OK
Livability — Noble
- Score
- 66/100
- State rank
- #107
- US rank
- #11489
Category grades
Schools grade is shown separately in the Schools card above.
Census & demographics
- Census place
- Noble, OK
- County
- Cleveland County · 239,547 people
- City population
- 12,258
- Metro
- Oklahoma City, OK
- Population (ZIP)
- 12,258
- Household income
- $73,821
- Rent vs Own
- Severe rent burden
- 301.0
Population outlook (Cleveland County) Hauer SSP2
- Today (2025)
- 323,621 people
- By 2030
- 349,070 · +7.9%
- By 2040
- 400,168 · +23.7%
- By 2050
- 454,101 · +40.3%
- By 2075
- 602,926 · +86.3%
- By 2100
- 734,485 · +127.0%
Race, ethnicity, and origin ACS 2023
- Neighborhood character
- Predominantly White (82%)
- Race & ethnicity
- White 82% Two or more races 8% Hispanic / Latino 5% Native American 5% Black 1%
- Hispanic origin (detail)
- Mexican 4% Puerto Rican 1%
- Common ancestry
- Slovak 3% Lithuanian 2% Italian 2%
- Foreign-born
- 1% · Canada
- Languages at home
- 98% English-only · Spanish 1%
Political lean MEDSL · Cleveland
- 2024 margin
- R (+14.9) · D 41.4% · R 56.4% · Other 2.2%
- 2008→2024 swing
- +9.1pp toward D · 2008: -24.0pp · 2024: -14.9pp
- All cycles
- 2024: R+14.9 2020: R+14.1 2016: R+21.7 2012: R+25.9 2008: R+24.0
Not yet ingested
- Civics
- —
Market trends
- HPI YoY
- ▼ -13.99%
- Current HPI
- 278.428
- Rent YoY
- —
- Metro
- Oklahoma City, OK
- State GDP YoY
- ▲ 1.55%
- F500 in state
- 6
Industry mix (Fortune 500 HQ in OK)
| Industry | F500 HQs | Revenue |
|---|---|---|
| Energy | 3 | $48B |
|
||
Price history
2 events — show timeline
- 2026-05-17 Pending — MLSOK
- 2026-05-13 Listed $190,000 MLSOK
Property tax history
+2.7%/yrLatest (2024): $1,178 · +3.5% YoY. Source: county tax records.
Cash-flow waterfall
monthlySold comps — $/sqft
last 12 mo · ≤1 miLoading sold comps…