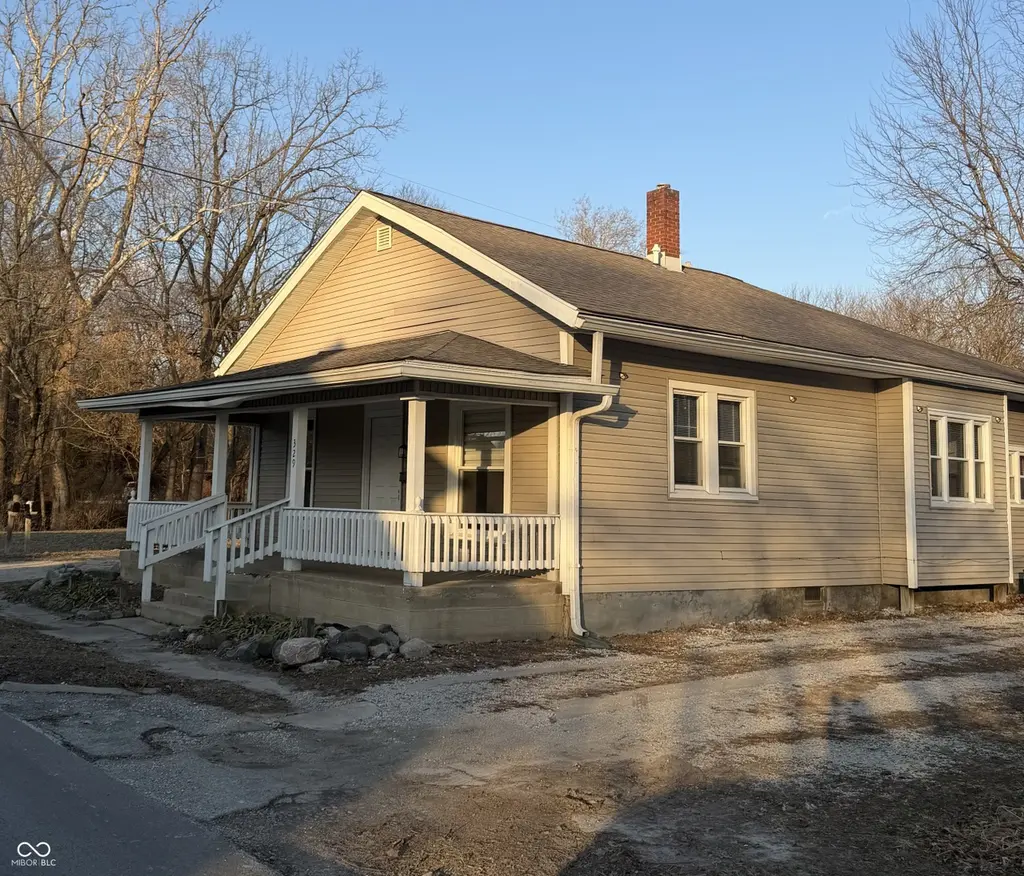
329 Avon Ave · Plainfield, IN
Flood risk 5/10 · Moderate
- FEMA flood zone
- X (unshaded)
- Chance of flooding over 30 yrs
- 0.65%
- Est. flood insurance / yr
- $507 – $1,088
Fire risk 1/10 · Minimal
- Est. fire insurance / yr
- $717 – $1,331
Heat risk 3/10 · Minor
- Hot days now (above 101°F)
- 7 days/yr
- Hot days in 30 yrs
- 19 days/yr
Wind risk 2/10 · Minimal
- Chance of severe wind over 30 yrs
- 1.0%
Air-quality risk 3/10 · Minor
- Unhealthy air days now
- 2 days/yr
- Unhealthy air days in 30 yrs
- 3 days/yr
Risk factors via First Street. Map © Google.
Why this score? — see what drove the C- grade
The composite is a weighted blend of 9 inputs, each scored 0–100. Each bar is that input's sub-score; the figure is the points it added to the 100-point composite (weight × sub-score).
- ARV discount +14.7/15.0
- Cash flow +13.3/30.0
- Schools +5.5/10.0
- DSCR +4.0/10.0
- Livability +3.7/5.0
- 1% rule +3.4/10.0
- Rent growth +3.4/5.0
- Condition / age +2.5/5.0
- Appreciation +0.0/10.0
$179,900
🖨 Deal sheet (PDF) 📄 Offer letter ✓ Due diligence
Listing remarks MLS
This 2 Bedroom is located in the charming old part of town and is surrounded by other homes with character and history. Spacious layout includes great room, formal dining room and separate laundry room. Covered front porch, fenced back yard and 2 mini barns in great shape. Low maintenance vinyl exterior. Convenient to the old town center and local shops. Immediate possession.
Key facts
- Covered front porch
- Formal dining room
- Fenced back yard
Tags
Neighborhood map
What this means for you Summary
Snapshot
- This is a 2-bed/1.0-bath single-family listed at $180k.
Deal economics
- At list price, monthly cash flow is $1 ($13/yr) — positive.
- The deal already cash-flows at list — no discount required.
- To meet the 1% rule (rent ≥ 1% of price), the offer needs to be $151k (16.3% below list).
- Recommended offer: $151k (16.3% below list) — sets the bar for 1% rule.
- Cap rate 6.3% vs local median 3.7% in Plainfield — top-decile yield for the area; either an underpriced asset or a hidden risk that comps aren't pricing in. Stress-test before assuming the spread holds.
Location & tenants
- Location reads 74/100 on livability (#69 in IN, #4,418 nationally) — a middle-class / working-renter tenant base. Strengths: cost of living A+, housing A+, schools A; Watch: health & safety C-, amenities F, commute F.
- Plainfield Community School Corporation (suburban): math 62% / reading 65% proficiency, ranked #11 of 301 in IN (top 4%) — acceptable for families but not a draw, mixed tenant base, ~2y average lease.
- Market conditions: Rents rising (+3.6%/yr); 284 active listings in the ZIP; 11 comparable units currently listed for rent nearby; rentals leasing fast (median 2d on market — plan ~1-2 weeks tenant-placement turnaround); solid renter incomes; 1,294 units permitted in Hendricks County in 2024 (18 in 5+ unit buildings).
Forward outlook
- Local home prices are declining (-3.0%/yr); year-one equity from $1k of loan paydown is wiped out by about $5k of value loss. Plan a longer hold.
- Hendricks County population projected at +35% by 2050 — long-run rental-demand tailwind backs the buy-and-hold thesis.
Negotiation context
- It's been on market 148 days — a 12% lower offer ($158k) is reasonable based on typical stale-listing flexibility.
- 3 sale attempts since 24y ago; this cycle's ask has dropped $15k (8%) from the opening price — seller is motivated, your offer sets the floor, not the list.
Risks & watch-outs
- Watch-outs: built in 1938 — expect roof / HVAC / electrical / plumbing capex.
- Climate carrying-cost: moderate flood risk — expect insurance premiums to compound above CPI over the hold.
Questions for the listing agent
- It's been on market 148 days. Have you received any prior offers? Is the seller open to a 16% concession, seller financing, or rate buy-down credit?
- Built in 1938 — when were the roof, HVAC, electrical panel, plumbing, and water heater last replaced?
- Why hasn't it sold? Are there any deal-killer items the seller is aware of (foundation, flood, title, zoning, code violations)?
- Is there a deadline driving the sale (1031 exchange, divorce, estate, relocation)? That informs how much negotiation room exists.
- Schools are A-rated — typically a magnet for longer-tenancy family renters. What's the average tenant stay here, and is there a school-zone premium baked into asking?
- What's the average days-on-market for RENTAL listings here right now (not sales)? A rising rental-DOM trend means longer vacancies and softer asking-rent achievability than the comps imply.
- What's the recent tenant-quality profile in this submarket — average credit score on applications, eviction rate, late-payment / NSF rate, and stable-employment percentage? A property-management company in the area should have these aggregated.
- How much new for-sale + rental construction is in the pipeline within 1–3 miles? Heavy new supply typically softens prices + rents 12–24 months out; constrained supply supports both.
Investment metrics
- 1% rule
- 0.84% ✗
- Cap rate
- 6.30%
- Cash-on-cash
- 0.03%
- DSCR
- 1.00
- GRM
- 10.0
CMA / ARV
- ARV (median comp)
- $213,922
- List price
- $179,900
- Delta
- -15.90%
- Verdict
- UNDERPRICED
- Comps
- 20 within 1.0 mi
Show comp detail 12 sales within ~0.75 mi
| Address | Dist | Beds/Ba | Sqft | Sold | Price | $/sf | Match |
|---|---|---|---|---|---|---|---|
| 305 N East St | 0.13mi | 2/1.0 | 1,066 (-5%) | 0mo | $225,000 | $211 | 86 |
| 282 N Vine St | 0.20mi | 2/1.0 | 1,144 (+2%) | 13mo | $195,000 | $170 | 76 |
| 454 Pickett St | 0.17mi | 2/1.5 | 1,082 (-3%) | 11mo | $226,000 | $209 | 76 |
| 311 N Center St | 0.24mi | 2/1.5 | 1,077 (-4%) | 7mo | $235,006 | $218 | 75 |
| 60 Pike Pl | 0.49mi | 3/1.0 (+1) | 1,050 (-6%) | 6mo | $215,000 | $205 | 57 |
| 540 Hanley St | 0.51mi | 3/1.0 (+1) | 1,152 (+3%) | 12mo | $245,000 | $213 | 56 |
| 430 N Vine St | 0.27mi | 3/1.0 (+1) | 1,265 (+13%) | 6mo | $213,000 | $168 | 56 |
| 325 N Center St | 0.25mi | 3/1.0 (+1) | 960 (-14%) | 5mo | $225,000 | $234 | 56 |
| 519 Duffey St | 0.42mi | 3/1.0 (+1) | 1,248 (+12%) | 1mo | $225,000 | $180 | 55 |
| 228 Shaw St | 0.35mi | 3/2.0 (+1) | 1,254 (+12%) | 2mo | $256,000 | $204 | 53 |
| 317 Hanley St | 0.47mi | 2/1.0 | 1,248 (+12%) | 17mo | $235,000 | $188 | 45 |
| 626 Roosevelt St | 0.63mi | 3/2.0 (+1) | 1,149 (+3%) | 16mo | $230,000 | $200 | 44 |
Match score weights: distance 35% · size 25% · config 20% · recency 20%. Top-matched comps best support the ARV.
Projected returns pro-forma
-3.0% appreciation · 3.65% rent growth · sell at horizon
- IRR
- -15.6%
- Equity multiple
- 0.44×
- Total profit
- $-28,101
- Equity at exit
- $26,824
- IRR
- -6.1%
- Equity multiple
- 0.60×
- Total profit
- $-20,302
- Equity at exit
- $15,554
Cash invested: $50,372 (down + closing). Projections, not guarantees.
Landlord ↔ Tenant lean methodology
- Overall (STATE)
- 90 Strongly Landlord-Friendly
- State Indiana
- 90 Strongly Landlord-Friendly · R+11
- County
- — inherits STATE
- City
- — inherits STATE
ZIP-level market 46168
- Rents YoY
- 3.6%
- Active inventory
- 284
- Price-to-rent
- 10.0×
Monthly cashflow live
- Estimated rent
- $1,506 high interval (Pro) →
- Mortgage (P&I)
- −$943
- Tax from tax record
- −$170 /mo · $2,044/yr
- Insurance
- −$75
- HOA
- −$0
- Vacancy / Maint / Mgmt
- −$316
- Net cashflow
- $1
Break-even live
Sensitivity live
| Price | -10% $103 | -5% $52 | +0% $1 | +5% $-50 | +10% $-101 |
|---|---|---|---|---|---|
| Rent | -10% $-118 | -5% $-58 | +0% $1 | +5% $61 | +10% $120 |
| Rate | -1.0pp $92 | -0.5pp $47 | base $1 | +0.5pp $-46 | +1.0pp $-93 |
UW: 25.0% down · 7.5% · 30yr · 1.5% tax · 5.0% vac · 8.0% maint · 8.0% mgmt
Financing live
Cash to close
- Down payment
- $44,975
- Closing costs
- $5,397
- Reserves months
- —
- Total cash needed
- —
Loan-product check · same deal, 3 products live
Conventional
25% down · 7.5% · 30yr
- Down + closing
- —
- Monthly P&I
- —
- Monthly cashflow
- —
- DSCR
- —
- Eligible?
- —
Personal DTI + credit; lowest rate.
DSCR
20% down · 8.5% · 30yr
- Down + closing
- —
- Monthly P&I
- —
- Monthly cashflow
- —
- DSCR
- —
- Eligible?
- —
No personal income docs; deal must DSCR.
Hard money
10% down · 12.0% · 12mo
- Down + closing
- —
- Monthly P&I
- —
- Monthly cashflow
- —
- DSCR
- —
- Eligible?
- —
Short-term bridge; refi at stabilization.
Rent comps 11 comps
| Address | Beds | Baths | Sqft | Rent | $/sqft | DOM | Units | Dist |
|---|---|---|---|---|---|---|---|---|
| 250 N East St Plainfield, IN | 2.0 | 1.0 | 850 | $1,210 | $1.42 | 2d | 3 | 0.11mi |
| 282 N East St Plainfield, IN | 3.0 | 2.5 | 1480 | $1,950 | $1.32 | 24d | 1 | 0.16mi |
| 234 E Main St Plainfield, IN | 1.0 | 1.0 | 763 | $1,381 | $1.81 | 2d | 1 | 0.20mi |
| 451 N Vine St Plainfield, IN | 2.0–3.0 | 1.0–2.0 | 996 | $1,250 | $1.26 | 2d | 5 | 0.26mi |
| 416 N Center St Plainfield, IN | 2.0 | 1.0 | 814 | $1,215 | $1.49 | 2d | 3 | 0.32mi |
| 429 Brookside Ln Plainfield, IN | 3.0 | 1.5 | 1236 | $1,731 | $1.40 | 13d | 1 | 0.94mi |
| 890 Ridgewood Dr Plainfield, IN | 2.0 | 1.0 | 900 | $1,292 | $1.44 | 2d | 1 | 0.98mi |
| 4518 Redcliff South Ln Plainfield, IN | 3.0 | 2.5 | 1423 | $1,769 | $1.24 | 2d | 1 | 1.11mi |
| 4525 Connaught East Dr Plainfield, IN | 3.0 | 2.5 | 1470 | $1,919 | $1.31 | 2d | 1 | 1.14mi |
| 4487 Connaught East Dr Plainfield, IN | 3.0 | 2.5 | 1352 | $1,905 | $1.41 | 2d | 1 | 1.14mi |
| 644 Lakeside Dr Plainfield, IN | 2.0 | 1.0 | 850 | $1,345 | $1.58 | 2d | 1 | 1.50mi |
Listing history 19 events
-
2026-06-18days on market $179,900 Active 148 DOM
-
2026-06-17days on market $179,900 Active 147 DOM
-
2026-06-16days on market $179,900 Active 146 DOM
-
2026-06-15days on market $179,900 Active 145 DOM
-
2026-06-13days on market $179,900 Active 143 DOM
-
2026-06-13pricedays on market $179,900 Active 142 DOM
-
2026-06-09days on market $181,900 Active 139 DOM
-
2026-06-08days on market $181,900 Active 138 DOM
-
2026-06-07pricedays on market $181,900 Active 137 DOM
-
2026-06-03days on market $189,900 Active 133 DOM
-
2026-06-02days on market $189,900 Active 132 DOM
-
2026-06-01days on market $189,900 Active 131 DOM
-
2026-05-31days on market $189,900 Active 130 DOM
-
2026-04-28price $189,900 381-char remark
Show marketing remark (381 chars)
This 2 Bedroom is located in the charming old part of town and is surrounded by other homes with character and history. Spacious layout includes great room, formal dining room and separate laundry room. Covered front porch, fenced back yard and 2 mini barns in great shape. Low maintenance vinyl exterior. Convenient to the old town center and local shops. Immediate possession.
-
2026-01-20$194,900 Active 381-char remark
Show marketing remark (381 chars)
This 2 Bedroom is located in the charming old part of town and is surrounded by other homes with character and history. Spacious layout includes great room, formal dining room and separate laundry room. Covered front porch, fenced back yard and 2 mini barns in great shape. Low maintenance vinyl exterior. Convenient to the old town center and local shops. Immediate possession.
-
2003-06-30historical
-
2002-11-22$81,000
-
2002-10-02historical
-
2002-04-03$81,400
ⓘ Source: listings_history table (triggers on properties + properties_extension) + one-shot
backfill from property_details.listing_events for pre-trigger history.
Tax reassessment forecast IN · Partial reset (capped growth)
- Current annual tax
- $2,044 · $170/mo
- Projected year-2 tax
- $2,044 · $170/mo
- Expected delta
- $0/yr ($0/mo · 0.0%)
ⓘ Screening estimate from a state-policy table — verify with the county assessor before closing.
Climate risk First Street
- Flood 5/10 Major FEMA zone X (unshaded) · 65% chance over 30 yrs
- Wildfire 1/10 Low
- Heat 3/10 Moderate 7 d/yr ≥101°F today · 19 d/yr by 30 yrs out
- Wind 2/10 Low 100% chance of damaging wind over 30 yrs
- Air quality 3/10 Moderate 2 unhealthy d/yr today · 3 by 30 yrs out
Nearby sold comps map
Loading sold comps map…
Walkable amenities ~0.75 mi
Loading nearby amenities…
Taxation est. · year 1
- Rental income
- $18,073
- − Mortgage interest
- −$10,077
- − Property taxes
- −$2,044
- − Insurance
- −$900
- − Repairs & maintenance
- −$1,446
- − Management
- −$1,446
- − Depreciation
- −$5,233
- Taxable loss
- −$3,073
- Est. tax savings @ 24.0%
- +$737
- After-tax cash flow
- $751/yr
For passive investors: Depreciation is non-cash, so a rental often shows a tax loss while cash-flowing — sheltering income. Rental losses are passive: they offset passive income freely, and up to $25,000/yr can offset ordinary (W-2) income if you actively participate and your MAGI is under $100k (phasing out to $0 by $150k); unused losses carry forward. On sale, claimed depreciation is recaptured at up to 25%, and gains may owe capital-gains tax (a 1031 exchange can defer both). Figures are a year-1 estimate at your 24.0% rate — not tax advice; consult a CPA.
Schools (NCES district)
- District
- Plainfield Community School Corporation
- NCES district ID
- 1808970
- Math proficiency
- 62% ▼ -8.00%
- Reading proficiency
- 65% ▼ -8.00%
- Median HH income
- $58,531
- Composite
- 54.79/100
- National rank
- #1315
- State rank
- #11 of 301 in IN
Livability — Plainfield
- Score
- 74/100
- State rank
- #69
- US rank
- #4418
Category grades
Schools grade is shown separately in the Schools card above.
Census & demographics
- Census place
- Plainfield, IN
- County
- Hendricks County · 143,373 people
- City population
- 38,826
- Metro
- Indianapolis-Carmel-Anderson, IN
- Population (ZIP)
- 38,826
- Household income
- $90,000
- Rent vs Own
- Severe rent burden
- 1029.0
Population outlook (Hendricks County) Hauer SSP2
- Today (2025)
- 187,418 people
- By 2030
- 201,494 · +7.5%
- By 2040
- 228,487 · +21.9%
- By 2050
- 253,068 · +35.0%
- By 2075
- 308,920 · +64.8%
- By 2100
- 336,510 · +79.6%
Race, ethnicity, and origin ACS 2023
- Neighborhood character
- Predominantly White (76%)
- Race & ethnicity
- White 76% Black 9% Two or more races 8% Hispanic / Latino 6% Asian 4%
- Hispanic origin (detail)
- Mexican 3%
- Common ancestry
- Italian 2% Lithuanian 1% Romanian 1%
- Foreign-born
- 7% · Canada, China
- Languages at home
- 90% English-only · Spanish 4% Other Indo-European 3% French/Haitian/Cajun 1%
Political lean MEDSL · Hendricks
- 2024 margin
- Strong R (+21.5) · D 38.4% · R 59.9% · Other 1.7%
- 2008→2024 swing
- +1.9pp toward D · 2008: -23.4pp · 2024: -21.5pp
- All cycles
- 2024: R+21.5 2020: R+23.9 2016: R+34.2 2012: R+34.9 2008: R+23.4
Not yet ingested
- Civics
- —
Market trends
- HPI YoY
- ▼ -136.23%
- Current HPI
- 205.5963
- Rent YoY
- ▲ 3.65%
- Metro
- Indianapolis-Carmel-Anderson, IN
- State GDP YoY
- ▲ 2.90%
- F500 in state
- 18
Industry mix (Fortune 500 HQ in IN)
| Industry | F500 HQs | Revenue |
|---|---|---|
| Industrial Machinery | 2 | $37B |
|
||
| Healthcare | 1 | $177B |
|
||
| Pharmaceuticals | 1 | $45B |
|
||
| Metals / Steel | 1 | $18B |
|
||
| Agriculture | 1 | $17B |
|
||
| Packaging | 1 | $12B |
|
||
Price history
+133.3% since first listed6 events — show timeline
- 2026-04-28 Price Changed $189,900 MIBOR as Distributed by MLS Grid
- 2026-01-20 Listed $194,900 MIBOR as Distributed by MLS Grid
- 2003-06-30 Listing Removed — MIBOR as Distributed by MLS Grid
- 2002-11-22 Listed $81,000 MIBOR as Distributed by MLS Grid
- 2002-10-02 Listing Removed — MIBOR as Distributed by MLS Grid
- 2002-04-03 Listed $81,400 MIBOR as Distributed by MLS Grid
Property tax history
+3.7%/yrLatest (2025): $2,044 · +2.1% YoY. Source: county tax records.
Cash-flow waterfall
monthlySold comps — $/sqft
last 12 mo · ≤1 miLoading sold comps…