None · Reedurban, OH
Flood risk 1/10 · Minimal
- FEMA flood zone
- X (unshaded)
- Chance of flooding over 30 yrs
- 0.0%
- Est. flood insurance / yr
- $507 – $1,088
Fire risk 1/10 · Minimal
- Est. fire insurance / yr
- $713 – $1,323
Heat risk 3/10 · Minor
- Hot days now (above 96°F)
- 7 days/yr
- Hot days in 30 yrs
- 17 days/yr
Wind risk 1/10 · Minimal
- Chance of severe wind over 30 yrs
- —
Air-quality risk 2/10 · Minimal
- Unhealthy air days now
- 0 days/yr
- Unhealthy air days in 30 yrs
- 1 days/yr
Risk factors via First Street. Map © Google.
Why this score? — see what drove the B+ grade
The composite is a weighted blend of 9 inputs, each scored 0–100. Each bar is that input's sub-score; the figure is the points it added to the 100-point composite (weight × sub-score).
- Cash flow +30.0/30.0
- ARV discount +15.0/15.0
- DSCR +10.0/10.0
- 1% rule +9.6/10.0
- Schools +5.8/10.0
- Rent growth +4.2/5.0
- Livability +2.5/5.0
- Condition / age +2.5/5.0
- Appreciation +0.0/10.0
$87,900
🖨 Deal sheet (PDF) 📄 Offer letter ✓ Due diligence
Key facts
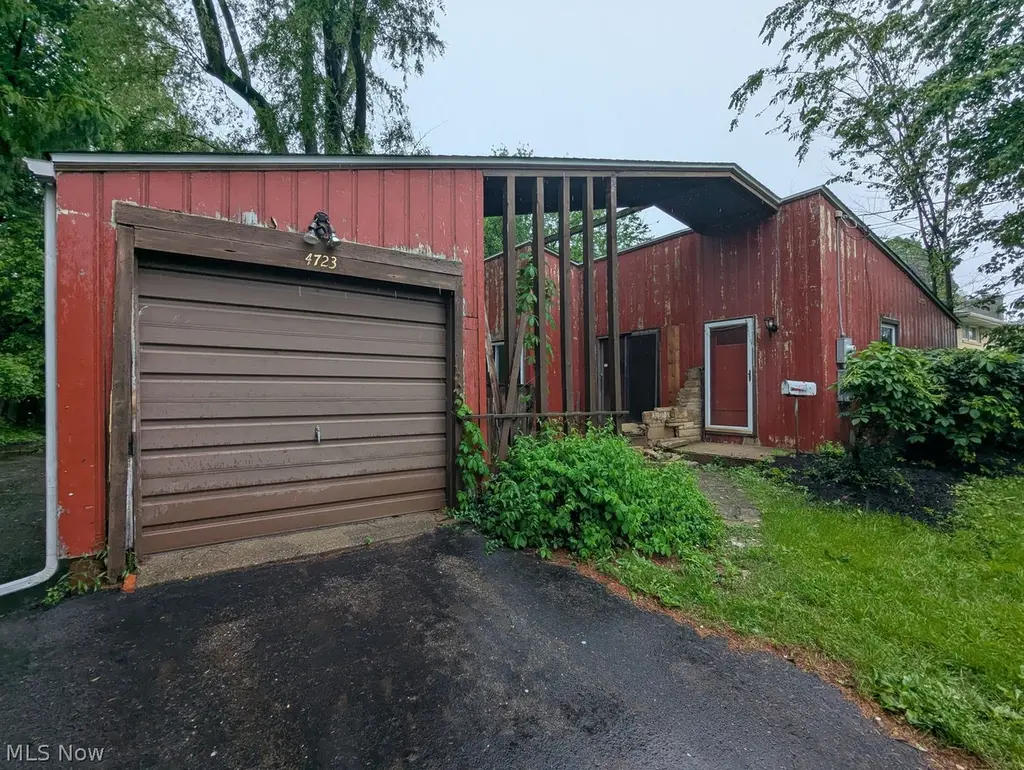
- 0.4 acre lot
- Garage
- Built 1950
Tags
Neighborhood map
What this means for you Summary
Snapshot
- This is a 2-bed/1.0-bath single-family listed at $88k.
Deal economics
- At list price, monthly cash flow is $340 ($4k/yr) — positive.
- The deal already cash-flows at list — no discount required.
- Meets the 1% rule at list price ($1k rent vs $88k).
- Recommended offer: $87k (1.5% below list) — sets the bar for market timing.
Location & tenants
- Location reads: area grade B — affects rentability + tenant quality, not the cash-flow math above.
- Perry Local (suburban): math 63% / reading 73% proficiency, ranked #173 of 656 in OH (top 26%) — acceptable for families but not a draw, mixed tenant base, ~2y average lease.
- Zoned schools: T C Knapp Elementary School (math 82% / reading 72%, grade A, #221 of 1,584 statewide, top 16%, 416 students, 24% FRL); Edison Middle School (math 61% / reading 75%, grade A-, #155 of 654 statewide, top 24%, 689 students, 37% FRL); Perry High School (math 36% / reading 72%, grade C-, #331 of 781 statewide, top 43%, 1,478 students, 30% FRL) — zoned schools at 30% FRL track the district average.
- Market conditions: Rents rising fast (+6.7%/yr); 124 active listings in the ZIP; 2 comparable units currently listed for rent nearby; 528 units permitted in Stark County in 2024 (84 in 5+ unit buildings).
Forward outlook
- Local home prices are declining (-3.0%/yr); year-one equity from $608 of loan paydown is wiped out by about $3k of value loss. Plan a longer hold.
- Stark County population projected to shrink 8% by 2050 — rents likely to lag national; underwrite the cash flow, not the appreciation.
- At projected returns (-3.0% appreciation + 6.7% rent growth), your $25k cash investment doubles in ~6 years — after that, you're playing with house money.
Negotiation context
- It's been on market 15 days — a 2% lower offer ($87k) is reasonable based on typical stale-listing flexibility.
- 5 sale attempts since 32y ago with the ask held roughly flat each time — persistent listings suggest the price (not the market) is what's stuck; bring a comps-based counter.
Risks & watch-outs
- Watch-outs: built in 1950 — expect roof / HVAC / electrical / plumbing capex.
Questions for the listing agent
- Built in 1950 — when were the roof, HVAC, electrical panel, plumbing, and water heater last replaced?
- Is there a deadline driving the sale (1031 exchange, divorce, estate, relocation)? That informs how much negotiation room exists.
- What's the average days-on-market for RENTAL listings here right now (not sales)? A rising rental-DOM trend means longer vacancies and softer asking-rent achievability than the comps imply.
- What's the recent tenant-quality profile in this submarket — average credit score on applications, eviction rate, late-payment / NSF rate, and stable-employment percentage? A property-management company in the area should have these aggregated.
- How much new for-sale + rental construction is in the pipeline within 1–3 miles? Heavy new supply typically softens prices + rents 12–24 months out; constrained supply supports both.
Investment metrics
- 1% rule
- 1.46% ✓
- Cap rate
- 10.93%
- Cash-on-cash
- 16.56%
- DSCR
- 1.74
- GRM
- 5.7
CMA / ARV
- ARV (on-the-fly)
- $165,308
- Comps found
- 5
Show comp detail 5 sales within ~0.75 mi
| Address | Dist | Beds/Ba | Sqft | Sold | Price | $/sf | Match |
|---|---|---|---|---|---|---|---|
| 1101 Terrace Ave NW | 0.63mi | 2/1.0 | 1,044 (-10%) | 1mo | $134,900 | $129 | 54 |
| 814 Lakeview Ave NW | 0.62mi | 3/1.0 (+1) | 1,296 (+12%) | 0mo | $190,000 | $147 | 46 |
| 424 Whipple Ave NW | 0.71mi | 3/1.0 (+1) | 1,254 (+8%) | 12mo | $200,000 | $159 | 38 |
| 725 Terrace Ave NW | 0.72mi | 3/1.0 (+1) | 1,248 (+8%) | 14mo | $179,000 | $143 | 37 |
| 4026 9th St NW | 0.72mi | 3/2.0 (+1) | 1,200 (+4%) | 24mo | $157,000 | $131 | 32 |
Match score weights: distance 35% · size 25% · config 20% · recency 20%. Top-matched comps best support the ARV.
Projected returns pro-forma
-3.0% appreciation · 6.73% rent growth · sell at horizon
- IRR
- 12.1%
- Equity multiple
- 1.51×
- Total profit
- $12,452
- Equity at exit
- $13,106
- IRR
- 24.1%
- Equity multiple
- 3.48×
- Total profit
- $61,134
- Equity at exit
- $7,600
Cash invested: $24,612 (down + closing). Projections, not guarantees.
Landlord ↔ Tenant lean methodology
- Overall (STATE)
- 73 Landlord-Friendly
- State Ohio
- 73 Landlord-Friendly · R+6
- County
- — inherits STATE
- City
- — inherits STATE
ZIP-level market 44708
- Rents YoY
- 6.7%
- Active inventory
- 124
- Price-to-rent
- 5.7×
Monthly cashflow live
- Estimated rent
- $1,286 medium interval (Pro) →
- Mortgage (P&I)
- −$461
- Tax from tax record
- −$179 /mo · $2,148/yr
- Insurance
- −$37
- HOA
- −$0
- Vacancy / Maint / Mgmt
- −$270
- Net cashflow
- $340
Break-even live
Sensitivity live
| Price | -10% $389 | -5% $364 | +0% $340 | +5% $315 | +10% $290 |
|---|---|---|---|---|---|
| Rent | -10% $238 | -5% $289 | +0% $340 | +5% $390 | +10% $441 |
| Rate | -1.0pp $384 | -0.5pp $362 | base $340 | +0.5pp $317 | +1.0pp $294 |
UW: 25.0% down · 7.5% · 30yr · 1.5% tax · 5.0% vac · 8.0% maint · 8.0% mgmt
Financing live
Cash to close
- Down payment
- $21,975
- Closing costs
- $2,637
- Reserves months
- —
- Total cash needed
- —
Loan-product check · same deal, 3 products live
Conventional
25% down · 7.5% · 30yr
- Down + closing
- —
- Monthly P&I
- —
- Monthly cashflow
- —
- DSCR
- —
- Eligible?
- —
Personal DTI + credit; lowest rate.
DSCR
20% down · 8.5% · 30yr
- Down + closing
- —
- Monthly P&I
- —
- Monthly cashflow
- —
- DSCR
- —
- Eligible?
- —
No personal income docs; deal must DSCR.
Hard money
10% down · 12.0% · 12mo
- Down + closing
- —
- Monthly P&I
- —
- Monthly cashflow
- —
- DSCR
- —
- Eligible?
- —
Short-term bridge; refi at stabilization.
Rent comps 2 comps
| Address | Beds | Baths | Sqft | Rent | $/sqft | DOM | Units | Dist |
|---|---|---|---|---|---|---|---|---|
| 1819 Miles Ave NW Canton, OH | 1.0–2.0 | 1.0–1.5 | 900 | $1,349 | $1.50 | 15d | 1 | 0.44mi |
| 2740 Shaftesbury Dr NW Canton, OH | 1.0–2.0 | 1.0–2.0 | 1064 | $1,460 | $1.37 | 15d | 11 | 1.10mi |
Listing history 11 events
-
2026-06-21days on market $87,900 Active 15 DOM
-
2026-06-21days on market $87,900 Active 14 DOM
-
2026-06-18days on market $87,900 Active 12 DOM
-
2026-06-17days on market $87,900 Active 11 DOM
-
2026-06-16days on market $87,900 Active 10 DOM
-
2026-06-15days on market $87,900 Active 9 DOM
-
2026-06-13days on market $87,900 Active 7 DOM
-
2026-06-12days on market $87,900 Active 6 DOM
-
2026-06-09days on market $87,900 Active 3 DOM
-
2026-06-08days on market $87,900 Active 2 DOM
-
2026-06-08$87,900 Active 1 DOM
ⓘ Source: listings_history table (triggers on properties + properties_extension) + one-shot
backfill from property_details.listing_events for pre-trigger history.
Tax reassessment forecast OH · Partial reset (capped growth)
- Current annual tax
- $2,148 · $179/mo
- Projected year-2 tax
- $2,148 · $179/mo
- Expected delta
- $0/yr ($0/mo · 0.0%)
ⓘ Screening estimate from a state-policy table — verify with the county assessor before closing.
Climate risk First Street
- Flood 1/10 Low FEMA zone X (unshaded) · 0% chance over 30 yrs
- Wildfire 1/10 Low
- Heat 3/10 Moderate 7 d/yr ≥96°F today · 17 d/yr by 30 yrs out
- Wind 1/10 Low
- Air quality 2/10 Low 0 unhealthy d/yr today · 1 by 30 yrs out
Nearby sold comps map
Loading sold comps map…
Walkable amenities ~0.75 mi
Loading nearby amenities…
Taxation est. · year 1
- Rental income
- $15,435
- − Mortgage interest
- −$4,924
- − Property taxes
- −$2,148
- − Insurance
- −$440
- − Repairs & maintenance
- −$1,235
- − Management
- −$1,235
- − Depreciation
- −$2,557
- Taxable income
- $2,897
- Est. tax owed @ 24.0%
- −$695
- After-tax cash flow
- $3,379/yr
For passive investors: Depreciation is non-cash, so a rental often shows a tax loss while cash-flowing — sheltering income. Rental losses are passive: they offset passive income freely, and up to $25,000/yr can offset ordinary (W-2) income if you actively participate and your MAGI is under $100k (phasing out to $0 by $150k); unused losses carry forward. On sale, claimed depreciation is recaptured at up to 25%, and gains may owe capital-gains tax (a 1031 exchange can defer both). Figures are a year-1 estimate at your 24.0% rate — not tax advice; consult a CPA.
Schools (NCES district)
- District
- Perry Local
- NCES district ID
- 3904992
- Math proficiency
- 63% ▼ -10.00%
- Reading proficiency
- 73% ▼ -4.00%
- Median HH income
- $51,700
- Composite
- 57.83/100
- National rank
- #1048
- State rank
- #173 of 656 in OH
Livability — Reedurban
No livability data for this city. (Only ~50 U.S. cities are tracked.)
Census & demographics
- County
- Stark County · 272,865 people
- Metro
- Canton-Massillon, OH
- Population (ZIP)
- 24,285
- Household income
- $63,706
- Rent vs Own
- Severe rent burden
- 725.0
Population outlook (Stark County) Hauer SSP2
- Today (2025)
- 373,708 people
- By 2030
- 371,245 · -0.7%
- By 2040
- 361,331 · -3.3%
- By 2050
- 345,290 · -7.6%
- By 2075
- 302,669 · -19.0%
- By 2100
- 238,870 · -36.1%
Race, ethnicity, and origin ACS 2023
- Neighborhood character
- Predominantly White (80%)
- Race & ethnicity
- White 80% Black 8% Two or more races 8% Hispanic / Latino 4% Asian 3%
- Common ancestry
- Italian 8% Romanian 2% Slovak 2%
- Foreign-born
- 4% · Canada, South Korea, Vietnam
- Languages at home
- 95% English-only · Spanish 2% Other Indo-European 1% Tagalog/Filipino 1%
Political lean MEDSL · Stark
- 2024 margin
- Strong R (+21.9) · D 38.6% · R 60.5%
- 2008→2024 swing
- -27.4pp toward R · 2008: 5.5pp · 2024: -21.9pp
- All cycles
- 2024: R+21.9 2020: R+18.5 2016: R+17.4 2012: R+0.4 2008: D+5.5
Not yet ingested
- Civics
- —
Market trends
- HPI YoY
- ▼ -168.35%
- Current HPI
- 206.298
- Rent YoY
- ▲ 6.73%
- Metro
- Canton-Massillon, OH
- State GDP YoY
- ▲ 1.98%
- F500 in state
- 48
Industry mix (Fortune 500 HQ in OH)
| Industry | F500 HQs | Revenue |
|---|---|---|
| Insurance | 3 | $145B |
|
||
| Industrial Machinery | 3 | $49B |
|
||
| Financial Services | 3 | $24B |
|
||
| Consumer Goods | 2 | $93B |
|
||
| Aerospace / Defense | 2 | $47B |
|
||
| Utilities | 2 | $33B |
|
||
Price history
+60.1% since first listed20 events — show timeline
- 2026-06-06 Listed $87,900 MLSNOW
- 2020-11-04 Price Changed $75,000 MLSNOW
- 2020-11-04 Price Changed $75,000 MLSNOW
- 2020-11-04 Price Changed $75,000 MLSNOW
- 2020-11-04 Price Changed $75,000 MLSNOW
- 2020-05-02 Price Changed $75,000 MLSNOW
- 2014-02-12 Price Changed $75,000 MLSNOW
- 2002-01-31 Listing Removed — MLSNOW
- 2001-09-09 Listed $109,900 MLSNOW
- 2001-01-19 Sold (Public Records) $76,500 Public Records
- 2000-12-10 Listing Removed — MLSNOW
- 2000-10-19 Listed $79,500 MLSNOW
- 2000-08-10 Listed $74,000 MLSNOW
- 1999-06-04 Price Changed $109,900 MLSNOW
- 1999-06-04 Price Changed $109,900 MLSNOW
- 1999-06-04 Price Changed $109,900 MLSNOW
- 1999-06-04 Price Changed $109,900 MLSNOW
- 1999-06-04 Price Changed $109,900 MLSNOW
- 1994-08-22 Sold (Public Records) $55,000 Public Records
- 1994-06-07 Listed $54,900 MLSNOW
Property tax history
+4.8%/yrLatest (2024): $2,148 · +10.2% YoY. Source: county tax records.
Cash-flow waterfall
monthlySold comps — $/sqft
last 12 mo · ≤1 miLoading sold comps…