 Triplex
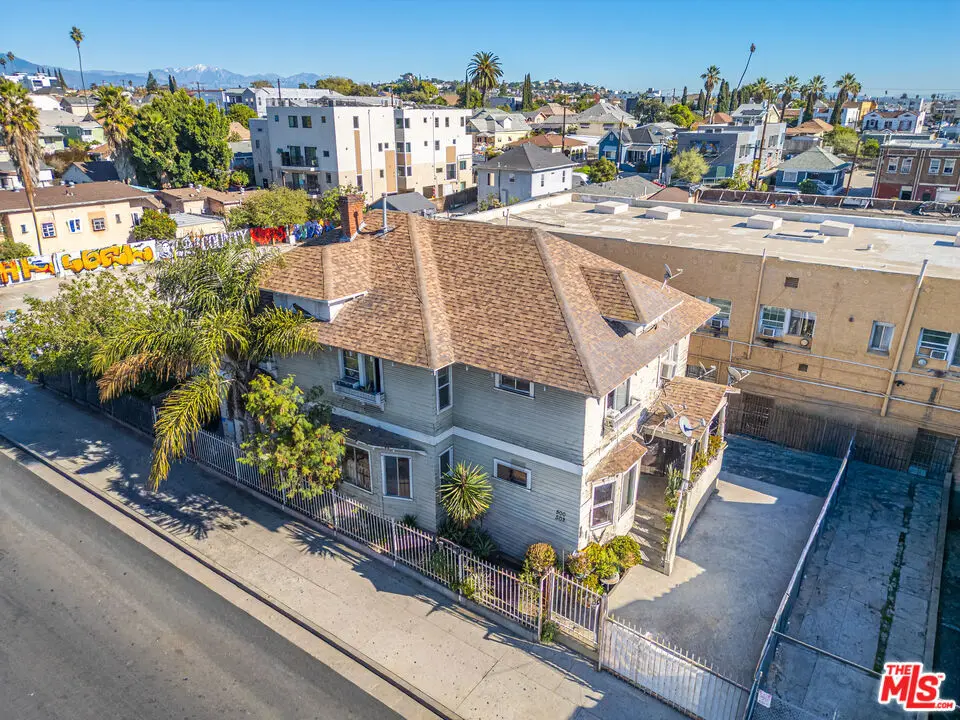
500 N St Louis St · Los Angeles, CA
Flood risk 1/10 · Minimal
- FEMA flood zone
- X (unshaded)
- Chance of flooding over 30 yrs
- 0.0%
- Est. flood insurance / yr
- $507 – $1,088
Fire risk 1/10 · Minimal
- Est. fire insurance / yr
- $659 – $1,223
Heat risk 6/10 · Moderate
- Hot days now (above 94°F)
- 7 days/yr
- Hot days in 30 yrs
- 21 days/yr
Wind risk 1/10 · Minimal
- Chance of severe wind over 30 yrs
- —
Air-quality risk 5/10 · Moderate
- Unhealthy air days now
- 9 days/yr
- Unhealthy air days in 30 yrs
- 9 days/yr
Risk factors via First Street. Map © Google.
Why this score? — see what drove the C+ grade
The composite is a weighted blend of 9 inputs, each scored 0–100. Each bar is that input's sub-score; the figure is the points it added to the 100-point composite (weight × sub-score).
- Cash flow +21.6/30.0
- ARV discount +15.0/15.0
- DSCR +6.9/10.0
- 1% rule +5.6/10.0
- Schools +3.6/10.0
- Livability +3.4/5.0
- Condition / age +2.5/5.0
- Rent growth +1.9/5.0
- Appreciation +0.0/10.0
$699,000
🖨 Deal sheet 📄 Offer letter ✓ Due diligence
Multi-family units
County records classify this as Multi-Family (2-4 Unit). Listing-text estimate: 3 units. confirmed
Listing remarks MLS
Historic Triplex in the Heart of Boyle Heights Delivered FULLY VACANT -- Value-Add Investment Opportunity! Located one building from Cesar Chavez Blvd near the corner of N St Louis Street, this character-rich triplex offers a rare opportunity for investors seeking strong upside potential in a vibrant and culturally significant neighborhood of Los Angeles. Designated as a historic property, the building holds unique architectural charm and longstanding community presence, making it a standout in the area. All three units will be delivered vacant, providing immediate potential for renovation and market rental income. Large 5 bedroom / 2 bath unit covers the entire upstairs. Two downstairs units are the 2 bedroom / 1 bath and a renovated 1 bedroom / 1 bath unit. The building is a heavy fixer and will require upgrades, but with the right vision, it can be repositioned as a high-performing asset in one of LA's most in-demand rental markets. Zoned LAC2, the property sits just off Boyle Heights' commercial corridor, surrounded by beloved local spots like La Monarca Bakery, Guisados, and La Parrilla. Tenants will appreciate accessibility with easy access to transit, and proximity to the 5, 10, and 101 freeways as well as downtown Los Angeles. Ideal for investors looking to restore and hold, this triplex blends historic appeal with excellent long-term rental potential. Unlock the value through thoughtful upgrades and bring this property up to market standards in a thriving, high-demand neighborhood.
Key facts
- Zoned lac2
- Historic property
- Architectural charm
Tags
Neighborhood map
What this means for you Summary
Snapshot
- This is a 3 × 3-bed/1.3-bath units multifamily listed at $699k.
Deal economics
- At list price, monthly cash flow is $1k ($13k/yr) — positive. Per door: $356/mo.
- The deal already cash-flows at list — no discount required.
- Meets the 1% rule at list price ($7k rent vs $699k).
- Recommended offer: $657k (6.0% below list) — sets the bar for market timing.
- Cap rate 8.1% vs local median 2.1% in Los Angeles — top-decile yield for the area; either an underpriced asset or a hidden risk that comps aren't pricing in. Stress-test before assuming the spread holds.
Location & tenants
- Location reads 68/100 on livability (#273 in CA) — a middle-class / working-renter tenant base. Strengths: amenities A+, commute A+, employment B; Watch: health & safety C-, schools D+, crime F.
- Los Angeles Unified (urban): math 29% / reading 54% proficiency, ranked #223 of 517 in CA (top 43%) — families likely to look elsewhere, expect single-tenant / working-renter base with shorter leases; 67% free/reduced lunch — lower-income household profile, screen leases tightly.
- Market conditions: Rents soft (-2.3%/yr); 107 active listings in the ZIP; 5 comparable units currently listed for rent nearby; rentals at typical pace (median 19d on market — plan ~3-4 weeks tenant-placement turnaround); 19,697 units permitted in Los Angeles County in 2024 (9,426 in 5+ unit buildings).
- At $7,384/mo this rent would consume 149% of the median local household income ($60k/yr) (locally 3159% of renters already pay >50% of income on rent) — very limited rent-growth headroom before tenants either downsize or default.
Forward outlook
- Local home prices are declining (-3.0%/yr); year-one equity from $5k of loan paydown is wiped out by about $21k of value loss. Plan a longer hold.
- Los Angeles County population projected at +9% by 2050 — modest demand growth; plan on rents tracking national, not racing it.
Negotiation context
- It's been on market 87 days — a 6% lower offer ($657k) is reasonable based on typical stale-listing flexibility.
- 17 sale attempts since 26y ago; this cycle's ask has dropped $96k (12%) from the opening price — seller is motivated, your offer sets the floor, not the list.
Risks & watch-outs
- Watch-outs: built in 1902 — expect roof / HVAC / electrical / plumbing capex.
- Climate carrying-cost: extreme-heat days projected 7→21/yr by 2055 (HVAC capex compounding) — expect insurance premiums to compound above CPI over the hold.
Questions for the listing agent
- It's been on market 87 days. Have you received any prior offers? Is the seller open to a 6% concession, seller financing, or rate buy-down credit?
- Can we see the unit-by-unit rent roll, current vacancy, and any below-market leases? What's the average tenancy length?
- What capital expenditures (roof, boiler, parking lot, exteriors) have been made in the last 5 years, and what's planned in the next 2?
- Built in 1902 — when were the roof, HVAC, electrical panel, plumbing, and water heater last replaced?
- Why hasn't it sold? Are there any deal-killer items the seller is aware of (foundation, flood, title, zoning, code violations)?
- Is there a deadline driving the sale (1031 exchange, divorce, estate, relocation)? That informs how much negotiation room exists.
- Schools are D-rated, which usually means shorter tenancies and higher turnover. Who's the typical renter profile here, and what's been the actual vacancy rate?
- Crime grade is F in this area — have there been break-ins, vandalism, or insurance claims at this property in the last 3 years? What carrier currently insures it and at what premium?
- What's the average days-on-market for RENTAL listings here right now (not sales)? A rising rental-DOM trend means longer vacancies and softer asking-rent achievability than the comps imply.
- What's the recent tenant-quality profile in this submarket — average credit score on applications, eviction rate, late-payment / NSF rate, and stable-employment percentage? A property-management company in the area should have these aggregated.
- How much new apartment / multifamily construction is in the pipeline within 1–3 miles? Heavy new supply (>2% of stock underway) typically softens rents 12–24 months out; light construction supports rent growth.
Investment metrics
- 1% rule
- 1.06% ✓
- Cap rate
- 8.12%
- Cash-on-cash
- 6.54%
- DSCR
- 1.29
- GRM
- 7.9
CMA / ARV
- ARV (median comp)
- $919,348
- List price
- $699,000
- Delta
- -23.97%
- Verdict
- UNDERPRICED
- Comps
- 20 within 1.0 mi
Show comp detail 8 sales within ~0.75 mi
| Address | Dist | Beds/Ba | Sqft | Sold | Price | $/sf | Match |
|---|---|---|---|---|---|---|---|
| 322 Cornwell St | 0.12mi | 7/5.0 (+1) | 2,728 (-1%) | 10mo | $940,000 | $345 | 72 |
| 1613 E 1st | 0.64mi | 6/2.0 | 2,800 (+2%) | 1mo | $625,000 | $223 | 62 |
| 2536 Malabar St | 0.49mi | 7/4.0 (+1) | 2,750 (-0%) | 14mo | $936,000 | $340 | 56 |
| 142 N Soto St | 0.30mi | 6/3.0 | 2,520 (-8%) | 22mo | $1,100,000 | $437 | 54 |
| 1613 Pennsylvania Ave | 0.50mi | 5/5.0 (-1) | 2,578 (-6%) | 3mo | $830,000 | $322 | 51 |
| 2741 Winter St | 0.63mi | 6/3.0 | 2,843 (+3%) | 20mo | $840,000 | $295 | 48 |
| 432 N Breed St | 0.25mi | 5/3.0 (-1) | 2,430 (-12%) | 21mo | $737,000 | $303 | 46 |
| 2722 E 2nd St | 0.66mi | 7/4.0 (+1) | 2,608 (-5%) | 23mo | $1,100,000 | $422 | 32 |
Match score weights: distance 35% · size 25% · config 20% · recency 20%. Top-matched comps best support the ARV.
Projected returns pro-forma
-3.0% appreciation · 0.0% rent growth · sell at horizon
- IRR
- -9.6%
- Equity multiple
- 0.66×
- Total profit
- $-66,894
- Equity at exit
- $104,223
- IRR
- -4.9%
- Equity multiple
- 0.72×
- Total profit
- $-54,101
- Equity at exit
- $60,437
Cash invested: $195,720 (down + closing). Projections, not guarantees.
Landlord ↔ Tenant lean methodology
- Overall (CITY)
- 0 Strongly Tenant-Friendly
- State California
- 18 Strongly Tenant-Friendly · D+13
- County
- — inherits STATE
- City Los Angeles
- 0 Strongly Tenant-Friendly · D+22
ZIP-level market 90033
- Home prices YoY
- -29.9%
- Rents YoY
- -2.3%
- Active inventory
- 107
- Price-to-rent
- 23.7×
Monthly cashflow live
- Estimated rent
- $7,384 high interval (Pro) →
- Mortgage (P&I)
- −$3,666
- Tax from tax record
- −$810 /mo · $9,717/yr
- Insurance
- −$291
- HOA
- −$0
- Vacancy / Maint / Mgmt
- −$1,551
- Net cashflow
- $1,067
Break-even live
3-unit breakdown (identical units grouped — click to expand)
| Units | Beds | Baths | Est. rent |
|---|---|---|---|
| 3× units | 3 | 1.3 | $7,383 |
| #1 | 3 | 1.3 | $2,461 |
| #2 | 3 | 1.3 | $2,461 |
| #3 | 3 | 1.3 | $2,461 |
| Total (3 units) | $7,384 | ||
UW: 25.0% down · 7.5% · 30yr · 1.5% tax · 5.0% vac · 8.0% maint · 8.0% mgmt
Financing live
Cash to close
- Down payment
- $174,750
- Closing costs
- $20,970
- Reserves months
- —
- Total cash needed
- —
Loan-product check · same deal, 3 products live
Conventional
25% down · 7.5% · 30yr
- Down + closing
- —
- Monthly P&I
- —
- Monthly cashflow
- —
- DSCR
- —
- Eligible?
- —
Personal DTI + credit; lowest rate.
DSCR
20% down · 8.5% · 30yr
- Down + closing
- —
- Monthly P&I
- —
- Monthly cashflow
- —
- DSCR
- —
- Eligible?
- —
No personal income docs; deal must DSCR.
Hard money
10% down · 12.0% · 12mo
- Down + closing
- —
- Monthly P&I
- —
- Monthly cashflow
- —
- DSCR
- —
- Eligible?
- —
Short-term bridge; refi at stabilization.
Rent comps 5 comps
| Address | Beds | Baths | Sqft | Rent | $/sqft | DOM | Units | Dist |
|---|---|---|---|---|---|---|---|---|
| 1571 Ricardo St Los Angeles, CA | 5.0 | 5.0 | 2250 | $4,350 | $1.93 | 15d | 1 | 1.17mi |
| 3223 Lanfranco St Los Angeles, CA | 5.0 | 4.5 | 1986 | $4,800 | $2.42 | 19d | 1 | 1.24mi |
| 3223 Lanfranco St Los Angeles, CA | 5.0 | 4.5 | 1986 | $4,900 | $2.47 | 43d | 1 | 1.24mi |
| 1652 Murchison St Unit 1654 1/2 Los Angeles, CA | 5.0 | 5.0 | 2093 | $4,677 | $2.23 | 24d | 1 | 1.29mi |
| 1652 Murchison St Unit 1650 Los Angeles, CA | 5.0 | 5.0 | 2137 | $4,095 | $1.92 | 5d | 1 | 1.29mi |
Listing history 50 events
-
2026-06-18days on market $699,000 Active 87 DOM
-
2026-06-17days on market $699,000 Active 86 DOM
-
2026-06-16days on market $699,000 Active 85 DOM
-
2026-06-15days on market $699,000 Active 84 DOM
-
2026-06-13days on market $699,000 Active 82 DOM
-
2026-06-09days on market $699,000 Active 78 DOM
-
2026-06-08days on market $699,000 Active 77 DOM
-
2026-06-07days on market $699,000 Active 76 DOM
-
2026-06-04days on market $699,000 Active 73 DOM
-
2026-06-03days on market $699,000 Active 72 DOM
-
2026-06-02days on market $699,000 Active 71 DOM
-
2026-06-01days on market $699,000 Active 70 DOM
-
2026-05-31days on market $699,000 Active 69 DOM
-
2026-04-10price $699,000 1515-char remark
Show marketing remark (1515 chars)
Historic Triplex in the Heart of Boyle Heights Delivered FULLY VACANT -- Value-Add Investment Opportunity! Located one building from Cesar Chavez Blvd near the corner of N St Louis Street, this character-rich triplex offers a rare opportunity for investors seeking strong upside potential in a vibrant and culturally significant neighborhood of Los Angeles. Designated as a historic property, the building holds unique architectural charm and longstanding community presence, making it a standout in the area. All three units will be delivered vacant, providing immediate potential for renovation and market rental income. Large 5 bedroom / 2 bath unit covers the entire upstairs. Two downstairs units are the 2 bedroom / 1 bath and a renovated 1 bedroom / 1 bath unit. The building is a heavy fixer and will require upgrades, but with the right vision, it can be repositioned as a high-performing asset in one of LA's most in-demand rental markets. Zoned LAC2, the property sits just off Boyle Heights' commercial corridor, surrounded by beloved local spots like La Monarca Bakery, Guisados, and La Parrilla. Tenants will appreciate accessibility with easy access to transit, and proximity to the 5, 10, and 101 freeways as well as downtown Los Angeles. Ideal for investors looking to restore and hold, this triplex blends historic appeal with excellent long-term rental potential. Unlock the value through thoughtful upgrades and bring this property up to market standards in a thriving, high-demand neighborhood.
-
2026-03-23$795,000 Active 1515-char remark
Show marketing remark (1515 chars)
Historic Triplex in the Heart of Boyle Heights Delivered FULLY VACANT -- Value-Add Investment Opportunity! Located one building from Cesar Chavez Blvd near the corner of N St Louis Street, this character-rich triplex offers a rare opportunity for investors seeking strong upside potential in a vibrant and culturally significant neighborhood of Los Angeles. Designated as a historic property, the building holds unique architectural charm and longstanding community presence, making it a standout in the area. All three units will be delivered vacant, providing immediate potential for renovation and market rental income. Large 5 bedroom / 2 bath unit covers the entire upstairs. Two downstairs units are the 2 bedroom / 1 bath and a renovated 1 bedroom / 1 bath unit. The building is a heavy fixer and will require upgrades, but with the right vision, it can be repositioned as a high-performing asset in one of LA's most in-demand rental markets. Zoned LAC2, the property sits just off Boyle Heights' commercial corridor, surrounded by beloved local spots like La Monarca Bakery, Guisados, and La Parrilla. Tenants will appreciate accessibility with easy access to transit, and proximity to the 5, 10, and 101 freeways as well as downtown Los Angeles. Ideal for investors looking to restore and hold, this triplex blends historic appeal with excellent long-term rental potential. Unlock the value through thoughtful upgrades and bring this property up to market standards in a thriving, high-demand neighborhood.
-
2026-02-16historical Backup Offers Accepted
-
2025-12-31Active
-
2025-07-31Active
-
2018-12-28soldstatus $700,000 Closed Sale
-
2018-12-28soldstatus $700,000
-
2018-11-05historical Active Under Contract
-
2018-10-24status Active
-
2018-10-24price $735,000
-
2018-10-10historical Active Under Contract
-
2018-10-10price $815,000
-
2018-08-13$735,000 Active
-
2018-08-13$735,000
-
2009-12-11soldstatus $185,000 Closed
-
2009-12-11soldstatus $185,000
-
2009-11-06status Pending
-
2009-10-15price $205,200
-
2009-10-15status
-
2009-10-09historical
-
2009-09-29historical
-
2009-09-29$215,900 Active
-
2009-07-06price $220,000
-
2009-06-17$280,000
-
2008-05-01historical
-
2007-10-02$549,900
-
2007-10-01historical
-
2007-03-30$559,999
-
2004-12-16soldstatus $430,000
-
2004-12-10soldstatus $420,000
-
2004-12-10soldstatus $430,000
-
2004-12-03historical
-
2004-10-13historical
-
2004-10-12$419,500
-
2004-09-23$424,500
-
2004-09-23historical
-
2004-07-28$424,500
ⓘ Source: listings_history table (triggers on properties + properties_extension) + one-shot
backfill from property_details.listing_events for pre-trigger history.
Tax reassessment forecast CA · Resets to sale price
- Current annual tax
- $9,717 · $810/mo
- Projected year-2 tax
- $9,717 · $810/mo
- Expected delta
- $0/yr ($0/mo · 0.0%)
ⓘ Screening estimate from a state-policy table — verify with the county assessor before closing.
Climate risk First Street
- Flood 1/10 Low FEMA zone X (unshaded) · 0% chance over 30 yrs
- Wildfire 1/10 Low
- Heat 6/10 Major 7 d/yr ≥94°F today · 21 d/yr by 30 yrs out
- Wind 1/10 Low
- Air quality 5/10 Major 9 unhealthy d/yr today · 9 by 30 yrs out
Nearby sold comps map
Loading sold comps map…
Walkable amenities ~0.75 mi
Loading nearby amenities…
Taxation est. · year 1
- Rental income
- $88,608
- − Mortgage interest
- −$39,155
- − Property taxes
- −$9,717
- − Insurance
- −$3,495
- − Repairs & maintenance
- −$7,089
- − Management
- −$7,089
- − Depreciation
- −$20,335
- Taxable income
- $1,729
- Est. tax owed @ 24.0%
- −$415
- After-tax cash flow
- $12,386/yr
For passive investors: Depreciation is non-cash, so a rental often shows a tax loss while cash-flowing — sheltering income. Rental losses are passive: they offset passive income freely, and up to $25,000/yr can offset ordinary (W-2) income if you actively participate and your MAGI is under $100k (phasing out to $0 by $150k); unused losses carry forward. On sale, claimed depreciation is recaptured at up to 25%, and gains may owe capital-gains tax (a 1031 exchange can defer both). Figures are a year-1 estimate at your 24.0% rate — not tax advice; consult a CPA.
Schools (NCES district)
- District
- Los Angeles Unified
- NCES district ID
- 0622710
- Math proficiency
- 29% ▼ -4.00%
- Reading proficiency
- 54% ▲ 10.00%
- Median HH income
- $50,403
- Composite
- 35.67/100
- National rank
- #4875
- State rank
- #223 of 517 in CA
Livability — Los Angeles
- Score
- 68/100
- State rank
- #273
- US rank
- #9237
Category grades
Schools grade is shown separately in the Schools card above.
Census & demographics
- Census place
- Los Angeles, CA
- County
- Los Angeles County · 9,444,647 people
- City population
- 3,838,149
- Metro
- Los Angeles-Long Beach-Anaheim, CA
- Population (ZIP)
- 45,647
- Household income
- $59,652
- Rent vs Own
- Severe rent burden
- 3159.0
Population outlook (Los Angeles County) Hauer SSP2
- Today (2025)
- 10,940,515 people
- By 2030
- 11,256,481 · +2.9%
- By 2040
- 11,729,929 · +7.2%
- By 2050
- 11,948,407 · +9.2%
- By 2075
- 11,818,114 · +8.0%
- By 2100
- 10,842,928 · -0.9%
Race, ethnicity, and origin ACS 2023
- Neighborhood character
- Predominantly Hispanic (90%)
- Race & ethnicity
- Hispanic / Latino 90% Two or more races 13% Asian 4% White 3% Native American 3% Black 1%
- Hispanic origin (detail)
- Mexican 75%
- Foreign-born
- 43% · Canada, South Korea, China
- Languages at home
- 16% English-only · Spanish 80% Other Asian/Pacific 1% Korean 1%
Political lean MEDSL · Los Angeles
- 2024 margin
- Solid D (+32.9) · D 64.8% · R 31.9% · Other 3.3%
- 2008→2024 swing
- -7.4pp toward R · 2008: 40.4pp · 2024: 32.9pp
- All cycles
- 2024: D+32.9 2020: D+44.2 2016: D+48.0 2012: D+40.0 2008: D+40.4
Not yet ingested
- Civics
- —
Market trends
- HPI YoY
- ▼ -201.59%
- Current HPI
- 472.4588
- Rent YoY
- ▼ -2.34%
- Metro
- Los Angeles-Long Beach-Anaheim, CA
- State GDP YoY
- ▲ 3.21%
- F500 in state
- 116
Industry mix (Fortune 500 HQ in CA)
| Industry | F500 HQs | Revenue |
|---|---|---|
| Technology | 27 | $1,492B |
|
||
| Financial Services | 3 | $174B |
|
||
| Retail | 3 | $44B |
|
||
| Insurance | 3 | $26B |
|
||
| Media / Entertainment | 2 | $115B |
|
||
| Pharmaceuticals / Biotech | 2 | $62B |
|
||
Price history
+217.7% since first listed44 events — show timeline
- 2026-04-10 Price Changed $699,000 TheMLS
- 2026-03-23 Listed $795,000 TheMLS
- 2026-02-16 Contingent — TheMLS
- 2025-12-31 Listed — TheMLS
- 2025-07-31 Listed — TheMLS
- 2018-12-28 Sold (MLS) $700,000 SDMLS
- 2018-12-28 Sold (MLS) $700,000 CRMLS
- 2018-11-05 Contingent — CRMLS
- 2018-10-24 Relisted — CRMLS
- 2018-10-24 Price Changed $735,000 CRMLS
- 2018-10-10 Contingent — CRMLS
- 2018-10-10 Price Changed $815,000 CRMLS
- 2018-08-13 Listed $735,000 SDMLS
- 2018-08-13 Listed $735,000 CRMLS
- 2009-12-11 Sold (Public Records) $185,000 Public Records
- 2009-12-11 Sold (MLS) $185,000 CRMLS
- 2009-11-06 Pending — CRMLS
- 2009-10-15 Price Changed $205,200 CRMLS
- 2009-10-15 Relisted — CRMLS
- 2009-10-09 Listing Removed — CRMLS
- 2009-09-29 Listing Removed — CRMLS
- 2009-09-29 Listed $215,900 CRMLS
- 2009-07-06 Price Changed $220,000 CRMLS
- 2009-06-17 Listed $280,000 CRMLS
- 2008-05-01 Listing Removed — CRMLS
- 2007-10-02 Listed $549,900 CRMLS
- 2007-10-01 Listing Removed — CRMLS
- 2007-03-30 Listed $559,999 CRMLS
- 2004-12-16 Sold (MLS) $430,000 CRMLS
- 2004-12-10 Sold (Public Records) $430,000 Public Records
- 2004-12-10 Sold (MLS) $420,000 TheMLS
- 2004-12-03 Delisted — TheMLS
- 2004-10-13 Listing Removed — CRMLS
- 2004-10-12 Listed $419,500 CRMLS
- 2004-09-23 Listing Removed — CRMLS
- 2004-09-23 Listed $424,500 CRMLS
- 2004-07-28 Listed $424,500 CRMLS
- 2004-07-28 Listed $424,500 TheMLS
- 2003-02-04 Sold (Public Records) $279,000 Public Records
- 2001-10-09 Listing Removed — CRMLS
- 2001-07-09 Listed $249,000 CRMLS
- 2001-05-17 Sold (MLS) $145,000 CRMLS
- 2000-11-22 Listed $171,000 CRMLS
- 1997-09-17 Sold (Public Records) $220,000 Public Records
Property tax history
+3.3%/yrLatest (2025): $9,717 · +1.3% YoY. Source: county tax records.
Cash-flow waterfall
monthlySold comps — $/sqft
last 12 mo · ≤1 miLoading sold comps…