 🏗️ New Construction
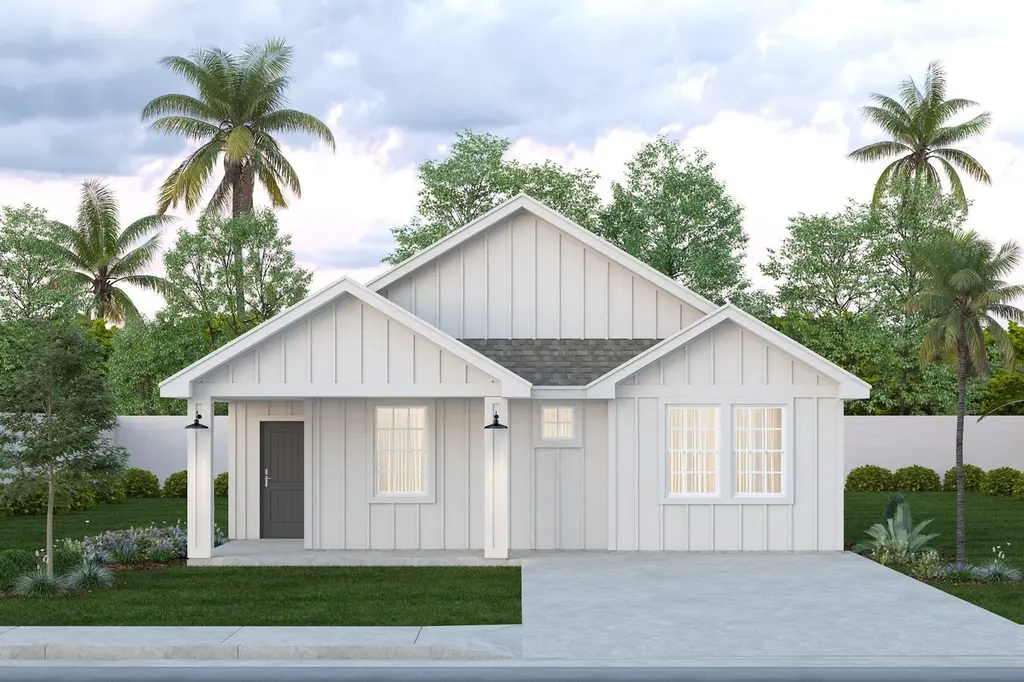
Osprey Plan · Mercedes, TX
Flood risk 1/10 · Minimal
- FEMA flood zone
- X (shaded)
- Chance of flooding over 30 yrs
- 0.0%
- Est. flood insurance / yr
- $507 – $1,088
Fire risk 2/10 · Minimal
- Est. fire insurance / yr
- $1,222 – $2,270
Heat risk 9/10 · Severe
- Hot days now (above 111°F)
- 7 days/yr
- Hot days in 30 yrs
- 25 days/yr
Wind risk 9/10 · Severe
- Chance of severe wind over 30 yrs
- 99.0%
Air-quality risk 1/10 · Minimal
- Unhealthy air days now
- 0 days/yr
- Unhealthy air days in 30 yrs
- 0 days/yr
Risk factors via First Street. Map © Google.
Why this score? — see what drove the F grade
The composite is a weighted blend of 9 inputs, each scored 0–100. Each bar is that input's sub-score; the figure is the points it added to the 100-point composite (weight × sub-score).
- ARV discount +7.5/15.0
- Appreciation +7.3/10.0
- Cash flow +7.0/30.0
- Livability +3.4/5.0
- Rent growth +2.5/5.0
- Condition / age +2.5/5.0
- 1% rule +1.9/10.0
- Schools +1.3/10.0
- DSCR +1.2/10.0
$189,990
🖨 Deal sheet (PDF) 📄 Offer letter ✓ Due diligence
Listing remarks MLS
Introducing the Osprey, a thoughtfully crafted single-story floor plan in our Harbor Home Collection-built for growing families who want more space, more comfort, and more room to live life their way. With 1,464 sq. ft. of living space, the Osprey combines smart design with a spacious, open layout that supports busy routines and meaningful moments alike. This 4-bedroom, 2-bathroom home offers flexibility for every stage of life-whether you need a dedicated home office, a nursery, or extra room for guests. The main living area brings the kitchen, dining, and family spaces together seamlessly, creating a bright and welcoming hub for everyday living. Personalize your exterior with one of four inviting elevation styles: Contemporary, Farmhouse, Tuscan, or Traditional.
Key facts
- Spacious open layout
- Listed 95 days
Tags
Neighborhood map
What this means for you Summary
Snapshot
- This is a 4-bed/2.0-bath single-family listed at $190k.
Deal economics
- At list price, monthly cash flow is $-298 ($-4k/yr) — negative.
- To cash-flow at today's rent, offer at most $163k (14.3% below list).
- To meet the 1% rule (rent ≥ 1% of price), the offer needs to be $142k (25.0% below list).
- Recommended offer: $142k (25.0% below list) — sets the bar for 1% rule.
- Cap rate 4.6% vs local median 3.4% in Mercedes — top-decile yield for the area; either an underpriced asset or a hidden risk that comps aren't pricing in. Stress-test before assuming the spread holds.
Location & tenants
- Location reads 67/100 on livability (#547 in TX) — a middle-class / working-renter tenant base. Strengths: cost of living A+, housing A+, health & safety A+; Watch: schools D+, crime F, amenities F.
- Mercedes ISD (suburban): math 12% / reading 21% proficiency, ranked #811 of 826 in TX (top 98%) — low school quality limits family demand, transient renter base, plan for 1-2y turnover; 80% free/reduced lunch — lower-income household profile, screen leases tightly.
- Market conditions: 392 active listings in the ZIP; 7,378 units permitted in Hidalgo County in 2024 (641 in 5+ unit buildings).
Forward outlook
- In year one you build about $11k of equity ($1k loan paydown + $9k appreciation (4.5% local appreciation)).
- Hidalgo County population projected at +28% by 2050 — long-run rental-demand tailwind backs the buy-and-hold thesis.
- By year 4, paydown + projected appreciation supports a ~$36k cash-out refi (75% LTV) — recoverable capital for the next deal without selling this one.
Negotiation context
- It's been on market 95 days — a 9% lower offer ($173k) is reasonable based on typical stale-listing flexibility.
Risks & watch-outs
- Climate carrying-cost: severe wind risk, 99% chance of damaging wind over 30y; extreme-heat days projected 7→25/yr by 2055 (HVAC capex compounding) — expect insurance premiums to compound above CPI over the hold.
Questions for the listing agent
- What do current leases actually rent for vs. the listed asking? Can we see a recent rent roll and the last 12 months of T-12 income?
- It's been on market 95 days. Have you received any prior offers? Is the seller open to a 25% concession, seller financing, or rate buy-down credit?
- Why hasn't it sold? Are there any deal-killer items the seller is aware of (foundation, flood, title, zoning, code violations)?
- Is there a deadline driving the sale (1031 exchange, divorce, estate, relocation)? That informs how much negotiation room exists.
- Schools are D-rated, which usually means shorter tenancies and higher turnover. Who's the typical renter profile here, and what's been the actual vacancy rate?
- Crime grade is F in this area — have there been break-ins, vandalism, or insurance claims at this property in the last 3 years? What carrier currently insures it and at what premium?
- The area grade is low — what's the realistic commute time and amenity access for the typical tenant pool here? Any planned neighborhood developments (good or bad) we should know about?
- What's the average days-on-market for RENTAL listings here right now (not sales)? A rising rental-DOM trend means longer vacancies and softer asking-rent achievability than the comps imply.
- What's the recent tenant-quality profile in this submarket — average credit score on applications, eviction rate, late-payment / NSF rate, and stable-employment percentage? A property-management company in the area should have these aggregated.
- How much new for-sale + rental construction is in the pipeline within 1–3 miles? Heavy new supply typically softens prices + rents 12–24 months out; constrained supply supports both.
Investment metrics
- 1% rule
- 0.69% ✗
- Cap rate
- 4.55%
- Cash-on-cash
- -6.21%
- DSCR
- 0.72
- GRM
- 12.1
CMA / ARV
- ARV (median comp)
- $206,069
- List price
- $189,990
- Delta
- -7.80%
- Verdict
- FAIR
- Comps
- 9 within 1.0 mi
Projected returns pro-forma
4.53% appreciation · 3.0% rent growth · sell at horizon
- IRR
- 6.3%
- Equity multiple
- 1.40×
- Total profit
- $22,970
- Equity at exit
- $110,885
- IRR
- 8.7%
- Equity multiple
- 2.54×
- Total profit
- $88,720
- Equity at exit
- $186,670
Cash invested: $57,699 (down + closing). Projections, not guarantees.
Landlord ↔ Tenant lean methodology
- Overall (STATE)
- 87 Strongly Landlord-Friendly
- State Texas
- 87 Strongly Landlord-Friendly · R+5
- County
- — inherits STATE
- City
- — inherits STATE
ZIP-level market 78570
- Home prices YoY
- 1.9%
- Active inventory
- 392
- Price-to-rent
- 11.1×
Monthly cashflow live
- Estimated rent
- $1,425 medium interval (Pro) →
- Mortgage (P&I)
- −$1,081
- Tax est. 1.5%
- −$258 /mo · $3,091/yr
- Insurance
- −$86
- HOA
- −$0
- Vacancy / Maint / Mgmt
- −$299
- Net cashflow
- $-298
Break-even live
Sensitivity live
| Price | -10% $-156 | -5% $-227 | +0% $-298 | +5% $-370 | +10% $-441 |
|---|---|---|---|---|---|
| Rent | -10% $-411 | -5% $-355 | +0% $-298 | +5% $-242 | +10% $-186 |
| Rate | -1.0pp $-195 | -0.5pp $-246 | base $-298 | +0.5pp $-352 | +1.0pp $-406 |
UW: 25.0% down · 7.5% · 30yr · 1.5% tax · 5.0% vac · 8.0% maint · 8.0% mgmt
Financing live
Cash to close
- Down payment
- $51,517
- Closing costs
- $6,182
- Reserves months
- —
- Total cash needed
- —
Loan-product check · same deal, 3 products live
Conventional
25% down · 7.5% · 30yr
- Down + closing
- —
- Monthly P&I
- —
- Monthly cashflow
- —
- DSCR
- —
- Eligible?
- —
Personal DTI + credit; lowest rate.
DSCR
20% down · 8.5% · 30yr
- Down + closing
- —
- Monthly P&I
- —
- Monthly cashflow
- —
- DSCR
- —
- Eligible?
- —
No personal income docs; deal must DSCR.
Hard money
10% down · 12.0% · 12mo
- Down + closing
- —
- Monthly P&I
- —
- Monthly cashflow
- —
- DSCR
- —
- Eligible?
- —
Short-term bridge; refi at stabilization.
Listing history 17 events
-
2026-06-21days on market $189,990 Active 95 DOM
-
2026-06-18days on market $189,990 Active 93 DOM
-
2026-06-17days on market $189,990 Active 92 DOM
-
2026-06-16days on market $189,990 Active 91 DOM
-
2026-06-15days on market $189,990 Active 90 DOM
-
2026-06-15days on market $189,990 Active 89 DOM
-
2026-06-13days on market $189,990 Active 88 DOM
-
2026-06-12days on market $189,990 Active 87 DOM
-
2026-06-10days on market $189,990 Active 84 DOM
-
2026-06-08days on market $189,990 Active 83 DOM
-
2026-06-08days on market $189,990 Active 82 DOM
-
2026-06-07days on market $189,990 Active 81 DOM
-
2026-06-03days on market $189,990 Active 78 DOM
-
2026-06-02days on market $189,990 Active 77 DOM
-
2026-06-01days on market $189,990 Active 76 DOM
-
2026-05-31days on market $189,990 Active 75 DOM
-
2026-03-17$189,990 Active 774-char remark
Show marketing remark (774 chars)
Introducing the Osprey, a thoughtfully crafted single-story floor plan in our Harbor Home Collection-built for growing families who want more space, more comfort, and more room to live life their way. With 1,464 sq. ft. of living space, the Osprey combines smart design with a spacious, open layout that supports busy routines and meaningful moments alike. This 4-bedroom, 2-bathroom home offers flexibility for every stage of life-whether you need a dedicated home office, a nursery, or extra room for guests. The main living area brings the kitchen, dining, and family spaces together seamlessly, creating a bright and welcoming hub for everyday living. Personalize your exterior with one of four inviting elevation styles: Contemporary, Farmhouse, Tuscan, or Traditional.
ⓘ Source: listings_history table (triggers on properties + properties_extension) + one-shot
backfill from property_details.listing_events for pre-trigger history.
Climate risk First Street
- Flood 1/10 Low FEMA zone X (shaded) · 0% chance over 30 yrs
- Wildfire 2/10 Low
- Heat 9/10 Extreme 7 d/yr ≥111°F today · 25 d/yr by 30 yrs out
- Wind 9/10 Extreme 99% chance of damaging wind over 30 yrs
- Air quality 1/10 Low 0 unhealthy d/yr today · 0 by 30 yrs out
Nearby sold comps map
Loading sold comps map…
Walkable amenities ~0.75 mi
Loading nearby amenities…
Taxation est. · year 1
- Rental income
- $17,098
- − Mortgage interest
- −$11,543
- − Property taxes
- −$3,091
- − Insurance
- −$1,030
- − Repairs & maintenance
- −$1,368
- − Management
- −$1,368
- − Depreciation
- −$5,995
- Taxable loss
- −$7,297
- Est. tax savings @ 24.0%
- +$1,751
- After-tax cash flow
- $-1,830/yr
For passive investors: Depreciation is non-cash, so a rental often shows a tax loss while cash-flowing — sheltering income. Rental losses are passive: they offset passive income freely, and up to $25,000/yr can offset ordinary (W-2) income if you actively participate and your MAGI is under $100k (phasing out to $0 by $150k); unused losses carry forward. On sale, claimed depreciation is recaptured at up to 25%, and gains may owe capital-gains tax (a 1031 exchange can defer both). Figures are a year-1 estimate at your 24.0% rate — not tax advice; consult a CPA.
Schools (NCES district)
- District
- Mercedes ISD
- NCES district ID
- 4830250
- Math proficiency
- 12% ▼ -26.00%
- Reading proficiency
- 21% ▼ -10.00%
- Median HH income
- $27,606
- Composite
- 12.84/100
- National rank
- #9596
- State rank
- #811 of 826 in TX
Livability — Mercedes
- Score
- 67/100
- State rank
- #547
- US rank
- #10619
Category grades
Schools grade is shown separately in the Schools card above.
Census & demographics
- Population (ZIP)
- 33,596
Population outlook (Hidalgo County) Hauer SSP2
- Today (2025)
- 955,232 people
- By 2030
- 1,009,774 · +5.7%
- By 2040
- 1,120,332 · +17.3%
- By 2050
- 1,225,036 · +28.2%
- By 2075
- 1,439,189 · +50.7%
- By 2100
- 1,533,429 · +60.5%
Race, ethnicity, and origin ACS 2023
- Neighborhood character
- Predominantly Hispanic (96%)
- Race & ethnicity
- Hispanic / Latino 96% Two or more races 44% White 4%
- Hispanic origin (detail)
- Mexican 91%
- Foreign-born
- 20% · Canada
- Languages at home
- 18% English-only · Spanish 82%
Political lean MEDSL · Hidalgo
- 2024 margin
- Toss-up / Even · D 48.1% · R 51.0%
- 2008→2024 swing
- -41.6pp toward R · 2008: 38.7pp · 2024: -2.9pp
- All cycles
- 2024: R+2.9 2020: D+17.1 2016: D+40.5 2012: D+41.8 2008: D+38.7
Not yet ingested
- Civics
- —
Market trends
- HPI YoY
- ▲ 4.53%
- Current HPI
- 238.8386
- Rent YoY
- —
- Metro
- —
- State GDP YoY
- ▲ 3.95%
- F500 in state
- 110
Industry mix (Fortune 500 HQ in TX)
| Industry | F500 HQs | Revenue |
|---|---|---|
| Energy | 16 | $1,198B |
|
||
| Technology | 5 | $198B |
|
||
| Engineering / Construction | 4 | $72B |
|
||
| Energy Services | 3 | $60B |
|
||
| Utilities | 3 | $41B |
|
||
| Healthcare | 2 | $330B |
|
||
Price history
1 event — show timeline
- 2026-03-17 Listed $189,990 Zillow
Cash-flow waterfall
monthlySold comps — $/sqft
last 12 mo · ≤1 miLoading sold comps…