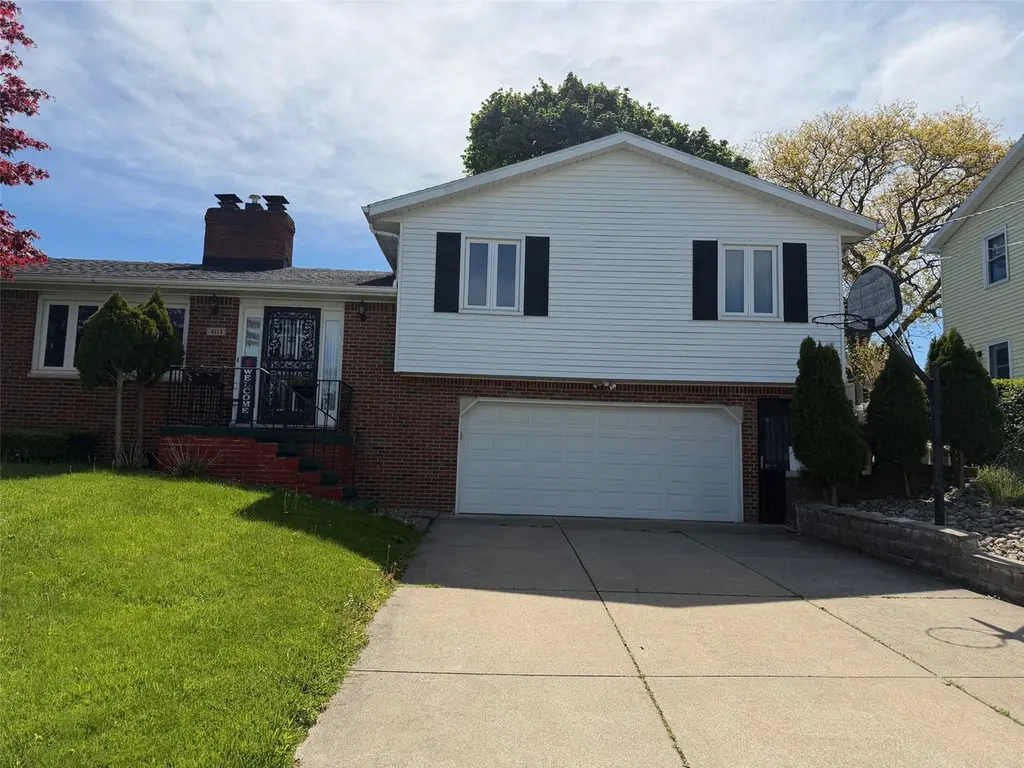
4113 Naples Ave · Erie, PA
Flood risk 1/10 · Minimal
- FEMA flood zone
- X (unshaded)
- Chance of flooding over 30 yrs
- 0.0%
- Est. flood insurance / yr
- $473 – $860
Fire risk 1/10 · Minimal
- Est. fire insurance / yr
- $511 – $949
Heat risk 2/10 · Minimal
- Hot days now (above 89°F)
- 6 days/yr
- Hot days in 30 yrs
- 15 days/yr
Wind risk 1/10 · Minimal
- Chance of severe wind over 30 yrs
- —
Air-quality risk 2/10 · Minimal
- Unhealthy air days now
- 1 days/yr
- Unhealthy air days in 30 yrs
- 3 days/yr
Risk factors via First Street. Map © Google.
Why this score? — see what drove the F grade
The composite is a weighted blend of 9 inputs, each scored 0–100. Each bar is that input's sub-score; the figure is the points it added to the 100-point composite (weight × sub-score).
- Cash flow +14.9/30.0
- 1% rule +4.5/10.0
- DSCR +4.5/10.0
- Livability +4.2/5.0
- Rent growth +2.5/5.0
- Condition / age +2.5/5.0
- Schools +1.3/10.0
- ARV discount +0.0/15.0
- Appreciation +0.0/10.0
$249,900
🖨 Deal sheet (PDF) 📄 Offer letter ✓ Due diligence
Listing remarks MLS
Multi-level home in a quiet neighborhood with lots of custom features. 1st floor includes living room w/ fireplace, kitchen w/ gas stovetop, dining room, bedroom, full bath and a den/office w/ access to the back yard and large skylighted patio. Second floor has (3) bedrooms, more communal space and another full bath. The finished lower level has a custom bar, a 1/2 bath, a laundry room, fireplace and room for a pool table. The 2 car attached garage has 2 hidden work spaces for the handyman.
Key facts
- Gas cooktop kitchen
- Custom bar
- Skylit patio
Tags
Property features AI
Finance
- HOA & community: Sidewalks in the community
Exterior
- Parking: Attached 2-car garage; 2 total parking spaces
- Security: Fire alarm
- Utilities: Public water; Public sewer; Cable available
- Home design: Single-family residence; Multi/split level; Residential property
- Construction: Brick and frame construction; Asphalt roof
- Exterior features: Storage; Covered patio; Fenced yard; Shed(s)
Interior
- Kitchen: Gas cooktop; Gas oven; Microwave; Refrigerator; Exhaust fan
- Flooring: Carpet; Ceramic tile; Laminate
- Bathrooms: 2 full bathrooms; 1 half bathroom
- Heating & cooling: Hot water heating; Central air conditioning
- Interior features: Window coverings and drapes; Pellet stove fireplace; Finished basement; 15 total rooms
Neighborhood map
What this means for you Summary
Snapshot
- This is a 4-bed/2.5-bath single-family listed at $250k.
Deal economics
- At list price, monthly cash flow is $71 ($853/yr) — positive.
- The deal already cash-flows at list — no discount required.
- To meet the 1% rule (rent ≥ 1% of price), the offer needs to be $237k (5.2% below list).
- Recommended offer: $237k (5.2% below list) — sets the bar for 1% rule.
- Cap rate 6.6% vs local median 5.4% in Erie — meaningfully above typical; check what's discounted (condition, days-on-market, listing class) to confirm the premium yield is real.
Location & tenants
- Location reads 83/100 on livability (#109 in PA, #840 nationally) — a professional / high-income tenant draw. Strengths: amenities A+, commute A+, cost of living A+; Watch: crime D+, employment F.
- Erie City SD (urban): math 12% / reading 19% proficiency, ranked #510 of 539 in PA (top 95%) — low school quality limits family demand, transient renter base, plan for 1-2y turnover; 81% free/reduced lunch — lower-income household profile, screen leases tightly.
- Zoned schools: Grover Cleveland El Sch (math 18% / reading 30%, grade F, #1,211 of 1,518 statewide, top 80%, 554 students, 100% FRL); Northwest Pa Collegiate Academy (math 82%, 753 students, 100% FRL) — zoned schools average 100% FRL vs 81% district-wide (19 pts higher); higher-poverty schools than district average — tighter screening recommended.
- Market conditions: 120 active listings in the ZIP; 4 comparable units currently listed for rent nearby; rentals lingering (median 46d on market — plan ~5-8 weeks vacancy on turnover, expect pricing pressure); 100% of comp listings sitting > 30 days — soft ceiling on asking rent; 364 units permitted in Erie County in 2024 (188 in 5+ unit buildings).
- This rent runs 41% of the median local income ($69k/yr) — at the standard rent-burdened threshold; future hikes will face affordability resistance.
Forward outlook
- Local home prices are declining (-3.0%/yr); year-one equity from $2k of loan paydown is wiped out by about $7k of value loss. Plan a longer hold.
- Erie County population projected at -14% by 2050 — secular population decline; favor cash flow + early exit over multi-decade hold.
Negotiation context
- Only 1 days on market — expect competitive offers; lowballing is unlikely to land.
- 2 sale attempts since 5y ago with the ask held roughly flat each time — persistent listings suggest the price (not the market) is what's stuck; bring a comps-based counter.
- Current owner paid $182k; 37% above their basis — modest negotiation headroom, anchor on the comps not their cost.
Questions for the listing agent
- Built in 1976 — when were the roof, HVAC, electrical panel, plumbing, and water heater last replaced?
- Is there a deadline driving the sale (1031 exchange, divorce, estate, relocation)? That informs how much negotiation room exists.
- Crime grade is D in this area — have there been break-ins, vandalism, or insurance claims at this property in the last 3 years? What carrier currently insures it and at what premium?
- The area grade is low — what's the realistic commute time and amenity access for the typical tenant pool here? Any planned neighborhood developments (good or bad) we should know about?
- What's the average days-on-market for RENTAL listings here right now (not sales)? A rising rental-DOM trend means longer vacancies and softer asking-rent achievability than the comps imply.
- What's the recent tenant-quality profile in this submarket — average credit score on applications, eviction rate, late-payment / NSF rate, and stable-employment percentage? A property-management company in the area should have these aggregated.
- How much new for-sale + rental construction is in the pipeline within 1–3 miles? Heavy new supply typically softens prices + rents 12–24 months out; constrained supply supports both.
Investment metrics
- 1% rule
- 0.95% ✗
- Cap rate
- 6.63%
- Cash-on-cash
- 1.22%
- DSCR
- 1.05
- GRM
- 8.8
CMA / ARV
- ARV (on-the-fly)
- $195,048
- Comps found
- 12
Show comp detail 12 sales within ~0.75 mi
| Address | Dist | Beds/Ba | Sqft | Sold | Price | $/sf | Match |
|---|---|---|---|---|---|---|---|
| 3926 Wood St | 0.25mi | 4/1.5 | 1,656 (+7%) | 3mo | $175,000 | $106 | 70 |
| 717 W 40th St | 0.14mi | 3/1.5 (-1) | 1,668 (+8%) | 6mo | $289,000 | $173 | 66 |
| 3929 Davenport Ave | 0.21mi | 3/1.0 (-1) | 1,628 (+5%) | 7mo | $120,000 | $74 | 64 |
| 606 Hilltop Rd | 0.36mi | 3/2.0 (-1) | 1,404 (-9%) | 4mo | $80,000 | $57 | 58 |
| 136 Brighton Ave | 0.36mi | 3/1.0 (-1) | 1,408 (-9%) | 5mo | $202,500 | $144 | 53 |
| 1142 W Gore Rd | 0.54mi | 3/1.5 (-1) | 1,410 (-9%) | 1mo | $305,000 | $216 | 50 |
| 3509 Maple St | 0.61mi | 3/2.0 (-1) | 1,438 (-7%) | 3mo | $118,000 | $82 | 50 |
| 4430 Harding Dr | 0.40mi | 3/2.0 (-1) | 1,392 (-10%) | 9mo | $236,000 | $170 | 50 |
| 1351 W 41st St | 0.65mi | 3/1.5 (-1) | 1,464 (-5%) | 6mo | $184,000 | $126 | 47 |
| 460 W Gore Rd | 0.51mi | 3/2.5 (-1) | 1,766 (+14%) | 5mo | $325,000 | $184 | 44 |
| 3325 Maple St | 0.69mi | 4/1.5 | 1,414 (-9%) | 7mo | $150,000 | $106 | 44 |
| 925 W 33rd St | 0.71mi | 3/1.0 (-1) | 1,386 (-10%) | 5mo | $168,000 | $121 | 34 |
Match score weights: distance 35% · size 25% · config 20% · recency 20%. Top-matched comps best support the ARV.
Projected returns pro-forma
-3.0% appreciation · 3.0% rent growth · sell at horizon
- IRR
- -14.3%
- Equity multiple
- 0.49×
- Total profit
- $-35,885
- Equity at exit
- $37,261
- IRR
- -5.5%
- Equity multiple
- 0.64×
- Total profit
- $-25,087
- Equity at exit
- $21,607
Cash invested: $69,972 (down + closing). Projections, not guarantees.
Landlord ↔ Tenant lean methodology
- Overall (STATE)
- 62 Landlord-Friendly
- State Pennsylvania
- 62 Landlord-Friendly · EVEN
- County
- — inherits STATE
- City
- — inherits STATE
ZIP-level market 16509
- Home prices YoY
- -30.7%
- Active inventory
- 120
- Price-to-rent
- 8.8×
Monthly cashflow live
- Estimated rent
- $2,370 medium interval (Pro) →
- Mortgage (P&I)
- −$1,311
- Tax from tax record
- −$387 /mo · $4,639/yr
- Insurance
- −$104
- HOA
- −$0
- Vacancy / Maint / Mgmt
- −$498
- Net cashflow
- $71
Break-even live
Sensitivity live
| Price | -10% $213 | -5% $142 | +0% $71 | +5% $0 | +10% $-70 |
|---|---|---|---|---|---|
| Rent | -10% $-116 | -5% $-23 | +0% $71 | +5% $165 | +10% $258 |
| Rate | -1.0pp $197 | -0.5pp $135 | base $71 | +0.5pp $6 | +1.0pp $-60 |
UW: 25.0% down · 7.5% · 30yr · 1.5% tax · 5.0% vac · 8.0% maint · 8.0% mgmt
Financing live
Cash to close
- Down payment
- $62,475
- Closing costs
- $7,497
- Reserves months
- —
- Total cash needed
- —
Loan-product check · same deal, 3 products live
Conventional
25% down · 7.5% · 30yr
- Down + closing
- —
- Monthly P&I
- —
- Monthly cashflow
- —
- DSCR
- —
- Eligible?
- —
Personal DTI + credit; lowest rate.
DSCR
20% down · 8.5% · 30yr
- Down + closing
- —
- Monthly P&I
- —
- Monthly cashflow
- —
- DSCR
- —
- Eligible?
- —
No personal income docs; deal must DSCR.
Hard money
10% down · 12.0% · 12mo
- Down + closing
- —
- Monthly P&I
- —
- Monthly cashflow
- —
- DSCR
- —
- Eligible?
- —
Short-term bridge; refi at stabilization.
Rent comps 4 comps
| Address | Beds | Baths | Sqft | Rent | $/sqft | DOM | Units | Dist |
|---|---|---|---|---|---|---|---|---|
| 126 W 38th St Erie, PA | 4.0 | 2.0 | 1850 | $4,000 | $2.16 | 45d | 1 | 0.94mi |
| 504 W 29th St Unit 2 Erie, PA | 3.0 | 1.0 | 1200 | $1,500 | $1.25 | 45d | 1 | 1.01mi |
| 2702 Raspberry St Unit 1 Erie, PA | 3.0 | 1.0 | 2000 | $1,200 | $0.60 | 45d | 1 | 1.11mi |
| 115 W 32nd St Erie, PA | 3.0 | 2.0 | 1844 | $1,050 | $0.57 | 45d | 1 | 1.15mi |
Listing history 5 events
-
2026-05-12status Pending
-
2026-05-11$249,900 Active
-
2021-11-18soldstatus $182,500
-
2021-11-17soldstatus $182,500 495-char remark
Show marketing remark (495 chars)
Multi-level home in a quiet neighborhood with lots of custom features. 1st floor includes living room w/ fireplace, kitchen w/ gas stovetop, dining room, bedroom, full bath and a den/office w/ access to the back yard and large skylighted patio. Second floor has (3) bedrooms, more communal space and another full bath. The finished lower level has a custom bar, a 1/2 bath, a laundry room, fireplace and room for a pool table. The 2 car attached garage has 2 hidden work spaces for the handyman.
-
2021-10-05$179,900 495-char remark
Show marketing remark (495 chars)
Multi-level home in a quiet neighborhood with lots of custom features. 1st floor includes living room w/ fireplace, kitchen w/ gas stovetop, dining room, bedroom, full bath and a den/office w/ access to the back yard and large skylighted patio. Second floor has (3) bedrooms, more communal space and another full bath. The finished lower level has a custom bar, a 1/2 bath, a laundry room, fireplace and room for a pool table. The 2 car attached garage has 2 hidden work spaces for the handyman.
ⓘ Source: listings_history table (triggers on properties + properties_extension) + one-shot
backfill from property_details.listing_events for pre-trigger history.
Tax reassessment forecast PA · Partial reset (capped growth)
- Current annual tax
- $4,639 · $387/mo
- Projected year-2 tax
- $4,639 · $387/mo
- Expected delta
- $0/yr ($0/mo · 0.0%)
ⓘ Screening estimate from a state-policy table — verify with the county assessor before closing.
Climate risk First Street
- Flood 1/10 Low FEMA zone X (unshaded) · 0% chance over 30 yrs
- Wildfire 1/10 Low
- Heat 2/10 Low 6 d/yr ≥89°F today · 15 d/yr by 30 yrs out
- Wind 1/10 Low
- Air quality 2/10 Low 1 unhealthy d/yr today · 3 by 30 yrs out
Nearby sold comps map
Loading sold comps map…
Walkable amenities ~0.75 mi
Loading nearby amenities…
Taxation est. · year 1
- Rental income
- $28,440
- − Mortgage interest
- −$13,998
- − Property taxes
- −$4,639
- − Insurance
- −$1,250
- − Repairs & maintenance
- −$2,275
- − Management
- −$2,275
- − Depreciation
- −$7,270
- Taxable loss
- −$3,267
- Est. tax savings @ 24.0%
- +$784
- After-tax cash flow
- $1,637/yr
For passive investors: Depreciation is non-cash, so a rental often shows a tax loss while cash-flowing — sheltering income. Rental losses are passive: they offset passive income freely, and up to $25,000/yr can offset ordinary (W-2) income if you actively participate and your MAGI is under $100k (phasing out to $0 by $150k); unused losses carry forward. On sale, claimed depreciation is recaptured at up to 25%, and gains may owe capital-gains tax (a 1031 exchange can defer both). Figures are a year-1 estimate at your 24.0% rate — not tax advice; consult a CPA.
Schools (NCES district)
- District
- Erie City SD
- NCES district ID
- 4209300
- Math proficiency
- 12% ▼ -11.00%
- Reading proficiency
- 19% ▼ -16.00%
- Median HH income
- $33,625
- Composite
- 12.59/100
- National rank
- #9617
- State rank
- #510 of 539 in PA
Livability — Erie
- Score
- 83/100
- State rank
- #109
- US rank
- #840
Category grades
Schools grade is shown separately in the Schools card above.
Census & demographics
- Census place
- Erie, PA
- County
- Erie County · 92,215 people
- City population
- 92,215
- Metro
- Erie, PA
- Population (ZIP)
- 28,595
- Household income
- $68,846
- Rent vs Own
- Severe rent burden
- 870.0
Population outlook (Erie County) Hauer SSP2
- Today (2025)
- 272,159 people
- By 2030
- 266,299 · -2.2%
- By 2040
- 250,987 · -7.8%
- By 2050
- 234,925 · -13.7%
- By 2075
- 199,164 · -26.8%
- By 2100
- 162,985 · -40.1%
Race, ethnicity, and origin ACS 2023
- Neighborhood character
- Predominantly White (87%)
- Race & ethnicity
- White 87% Two or more races 6% Black 4% Hispanic / Latino 3% Asian 1%
- Common ancestry
- Romanian 14% Slovak 4% Scotch-Irish 2%
- Foreign-born
- 6% · Canada
- Languages at home
- 92% English-only · Russian/Polish/Slavic 3% German/W. Germanic 1% Spanish 1%
Political lean MEDSL · Erie
- 2024 margin
- Toss-up / Even · D 49.0% · R 50.0%
- 2008→2024 swing
- -20.9pp toward R · 2008: 19.9pp · 2024: -1.0pp
- All cycles
- 2024: R+1.0 2020: D+1.0 2016: R+2.0 2012: D+16.9 2008: D+19.9
Not yet ingested
- Civics
- —
Market trends
- HPI YoY
- ▼ -106.54%
- Current HPI
- 240.361
- Rent YoY
- —
- Metro
- Erie, PA
- State GDP YoY
- ▲ 1.68%
- F500 in state
- 34
Industry mix (Fortune 500 HQ in PA)
| Industry | F500 HQs | Revenue |
|---|---|---|
| Healthcare | 2 | $309B |
|
||
| Insurance | 2 | $27B |
|
||
| Telecommunications / Media | 1 | $124B |
|
||
| Industrial Distribution | 1 | $22B |
|
||
| Financial Services | 1 | $20B |
|
||
| Chemicals / Materials | 1 | $18B |
|
||
Price history
+38.9% since first listed5 events — show timeline
- 2026-05-12 Pending — GEBOR
- 2026-05-11 Listed $249,900 GEBOR
- 2021-11-18 Sold (Public Records) $182,500 Public Records
- 2021-11-17 Sold (MLS) $182,500 GEBOR
- 2021-10-05 Listed $179,900 GEBOR
Property tax history
+1.9%/yrLatest (2026): $4,639 · +3.4% YoY. Source: county tax records.
Cash-flow waterfall
monthlySold comps — $/sqft
last 12 mo · ≤1 miLoading sold comps…