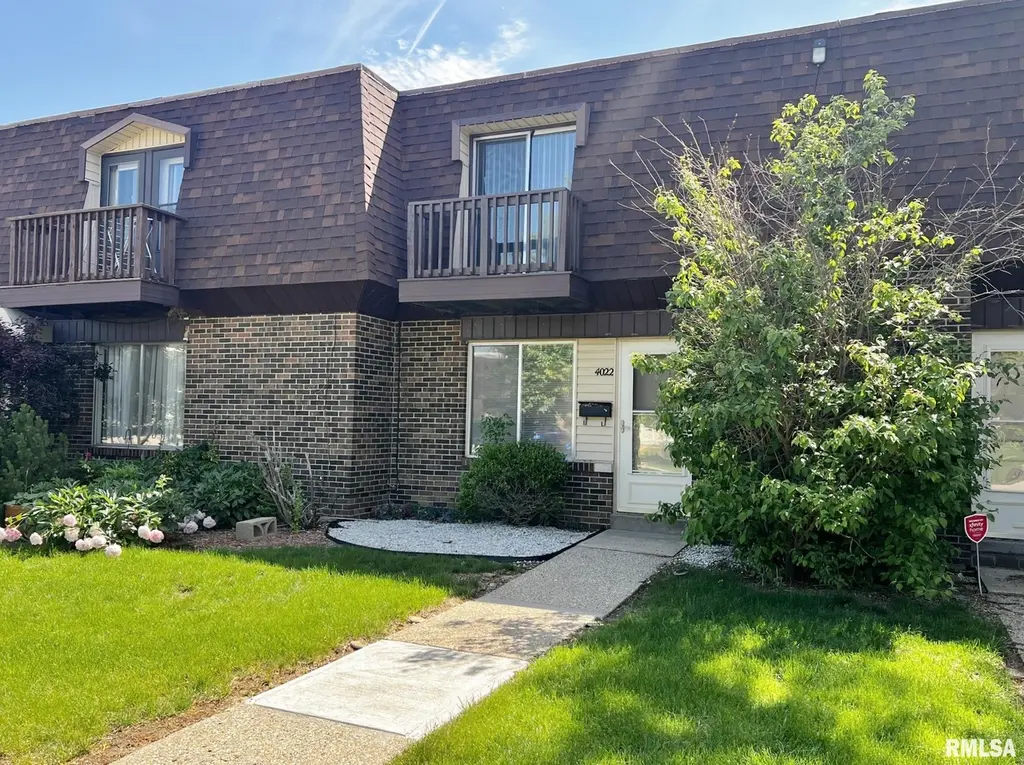
4022 N Westport Ct · Peoria, IL
Flood risk 1/10 · Minimal
- FEMA flood zone
- X
- Chance of flooding over 30 yrs
- 0.0%
- Est. flood insurance / yr
- $507 – $1,088
Fire risk 1/10 · Minimal
- Est. fire insurance / yr
- $804 – $1,492
Heat risk 3/10 · Minor
- Hot days now (above 104°F)
- 7 days/yr
- Hot days in 30 yrs
- 18 days/yr
Wind risk 2/10 · Minimal
- Chance of severe wind over 30 yrs
- 1.0%
Air-quality risk 3/10 · Minor
- Unhealthy air days now
- 1 days/yr
- Unhealthy air days in 30 yrs
- 3 days/yr
Risk factors via First Street. Map © Google.
Why this score? — see what drove the C+ grade
The composite is a weighted blend of 9 inputs, each scored 0–100. Each bar is that input's sub-score; the figure is the points it added to the 100-point composite (weight × sub-score).
- Cash flow +25.3/30.0
- 1% rule +10.0/10.0
- DSCR +8.3/10.0
- ARV discount +7.5/15.0
- Livability +3.7/5.0
- Rent growth +2.5/5.0
- Condition / age +2.5/5.0
- Schools +1.1/10.0
- Appreciation +0.0/10.0
$69,900
🖨 Deal sheet (PDF) 📄 Offer letter ✓ Due diligence
Listing remarks MLS
Easy condo living at an affordable price! This 2 bedroom, 1 1/2 bath townhouse is move-in ready! Amenities include; freshly painted interior, laminate flooring throughout living room and bedrooms, updated kitchen with all appliances, attached garage, main floor laundry(washer and dryer included), monthly fee includes insurance on the structure-snow removal-lawn care-cable TV, easy access to I-74/Northwoods Mall/Westlake Shopping Center and more! Agent owned. Only $47,900
Key facts
- Laminate flooring
- Main floor laundry
- Updated kitchen
Tags
Property features AI
Finance
- HOA & community: HOA fee listed; includes landscaping and cable TV
Exterior
- Parking: Attached 1-car garage
- Utilities: Public water; Public sewer
- Home design: Residential property; Condo/attached property; 2 stories; Built in 1968
- Construction: No new construction
- Exterior features: Shingle roof; Level lot; Paved road access
Interior
- Kitchen: Refrigerator included
- Bedrooms: 2 bedrooms (both on upper level)
- Flooring: Luxury vinyl plank throughout main and upper level rooms
- Bathrooms: 1 full bathroom; 1 half bathroom
- Heating & cooling: Central air conditioning; Forced air heating; Gas water heater
- Interior features: Cable available; No basement
- Laundry & utility: Main level laundry room
Neighborhood map
What this means for you Summary
Snapshot
- This is a 2-bed/1.5-bath condo listed at $70k.
Deal economics
- At list price, monthly cash flow is $159 ($2k/yr) — positive.
- The deal already cash-flows at list — no discount required.
- Meets the 1% rule at list price ($1k rent vs $70k).
- Cap rate 9.0% vs local median 5.5% in Peoria — top-decile yield for the area; either an underpriced asset or a hidden risk that comps aren't pricing in. Stress-test before assuming the spread holds.
Location & tenants
- Location reads 73/100 on livability (#270 in IL) — a middle-class / working-renter tenant base. Strengths: commute A+, cost of living A+, housing A+; Watch: employment D+, crime F.
- Peoria SD 150 (urban): math 11% / reading 14% proficiency, ranked #554 of 620 in IL (top 89%) — low school quality limits family demand, transient renter base, plan for 1-2y turnover; 70% free/reduced lunch — lower-income household profile, screen leases tightly.
- Zoned schools: Dr Maude A Sanders Primary School (math 2% / reading 2%, grade F, #1,927 of 2,056 statewide, top 100%, 396 students, 0% FRL); Sterling Middle School (math 0% / reading 4%, grade F, #664 of 665 statewide, top 100%, 385 students, 0% FRL); Peoria High School (math 4% / reading 7%, grade F, #609 of 693 statewide, top 88%, 1,447 students, 0% FRL) — zoned schools average 0% FRL vs 70% district-wide (70 pts lower); this property's tenant base skews higher-income than the district average.
- Market conditions: 130 active listings in the ZIP; 18 comparable units currently listed for rent nearby; rentals at typical pace (median 16d on market — plan ~3-4 weeks tenant-placement turnaround); solid renter incomes; 73 units permitted in Peoria County in 2024 (0 in 5+ unit buildings).
- This rent is only 18% of the median local income ($80k/yr) — well below the 30% rent-burden line; pricing power to push rent on renewal without tenant pushback.
Forward outlook
- Local home prices are declining (-3.0%/yr); year-one equity from $483 of loan paydown is wiped out by about $2k of value loss. Plan a longer hold.
- Peoria County population projected at -11% by 2050 — secular population decline; favor cash flow + early exit over multi-decade hold.
Negotiation context
- Only 1 days on market — expect competitive offers; lowballing is unlikely to land.
- 2 sale attempts since 6y ago with the ask held roughly flat each time — persistent listings suggest the price (not the market) is what's stuck; bring a comps-based counter.
- Current owner paid $47k; 49% above their basis — modest negotiation headroom, anchor on the comps not their cost.
Risks & watch-outs
- Watch-outs: property tax is 2.5% of price.
Questions for the listing agent
- Built in 1968 — when were the roof, HVAC, electrical panel, plumbing, and water heater last replaced?
- Property tax is high relative to price — has the assessment been appealed recently, and will the sale trigger a re-assessment?
- What does the HOA fee cover, when was the last increase, and are there any pending special assessments or reserve-fund shortfalls?
- Any open or pending special assessments — roof, HVAC, plumbing, elevator, façade? What's the per-unit balance and payoff schedule, and is the seller paying it off at close or rolling it to the buyer?
- Is there a deadline driving the sale (1031 exchange, divorce, estate, relocation)? That informs how much negotiation room exists.
- Schools are F-rated, which usually means shorter tenancies and higher turnover. Who's the typical renter profile here, and what's been the actual vacancy rate?
- Crime grade is F in this area — have there been break-ins, vandalism, or insurance claims at this property in the last 3 years? What carrier currently insures it and at what premium?
- What's the average days-on-market for RENTAL listings here right now (not sales)? A rising rental-DOM trend means longer vacancies and softer asking-rent achievability than the comps imply.
- What's the recent tenant-quality profile in this submarket — average credit score on applications, eviction rate, late-payment / NSF rate, and stable-employment percentage? A property-management company in the area should have these aggregated.
- How much new apartment / multifamily construction is in the pipeline within 1–3 miles? Heavy new supply (>2% of stock underway) typically softens rents 12–24 months out; light construction supports rent growth.
Investment metrics
- 1% rule
- 1.69% ✓
- Cap rate
- 9.02%
- Cash-on-cash
- 9.74%
- DSCR
- 1.43
- GRM
- 4.9
CMA / ARV
No comps found within radius.
Projected returns pro-forma
-3.0% appreciation · 3.0% rent growth · sell at horizon
- IRR
- -1.4%
- Equity multiple
- 0.95×
- Total profit
- $-1,012
- Equity at exit
- $10,422
- IRR
- 8.6%
- Equity multiple
- 1.66×
- Total profit
- $12,950
- Equity at exit
- $6,044
Cash invested: $19,572 (down + closing). Projections, not guarantees.
Landlord ↔ Tenant lean methodology
- Overall (STATE)
- 43 Moderately Tenant-Leaning
- State Illinois
- 43 Moderately Tenant-Leaning · D+7
- County
- — inherits STATE
- City
- — inherits STATE
ZIP-level market 61615
- Home prices YoY
- -32.2%
- Active inventory
- 130
- Price-to-rent
- 4.9×
Monthly cashflow live
- Estimated rent
- $1,184 high interval (Pro) →
- Mortgage (P&I)
- −$367
- Tax from tax record
- −$146 /mo · $1,752/yr
- Insurance
- −$29
- HOA
- −$235
- Vacancy / Maint / Mgmt
- −$249
- Net cashflow
- $159
Break-even live
Sensitivity live
| Price | -10% $198 | -5% $179 | +0% $159 | +5% $139 | +10% $119 |
|---|---|---|---|---|---|
| Rent | -10% $65 | -5% $112 | +0% $159 | +5% $206 | +10% $252 |
| Rate | -1.0pp $194 | -0.5pp $177 | base $159 | +0.5pp $141 | +1.0pp $122 |
UW: 25.0% down · 7.5% · 30yr · 1.5% tax · 5.0% vac · 8.0% maint · 8.0% mgmt
Financing live
Cash to close
- Down payment
- $17,475
- Closing costs
- $2,097
- Reserves months
- —
- Total cash needed
- —
Loan-product check · same deal, 3 products live
Conventional
25% down · 7.5% · 30yr
- Down + closing
- —
- Monthly P&I
- —
- Monthly cashflow
- —
- DSCR
- —
- Eligible?
- —
Personal DTI + credit; lowest rate.
DSCR
20% down · 8.5% · 30yr
- Down + closing
- —
- Monthly P&I
- —
- Monthly cashflow
- —
- DSCR
- —
- Eligible?
- —
No personal income docs; deal must DSCR.
Hard money
10% down · 12.0% · 12mo
- Down + closing
- —
- Monthly P&I
- —
- Monthly cashflow
- —
- DSCR
- —
- Eligible?
- —
Short-term bridge; refi at stabilization.
Rent comps 18 comps
| Address | Beds | Baths | Sqft | Rent | $/sqft | DOM | Units | Dist |
|---|---|---|---|---|---|---|---|---|
| 2805 W Larchmont Ln Peoria, IL | 1.0–2.0 | 1.0 | 695 | $1,060 | $1.53 | 15d | 3 | 0.36mi |
| 3601 N Kingston Dr Peoria, IL | 2.0 | 2.0 | 1030 | $1,420 | $1.38 | 15d | 3 | 0.40mi |
| 3438 W Villa Rdg Unit A Peoria, IL | 2.0 | 1.5 | 874 | $1,200 | $1.37 | 23d | 1 | 0.77mi |
| 3444 W Dorchester Rdg Peoria, IL | 2.0 | 2.0 | 1089 | $1,275 | $1.17 | 15d | 1 | 0.83mi |
| 3629 N Leroy Ave Unit A Peoria, IL | 2.0 | 1.0 | 1000 | $1,150 | $1.15 | 45d | 1 | 0.84mi |
| 2700 W Forrest Hill Ave Peoria, IL | 2.0 | 1.0 | 850 | $850 | $1.00 | 45d | 1 | 0.90mi |
| 2511 W Wardcliffe Dr Unit H Peoria, IL | 2.0 | 1.0 | 800 | $875 | $1.09 | 45d | 1 | 1.04mi |
| 2920 N Rockwood Dr Apt B Peoria, IL | 2.0 | 1.0 | 800 | $895 | $1.12 | 15d | 1 | 1.05mi |
| 2020 W Glen Ave Peoria, IL | 3.0 | 2.0 | 1320 | $1,700 | $1.29 | 15d | 1 | 1.14mi |
| 1915 W Marlene Ave Unit B Peoria, IL | 2.0 | 1.5 | 1200 | $1,275 | $1.06 | 23d | 1 | 1.15mi |
| 4010 N Brandywine Dr Peoria, IL | 1.0–2.0 | 1.0–2.0 | 797 | $1,082 | $1.36 | 15d | 17 | 1.19mi |
| 2600 N Lavalle Ct Peoria, IL | 1.0–3.0 | 1.0–2.0 | 803 | $1,000 | $1.25 | 15d | 26 | 1.25mi |
| 2610 N Renwood Ave Peoria, IL | 2.0 | 1.0 | 904 | $1,300 | $1.44 | 15d | 1 | 1.34mi |
| 2800 W War Memorial Dr Peoria, IL | 2.0 | 1.5 | 950 | $949 | $1.00 | 15d | 3 | 1.34mi |
| 2315 W Cannes Dr Unit A Peoria, IL | 1.0 | 1.0 | 800 | $799 | $1.00 | 15d | 1 | 1.40mi |
| 2979 W Cannes Dr Peoria, IL | 1.0–2.0 | 1.0–1.5 | 800 | $1,150 | $1.44 | 15d | 1 | 1.41mi |
| 2913 W Cannes Dr Unit C Peoria, IL | 2.0 | 2.0 | 884 | $1,150 | $1.30 | 45d | 1 | 1.42mi |
| 2975 W Cannes Dr Unit 14 Peoria, IL | 1.0 | 1.0 | 850 | $950 | $1.12 | 45d | 1 | 1.43mi |
HOA detail condo
- Monthly dues
- $235 · $2,820/yr
- Likely covers
- cablelandscapingsnow removal
- Assessments
- None detected in remarks — confirm with the listing agent.
Listing history 3 events
-
2026-06-10status $69,900 Pending 1 DOM
-
2026-06-09remarks 518-char remark
-
2026-06-09$69,900 Active 1 DOM
ⓘ Source: listings_history table (triggers on properties + properties_extension) + one-shot
backfill from property_details.listing_events for pre-trigger history.
Tax reassessment forecast IL · Partial reset (capped growth)
- Current annual tax
- $1,752 · $146/mo
- Projected year-2 tax
- $1,752 · $146/mo
- Expected delta
- $0/yr ($0/mo · 0.0%)
ⓘ Screening estimate from a state-policy table — verify with the county assessor before closing.
Climate risk First Street
- Flood 1/10 Low FEMA zone X · 0% chance over 30 yrs
- Wildfire 1/10 Low
- Heat 3/10 Moderate 7 d/yr ≥104°F today · 18 d/yr by 30 yrs out
- Wind 2/10 Low 100% chance of damaging wind over 30 yrs
- Air quality 3/10 Moderate 1 unhealthy d/yr today · 3 by 30 yrs out
Nearby sold comps map
Loading sold comps map…
Walkable amenities ~0.75 mi
Loading nearby amenities…
Taxation est. · year 1
- Rental income
- $14,211
- − Mortgage interest
- −$3,915
- − Property taxes
- −$1,752
- − Insurance
- −$350
- − Repairs & maintenance
- −$1,137
- − Management
- −$1,137
- − HOA
- −$2,820
- − Depreciation
- −$2,033
- Taxable income
- $1,066
- Est. tax owed @ 24.0%
- −$256
- After-tax cash flow
- $1,650/yr
For passive investors: Depreciation is non-cash, so a rental often shows a tax loss while cash-flowing — sheltering income. Rental losses are passive: they offset passive income freely, and up to $25,000/yr can offset ordinary (W-2) income if you actively participate and your MAGI is under $100k (phasing out to $0 by $150k); unused losses carry forward. On sale, claimed depreciation is recaptured at up to 25%, and gains may owe capital-gains tax (a 1031 exchange can defer both). Figures are a year-1 estimate at your 24.0% rate — not tax advice; consult a CPA.
Schools (NCES district)
- District
- Peoria SD 150
- NCES district ID
- 1731230
- Math proficiency
- 11% ▼ -5.00%
- Reading proficiency
- 14% ▼ -4.00%
- Median HH income
- $41,951
- Composite
- 10.92/100
- National rank
- #9751
- State rank
- #554 of 620 in IL
Livability — Peoria
- Score
- 73/100
- State rank
- #270
- US rank
- #5096
Category grades
Schools grade is shown separately in the Schools card above.
Census & demographics
- Census place
- Peoria, IL
- County
- Peoria County · 120,495 people
- City population
- 114,670
- Metro
- Peoria, IL
- Population (ZIP)
- 23,523
- Household income
- $79,817
- Rent vs Own
- Severe rent burden
- 833.0
Population outlook (Peoria County) Hauer SSP2
- Today (2025)
- 183,007 people
- By 2030
- 179,643 · -1.8%
- By 2040
- 171,782 · -6.1%
- By 2050
- 163,508 · -10.7%
- By 2075
- 140,178 · -23.4%
- By 2100
- 114,493 · -37.4%
Race, ethnicity, and origin ACS 2023
- Neighborhood character
- Predominantly White (72%)
- Race & ethnicity
- White 72% Asian 10% Black 8% Hispanic / Latino 7% Two or more races 5%
- Hispanic origin (detail)
- Mexican 5%
- Common ancestry
- Italian 3% Romanian 3% Lithuanian 2%
- Foreign-born
- 13% · China, Canada, Jamaica
- Languages at home
- 83% English-only · Other Indo-European 4% Spanish 4% Chinese 3%
Political lean MEDSL · Peoria
- 2024 margin
- Toss-up / Even · D 51.5% · R 46.9% · Other 1.6%
- 2008→2024 swing
- -9.2pp toward R · 2008: 13.9pp · 2024: 4.7pp
- All cycles
- 2024: D+4.7 2020: D+6.3 2016: D+2.8 2012: D+4.4 2008: D+13.9
Not yet ingested
- Civics
- —
Market trends
- HPI YoY
- ▼ -79.30%
- Current HPI
- 166.9745
- Rent YoY
- —
- Metro
- Peoria, IL
- State GDP YoY
- ▲ 1.59%
- F500 in state
- 60
Industry mix (Fortune 500 HQ in IL)
| Industry | F500 HQs | Revenue |
|---|---|---|
| Insurance | 4 | $201B |
|
||
| Consumer Goods | 4 | $87B |
|
||
| Industrial Machinery | 3 | $64B |
|
||
| Healthcare | 2 | $55B |
|
||
| Retail / Pharmacy | 1 | $148B |
|
||
| Agriculture / Food | 1 | $86B |
|
||
Price history
+39.8% since first listed5 events — show timeline
- 2026-06-08 Listed $69,900 RMLSA as Distributed by MLS Grid
- 2021-01-08 Sold (MLS) $47,000 RMLSA as Distributed by MLS Grid
- 2020-12-17 Listed $47,900 RMLSA as Distributed by MLS Grid
- 2020-11-13 Sold (Public Records) $27,500 Public Records
- 2002-07-02 Sold (Public Records) $50,000 Public Records
Property tax history
+0.6%/yrLatest (2025): $1,752 · +6.4% YoY. Source: county tax records.
Cash-flow waterfall
monthlySold comps — $/sqft
last 12 mo · ≤1 miLoading sold comps…