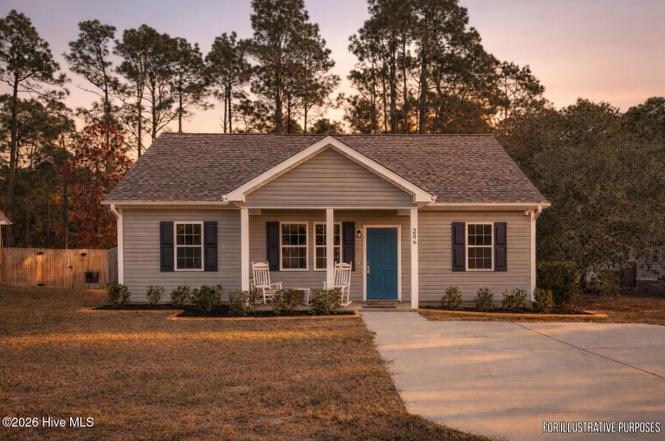
286 Elm St · Boiling Spring Lakes, NC
Flood risk 1/10 · Minimal
- FEMA flood zone
- X (unshaded)
- Chance of flooding over 30 yrs
- 0.0%
- Est. flood insurance / yr
- $507 – $1,088
Fire risk 5/10 · Moderate
- Est. fire insurance / yr
- $906 – $1,684
Heat risk 9/10 · Severe
- Hot days now (above 106°F)
- 7 days/yr
- Hot days in 30 yrs
- 18 days/yr
Wind risk 9/10 · Severe
- Chance of severe wind over 30 yrs
- 99.0%
Air-quality risk 1/10 · Minimal
- Unhealthy air days now
- 0 days/yr
- Unhealthy air days in 30 yrs
- 0 days/yr
Risk factors via First Street. Map © Google.
Why this score? — see what drove the D grade
The composite is a weighted blend of 9 inputs, each scored 0–100. Each bar is that input's sub-score; the figure is the points it added to the 100-point composite (weight × sub-score).
- Cash flow +13.5/30.0
- ARV discount +9.4/15.0
- DSCR +4.1/10.0
- Schools +3.9/10.0
- Livability +3.0/5.0
- 1% rule +2.9/10.0
- Rent growth +2.7/5.0
- Condition / age +2.5/5.0
- Appreciation +0.0/10.0
$257,000
🖨 Deal sheet (PDF) 📄 Offer letter ✓ Due diligence
Listing remarks
Seller Offering $1,500 Buyer Credit with an Acceptable Offer!! Discover comfort and convenience in this well-maintained 3 bedroom, 2 bathroom home located in the Boiling Spring Lakes area of Southport. Offering 1,254 square feet of functional living space, this property features inviting front and back porches perfect for relaxing or entertaining. The fenced-in backyard provides privacy and ample room for pets, play, or outdoor gatherings. With a thoughtful layout and a quiet location just minutes from area amenities, this home presents an excellent opportunity for anyone seeking value and charm in a growing coastal community.
Key facts
- Thoughtful layout
- Quiet location
- Fenced-in backyard
Tags
Property features AI
Exterior
- Parking: Off-street parking
- Utilities: Public water; Septic tank sewer; Water connected
- Home design: Single-family residence; One-story home; Entry level on one level
- Construction: Vinyl siding; Slab foundation; Built with conventional residential construction
- Exterior features: Front porch; Back yard fenced; Shingle roof; Property has a view; Paved road frontage on city street and state road; Lot approximately 0.23 acres (70 x 150)
Interior
- Bathrooms: Two full bathrooms
- Heating & cooling: Central air conditioning; Electric heat and heat pump
- Interior features: Primary bedroom on the main floor; 7 total rooms
Neighborhood map
What this means for you Summary
Snapshot
- This is a 3-bed/2.0-bath single-family listed at $257k.
Deal economics
- At list price, monthly cash flow is $8 ($97/yr) — positive.
- The deal already cash-flows at list — no discount required.
- To meet the 1% rule (rent ≥ 1% of price), the offer needs to be $204k (20.8% below list).
- Recommended offer: $204k (20.8% below list) — sets the bar for 1% rule.
- Cap rate 6.3% vs local median 4.1% in Boiling Spring Lakes — top-decile yield for the area; either an underpriced asset or a hidden risk that comps aren't pricing in. Stress-test before assuming the spread holds.
Location & tenants
- Location reads 59/100 on livability (#542 in NC) — a working-class tenant base; expect higher turnover. Strengths: cost of living A+, housing A+; Watch: employment C-, health & safety D, amenities F.
- Brunswick County Schools (rural): math 45% / reading 47% proficiency, ranked #82 of 178 in NC (top 46%) — families likely to look elsewhere, expect single-tenant / working-renter base with shorter leases.
- Zoned schools: Bolivia Elementary (math 50% / reading 43%, grade D-, #542 of 1,410 statewide, top 39%, 496 students, 99% FRL); South Brunswick Middle (math 41% / reading 49%, grade D, #160 of 475 statewide, top 35%, 572 students, 100% FRL); South Brunswick High (math 62% / reading 57%, grade C+, #216 of 535 statewide, top 43%, 1,172 students, 100% FRL) — zoned schools average 100% FRL vs 53% district-wide (46 pts higher); higher-poverty schools than district average — tighter screening recommended.
- Market conditions: Rents flat; 884 active listings in the ZIP; solid renter incomes; 6,112 units permitted in Brunswick County in 2024 (990 in 5+ unit buildings).
Forward outlook
- Local home prices are declining (-3.0%/yr); year-one equity from $2k of loan paydown is wiped out by about $8k of value loss. Plan a longer hold.
- Brunswick County population projected at +36% by 2050 — long-run rental-demand tailwind backs the buy-and-hold thesis.
Negotiation context
- It's been on market 213 days — a 12% lower offer ($226k) is reasonable based on typical stale-listing flexibility.
Risks & watch-outs
- Climate carrying-cost: severe wind risk, 99% chance of damaging wind over 30y; moderate wildfire risk; extreme-heat days projected 7→18/yr by 2055 (HVAC capex compounding) — expect insurance premiums to compound above CPI over the hold.
Questions for the listing agent
- It's been on market 213 days. Have you received any prior offers? Is the seller open to a 21% concession, seller financing, or rate buy-down credit?
- Why hasn't it sold? Are there any deal-killer items the seller is aware of (foundation, flood, title, zoning, code violations)?
- Is there a deadline driving the sale (1031 exchange, divorce, estate, relocation)? That informs how much negotiation room exists.
- Schools are F-rated, which usually means shorter tenancies and higher turnover. Who's the typical renter profile here, and what's been the actual vacancy rate?
- The area grade is low — what's the realistic commute time and amenity access for the typical tenant pool here? Any planned neighborhood developments (good or bad) we should know about?
- What's the average days-on-market for RENTAL listings here right now (not sales)? A rising rental-DOM trend means longer vacancies and softer asking-rent achievability than the comps imply.
- What's the recent tenant-quality profile in this submarket — average credit score on applications, eviction rate, late-payment / NSF rate, and stable-employment percentage? A property-management company in the area should have these aggregated.
- How much new for-sale + rental construction is in the pipeline within 1–3 miles? Heavy new supply typically softens prices + rents 12–24 months out; constrained supply supports both.
Investment metrics
- 1% rule
- 0.79% ✗
- Cap rate
- 6.33%
- Cash-on-cash
- 0.13%
- DSCR
- 1.01
- GRM
- 10.5
CMA / ARV
- ARV (on-the-fly)
- $268,356
- Comps found
- 12
Show comp detail 12 sales within ~0.75 mi
| Address | Dist | Beds/Ba | Sqft | Sold | Price | $/sf | Match |
|---|---|---|---|---|---|---|---|
| 253 Sycamore Rd | 0.05mi | 3/2.0 | 1,293 (+3%) | 3mo | $304,000 | $235 | 90 |
| 231 Cherry Rd | 0.14mi | 3/2.0 | 1,209 (-4%) | 4mo | $235,000 | $194 | 84 |
| 1469 E Boiling Spring Rd | 0.46mi | 3/2.0 | 1,232 (-2%) | 1mo | $239,000 | $194 | 75 |
| 1830 E Boiling Spring Rd | 0.49mi | 3/2.0 | 1,243 (-1%) | 2mo | $252,500 | $203 | 74 |
| 269 N High Point Rd | 0.51mi | 3/2.0 | 1,254 (0%) | 5mo | $245,000 | $195 | 72 |
| 1820 Raeford Rd | 0.64mi | 3/2.0 | 1,229 (-2%) | 1mo | $296,500 | $241 | 66 |
| 321 Hickory Rd | 0.59mi | 3/2.0 | 1,220 (-3%) | 3mo | $249,400 | $204 | 65 |
| 2240 W Lake Keziah Dr | 0.67mi | 3/2.0 | 1,316 (+5%) | 0mo | $287,000 | $218 | 60 |
| 1911 Gastonia Rd | 0.33mi | 3/2.0 | 1,438 (+15%) | 3mo | $307,500 | $214 | 57 |
| 1955 Albemarle Rd | 0.43mi | 3/2.0 | 1,429 (+14%) | 6mo | $270,000 | $189 | 51 |
| 278 N Greensboro Rd | 0.48mi | 3/2.0 | 1,090 (-13%) | 7mo | $275,000 | $252 | 50 |
| 1960 Salisbury Rd | 0.63mi | 2/2.0 (-1) | 1,104 (-12%) | 2mo | $243,900 | $221 | 44 |
Match score weights: distance 35% · size 25% · config 20% · recency 20%. Top-matched comps best support the ARV.
Projected returns pro-forma
-3.0% appreciation · 0.74% rent growth · sell at horizon
- IRR
- -18.4%
- Equity multiple
- 0.36×
- Total profit
- $-45,736
- Equity at exit
- $38,320
- IRR
- -15.5%
- Equity multiple
- 0.20×
- Total profit
- $-57,230
- Equity at exit
- $22,221
Cash invested: $71,960 (down + closing). Projections, not guarantees.
Landlord ↔ Tenant lean methodology
- Overall (STATE)
- 85 Strongly Landlord-Friendly
- State North Carolina
- 85 Strongly Landlord-Friendly · R+3
- County
- — inherits STATE
- City
- — inherits STATE
ZIP-level market 28461
- Rents YoY
- 0.7%
- Active inventory
- 884
- Price-to-rent
- 10.5×
Monthly cashflow live
- Estimated rent
- $2,035 medium interval (Pro) →
- Mortgage (P&I)
- −$1,348
- Tax from tax record
- −$145 /mo · $1,738/yr
- Insurance
- −$107
- HOA
- −$0
- Vacancy / Maint / Mgmt
- −$427
- Net cashflow
- $8
Break-even live
Sensitivity live
| Price | -10% $154 | -5% $81 | +0% $8 | +5% $-65 | +10% $-137 |
|---|---|---|---|---|---|
| Rent | -10% $-153 | -5% $-72 | +0% $8 | +5% $88 | +10% $169 |
| Rate | -1.0pp $137 | -0.5pp $73 | base $8 | +0.5pp $-59 | +1.0pp $-126 |
UW: 25.0% down · 7.5% · 30yr · 1.5% tax · 5.0% vac · 8.0% maint · 8.0% mgmt
Financing live
Cash to close
- Down payment
- $64,250
- Closing costs
- $7,710
- Reserves months
- —
- Total cash needed
- —
Loan-product check · same deal, 3 products live
Conventional
25% down · 7.5% · 30yr
- Down + closing
- —
- Monthly P&I
- —
- Monthly cashflow
- —
- DSCR
- —
- Eligible?
- —
Personal DTI + credit; lowest rate.
DSCR
20% down · 8.5% · 30yr
- Down + closing
- —
- Monthly P&I
- —
- Monthly cashflow
- —
- DSCR
- —
- Eligible?
- —
No personal income docs; deal must DSCR.
Hard money
10% down · 12.0% · 12mo
- Down + closing
- —
- Monthly P&I
- —
- Monthly cashflow
- —
- DSCR
- —
- Eligible?
- —
Short-term bridge; refi at stabilization.
Listing history 21 events
-
2026-06-22days on market $257,000 Active 213 DOM
-
2026-06-18days on market $257,000 Active 210 DOM
-
2026-06-17days on market $257,000 Active 209 DOM
-
2026-06-16days on market $257,000 Active 208 DOM
-
2026-06-15days on market $257,000 Active 207 DOM
-
2026-06-14days on market $257,000 Active 205 DOM
-
2026-06-13days on market $257,000 Active 204 DOM
-
2026-06-10days on market $257,000 Active 202 DOM
-
2026-06-09days on market $257,000 Active 201 DOM
-
2026-06-08days on market $257,000 Active 200 DOM
-
2026-06-07days on market $257,000 Active 199 DOM
-
2026-06-05days on market $257,000 Active 196 DOM
-
2026-06-03days on market $257,000 Active 195 DOM
-
2026-06-02pricedays on market $257,000 Active 194 DOM
-
2026-06-01days on market $260,000 Active 193 DOM
-
2026-05-31days on market $260,000 Active 192 DOM
-
2026-05-30days on market $260,000 Active 191 DOM
-
2026-05-10price $260,000
-
2026-02-23price $263,000
-
2026-01-09price $265,000
-
2025-11-20$269,900 Active
ⓘ Source: listings_history table (triggers on properties + properties_extension) + one-shot
backfill from property_details.listing_events for pre-trigger history.
Tax reassessment forecast NC · Resets to sale price
- Current annual tax
- $1,738 · $145/mo
- Projected year-2 tax
- $2,107 · $176/mo
- Expected delta
- +$369/yr (+$31/mo · 21.2%)
ⓘ Screening estimate from a state-policy table — verify with the county assessor before closing.
Climate risk First Street
- Flood 1/10 Low FEMA zone X (unshaded) · 0% chance over 30 yrs
- Wildfire 5/10 Major
- Heat 9/10 Extreme 7 d/yr ≥106°F today · 18 d/yr by 30 yrs out
- Wind 9/10 Extreme 99% chance of damaging wind over 30 yrs
- Air quality 1/10 Low 0 unhealthy d/yr today · 0 by 30 yrs out
Nearby sold comps map
Loading sold comps map…
Walkable amenities ~0.75 mi
Loading nearby amenities…
Taxation est. · year 1
- Rental income
- $24,421
- − Mortgage interest
- −$14,396
- − Property taxes
- −$1,738
- − Insurance
- −$1,285
- − Repairs & maintenance
- −$1,954
- − Management
- −$1,954
- − Depreciation
- −$7,476
- Taxable loss
- −$4,382
- Est. tax savings @ 24.0%
- +$1,052
- After-tax cash flow
- $1,148/yr
For passive investors: Depreciation is non-cash, so a rental often shows a tax loss while cash-flowing — sheltering income. Rental losses are passive: they offset passive income freely, and up to $25,000/yr can offset ordinary (W-2) income if you actively participate and your MAGI is under $100k (phasing out to $0 by $150k); unused losses carry forward. On sale, claimed depreciation is recaptured at up to 25%, and gains may owe capital-gains tax (a 1031 exchange can defer both). Figures are a year-1 estimate at your 24.0% rate — not tax advice; consult a CPA.
Schools (NCES district)
- District
- Brunswick County Schools
- NCES district ID
- 3700420
- Math proficiency
- 45% ▲ 4.00%
- Reading proficiency
- 47% ▲ 4.00%
- Median HH income
- $47,494
- Composite
- 39.23/100
- National rank
- #4011
- State rank
- #82 of 178 in NC
Livability — Boiling Spring Lakes
- Score
- 59/100
- State rank
- #542
- US rank
- #19781
Category grades
Schools grade is shown separately in the Schools card above.
Census & demographics
- Census place
- Boiling Spring Lakes, NC
- County
- Brunswick County · 131,536 people
- Metro
- Myrtle Beach-Conway-North Myrtle Beach, SC-NC
- Population (ZIP)
- 23,762
- Household income
- $82,692
- Rent vs Own
- Severe rent burden
- 161.0
Population outlook (Brunswick County) Hauer SSP2
- Today (2025)
- 152,111 people
- By 2030
- 165,705 · +8.9%
- By 2040
- 188,494 · +23.9%
- By 2050
- 206,228 · +35.6%
- By 2075
- 237,876 · +56.4%
- By 2100
- 251,451 · +65.3%
Race, ethnicity, and origin ACS 2023
- Neighborhood character
- Predominantly White (89%)
- Race & ethnicity
- White 89% Two or more races 6% Black 4% Hispanic / Latino 3%
- Common ancestry
- Romanian 4% Slovak 3% Serbian 3%
- Foreign-born
- 3% · Canada
- Languages at home
- 96% English-only · Spanish 2%
Political lean MEDSL · Brunswick
- 2024 margin
- Strong R (+24.9) · D 37.2% · R 62.0%
- 2008→2024 swing
- -6.9pp toward R · 2008: -17.9pp · 2024: -24.9pp
- All cycles
- 2024: R+24.9 2020: R+25.0 2016: R+28.7 2012: R+22.2 2008: R+17.9
Not yet ingested
- Civics
- —
Market trends
- HPI YoY
- ▼ -195.19%
- Current HPI
- 142.5667
- Rent YoY
- ▲ 0.74%
- Metro
- Myrtle Beach-Conway-North Myrtle Beach, SC-NC
- State GDP YoY
- ▲ 3.28%
- F500 in state
- 26
Industry mix (Fortune 500 HQ in NC)
| Industry | F500 HQs | Revenue |
|---|---|---|
| Financial Services | 2 | $213B |
|
||
| Retail | 2 | $95B |
|
||
| Industrial Conglomerate | 1 | $38B |
|
||
| Metals / Steel | 1 | $35B |
|
||
| Utilities | 1 | $30B |
|
||
| Industrial Machinery | 1 | $19B |
|
||
Price history
-3.7% since first listed4 events — show timeline
- 2026-05-10 Price Changed $260,000 Hive MLS
- 2026-02-23 Price Changed $263,000 Hive MLS
- 2026-01-09 Price Changed $265,000 Hive MLS
- 2025-11-20 Listed $269,900 Hive MLS
Property tax history
+46.5%/yrLatest (2025): $1,738 · +13.1% YoY. Source: county tax records.
Cash-flow waterfall
monthlySold comps — $/sqft
last 12 mo · ≤1 miLoading sold comps…