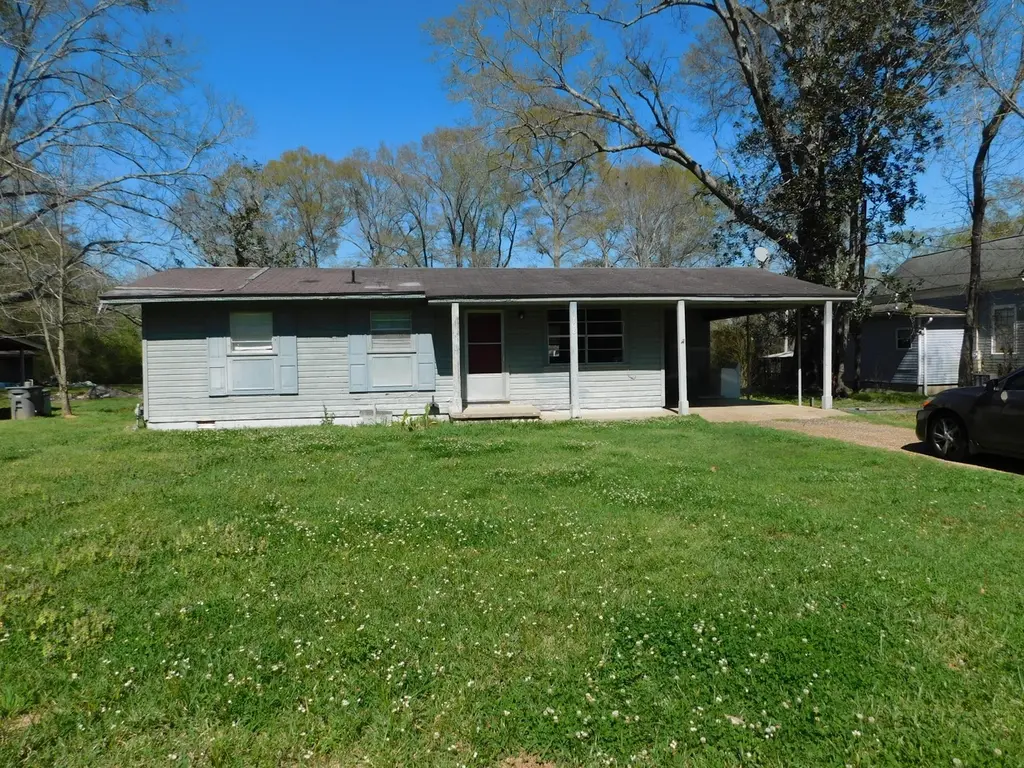
108 Bluff St · Mount Olive, MS
Flood risk 1/10 · Minimal
- FEMA flood zone
- X (unshaded)
- Chance of flooding over 30 yrs
- 0.0%
- Est. flood insurance / yr
- $507 – $1,088
Fire risk 5/10 · Moderate
- Est. fire insurance / yr
- $1,241 – $2,305
Heat risk 7/10 · Major
- Hot days now (above 108°F)
- 7 days/yr
- Hot days in 30 yrs
- 20 days/yr
Wind risk 8/10 · Major
- Chance of severe wind over 30 yrs
- 91.0%
Air-quality risk 1/10 · Minimal
- Unhealthy air days now
- 0 days/yr
- Unhealthy air days in 30 yrs
- 0 days/yr
Risk factors via First Street. Map © Google.
Why this score? — see what drove the B grade
The composite is a weighted blend of 9 inputs, each scored 0–100. Each bar is that input's sub-score; the figure is the points it added to the 100-point composite (weight × sub-score).
- Cash flow +29.6/30.0
- DSCR +10.0/10.0
- Appreciation +8.8/10.0
- 1% rule +8.3/10.0
- ARV discount +7.5/15.0
- Livability +3.3/5.0
- Rent growth +2.5/5.0
- Schools +2.2/10.0
- Condition / age +2.2/5.0
$65,000
🖨 Deal sheet (PDF) 📄 Offer letter ✓ Due diligence
Listing remarks
Charming investment opportunity located in a quiet neighborhood near Main Street in Mt. Olive. This 2-bedroom, 1-bath home offers great potential for investors or buyers looking to customize a property to their liking. Features include a one-car carport, wood siding, and access to public water and sewer provided by the town of Mt. Olive. The property is uniquely situated, bordered by Okatoma Creek to the north and east and Highway 49 to the south and west, offering both convenience and natural surroundings. Property is being sold 'as is, where is. ' Priced at $65,000--don't miss this affordable opportunity!
Key facts
- Wood siding
- Quiet neighborhood
- One-car carport
Tags
Property features AI
Exterior
- Parking: Attached carport; 1 carport space; Driveway
- Utilities: Public water; Public sewer
- Home design: Single-family residence; One story; Raised foundation
- Construction: Wood siding; Composition roof
- Exterior features: Storage; Covered front porch
Interior
- Flooring: Wood flooring; Vinyl flooring; Laminate flooring
- Bathrooms: 1 full bathroom
- Heating & cooling: Window unit(s) for cooling
- Interior features: Ceiling fan(s); 6 total rooms
Neighborhood map
What this means for you Summary
Snapshot
- This is a 2-bed/1.0-bath single-family listed at $65k. Condition is rated fair.
Deal economics
- At list price, monthly cash flow is $234 ($3k/yr) — positive.
- The deal already cash-flows at list — no discount required.
- Meets the 1% rule at list price ($865 rent vs $65k).
- Recommended offer: $59k (9.0% below list) — sets the bar for market timing.
Location & tenants
- Location reads 66/100 on livability (#93 in MS) — a middle-class / working-renter tenant base. Strengths: crime A+, cost of living A+, housing A+; Watch: health & safety D, schools F, amenities F.
- Covington County School District (rural): math 26% / reading 28% proficiency, ranked #78 of 130 in MS (top 60%) — low school quality limits family demand, transient renter base, plan for 1-2y turnover; 74% free/reduced lunch — lower-income household profile, screen leases tightly.
- Market conditions: 27 active listings in the ZIP.
Forward outlook
- In year one you build about $5k of equity ($449 loan paydown + $5k appreciation (7.6% local appreciation)).
- Covington County population projected at -15% by 2050 — secular population decline; favor cash flow + early exit over multi-decade hold.
- At projected returns (7.6% appreciation + 3.0% rent growth), your $18k cash investment doubles in ~3 years — after that, you're playing with house money.
- By year 6, paydown + projected appreciation supports a ~$30k cash-out refi (75% LTV) — recoverable capital for the next deal without selling this one.
Negotiation context
- It's been on market 93 days — a 9% lower offer ($59k) is reasonable based on typical stale-listing flexibility.
Risks & watch-outs
- Climate carrying-cost: severe wind risk, 91% chance of damaging wind over 30y; moderate wildfire risk; extreme-heat days projected 7→20/yr by 2055 (HVAC capex compounding) — expect insurance premiums to compound above CPI over the hold.
Questions for the listing agent
- It's been on market 93 days. Have you received any prior offers? Is the seller open to a 9% concession, seller financing, or rate buy-down credit?
- Have any recent inspections been done? Can we get a copy of the seller's disclosures and any deferred-maintenance estimates?
- Built in 1975 — when were the roof, HVAC, electrical panel, plumbing, and water heater last replaced?
- Why hasn't it sold? Are there any deal-killer items the seller is aware of (foundation, flood, title, zoning, code violations)?
- Is there a deadline driving the sale (1031 exchange, divorce, estate, relocation)? That informs how much negotiation room exists.
- Schools are F-rated, which usually means shorter tenancies and higher turnover. Who's the typical renter profile here, and what's been the actual vacancy rate?
- What's the average days-on-market for RENTAL listings here right now (not sales)? A rising rental-DOM trend means longer vacancies and softer asking-rent achievability than the comps imply.
- What's the recent tenant-quality profile in this submarket — average credit score on applications, eviction rate, late-payment / NSF rate, and stable-employment percentage? A property-management company in the area should have these aggregated.
- How much new for-sale + rental construction is in the pipeline within 1–3 miles? Heavy new supply typically softens prices + rents 12–24 months out; constrained supply supports both.
Investment metrics
- 1% rule
- 1.33% ✓
- Cap rate
- 10.62%
- Cash-on-cash
- 15.45%
- DSCR
- 1.69
- GRM
- 6.3
CMA / ARV
No comps found within radius.
Projected returns pro-forma
7.57% appreciation · 3.0% rent growth · sell at horizon
- IRR
- 31.3%
- Equity multiple
- 3.19×
- Total profit
- $39,921
- Equity at exit
- $47,480
- IRR
- 28.1%
- Equity multiple
- 6.76×
- Total profit
- $104,753
- Equity at exit
- $92,489
Cash invested: $18,200 (down + closing). Projections, not guarantees.
Landlord ↔ Tenant lean methodology
- Overall (STATE)
- 90 Strongly Landlord-Friendly
- State Mississippi
- 90 Strongly Landlord-Friendly · R+11
- County
- — inherits STATE
- City
- — inherits STATE
ZIP-level market 39119
- Home prices YoY
- 5.3%
- Active inventory
- 27
- Price-to-rent
- 6.3×
Monthly cashflow live
- Estimated rent
- $865 medium interval (Pro) →
- Mortgage (P&I)
- −$341
- Tax est. 1.5%
- −$81 /mo · $975/yr
- Insurance
- −$27
- HOA
- −$0
- Vacancy / Maint / Mgmt
- −$182
- Net cashflow
- $234
Break-even live
Sensitivity live
| Price | -10% $279 | -5% $257 | +0% $234 | +5% $212 | +10% $189 |
|---|---|---|---|---|---|
| Rent | -10% $166 | -5% $200 | +0% $234 | +5% $268 | +10% $303 |
| Rate | -1.0pp $267 | -0.5pp $251 | base $234 | +0.5pp $217 | +1.0pp $200 |
UW: 25.0% down · 7.5% · 30yr · 1.5% tax · 5.0% vac · 8.0% maint · 8.0% mgmt
Financing live
Cash to close
- Down payment
- $16,250
- Closing costs
- $1,950
- Reserves months
- —
- Total cash needed
- —
Loan-product check · same deal, 3 products live
Conventional
25% down · 7.5% · 30yr
- Down + closing
- —
- Monthly P&I
- —
- Monthly cashflow
- —
- DSCR
- —
- Eligible?
- —
Personal DTI + credit; lowest rate.
DSCR
20% down · 8.5% · 30yr
- Down + closing
- —
- Monthly P&I
- —
- Monthly cashflow
- —
- DSCR
- —
- Eligible?
- —
No personal income docs; deal must DSCR.
Hard money
10% down · 12.0% · 12mo
- Down + closing
- —
- Monthly P&I
- —
- Monthly cashflow
- —
- DSCR
- —
- Eligible?
- —
Short-term bridge; refi at stabilization.
Listing history 18 events
-
2026-06-19days on market $65,000 Active 93 DOM
-
2026-06-18days on market $65,000 Active 92 DOM
-
2026-06-17days on market $65,000 Active 91 DOM
-
2026-06-16days on market $65,000 Active 90 DOM
-
2026-06-15days on market $65,000 Active 89 DOM
-
2026-06-14days on market $65,000 Active 87 DOM
-
2026-06-13days on market $65,000 Active 86 DOM
-
2026-06-10days on market $65,000 Active 84 DOM
-
2026-06-09days on market $65,000 Active 83 DOM
-
2026-06-08days on market $65,000 Active 82 DOM
-
2026-06-07days on market $65,000 Active 81 DOM
-
2026-06-05days on market $65,000 Active 78 DOM
-
2026-06-03days on market $65,000 Active 77 DOM
-
2026-06-02days on market $65,000 Active 76 DOM
-
2026-06-01days on market $65,000 Active 75 DOM
-
2026-05-31days on market $65,000 Active 74 DOM
-
2026-05-30days on market $65,000 Active 73 DOM
-
2026-03-18$65,000 Active
ⓘ Source: listings_history table (triggers on properties + properties_extension) + one-shot
backfill from property_details.listing_events for pre-trigger history.
Climate risk First Street
- Flood 1/10 Low FEMA zone X (unshaded) · 0% chance over 30 yrs
- Wildfire 5/10 Major
- Heat 7/10 Severe 7 d/yr ≥108°F today · 20 d/yr by 30 yrs out
- Wind 8/10 Severe 91% chance of damaging wind over 30 yrs
- Air quality 1/10 Low 0 unhealthy d/yr today · 0 by 30 yrs out
Nearby sold comps map
Loading sold comps map…
Walkable amenities ~0.75 mi
Loading nearby amenities…
Taxation est. · year 1
- Rental income
- $10,382
- − Mortgage interest
- −$3,641
- − Property taxes
- −$975
- − Insurance
- −$325
- − Repairs & maintenance
- −$831
- − Management
- −$831
- − Depreciation
- −$1,891
- Taxable income
- $1,889
- Est. tax owed @ 24.0%
- −$453
- After-tax cash flow
- $2,358/yr
For passive investors: Depreciation is non-cash, so a rental often shows a tax loss while cash-flowing — sheltering income. Rental losses are passive: they offset passive income freely, and up to $25,000/yr can offset ordinary (W-2) income if you actively participate and your MAGI is under $100k (phasing out to $0 by $150k); unused losses carry forward. On sale, claimed depreciation is recaptured at up to 25%, and gains may owe capital-gains tax (a 1031 exchange can defer both). Figures are a year-1 estimate at your 24.0% rate — not tax advice; consult a CPA.
Condition & rehab AI · 12 photos
This 2-bedroom, 1-bath home requires moderate renovations to improve its condition and increase its value. Key areas for improvement include the kitchen and bathroom, which are in poor condition, and the exterior, which shows some wear. Fresh paint and HVAC maintenance would also significantly enhance the property's appeal.
Repairs flagged
- Major kitchen cabinets — severe peeling and damage
- Major kitchen wallpaper — severe peeling and damage
- Major bathroom tile — dated and worn
- Moderate exterior siding — visible wear
Value-add opportunities
- Both kitchen renovation — modernizing the kitchen would significantly increase both resale and rental value
- Both bathroom renovation — updating the bathroom would also boost both resale and rental value
- Both exterior paint — fresh paint would improve curb appeal and value
- Both HVAC maintenance — clean and efficient HVAC systems are crucial for both comfort and energy efficiency
Renovation cost estimate screening
| Repair item | Severity | Est. cost |
|---|---|---|
| kitchen cabinets · severe peeling and damage | Major | $15,000–50,000 |
| kitchen wallpaper · severe peeling and damage | Major | $15,000–50,000 |
| bathroom tile · dated and worn | Major | $15,000–50,000 |
| exterior siding · visible wear | Moderate | $3,000–15,000 |
| Total estimated repair cost · 4 items | $48,000–165,000 |
Value-add ROI direction
- Both kitchen renovation — modernizing the kitchen would significantly increase both resale and rental value ↑
- Both bathroom renovation — updating the bathroom would also boost both resale and rental value ↑
- Both exterior paint — fresh paint would improve curb appeal and value ↑
- Both HVAC maintenance — clean and efficient HVAC systems are crucial for both comfort and energy efficiency ↑
ⓘ Cost ranges are severity-bucket heuristics (US national rule-of-thumb). Get contractor quotes + a written scope before underwriting a rehab budget.
Schools (NCES district)
- District
- Covington County School District
- NCES district ID
- 2801290
- Math proficiency
- 26% ▼ -7.00%
- Reading proficiency
- 28% ▼ -4.00%
- Median HH income
- $33,020
- Composite
- 22.09/100
- National rank
- #8183
- State rank
- #78 of 130 in MS
Livability — Mount Olive
- Score
- 66/100
- State rank
- #93
- US rank
- #11501
Category grades
Schools grade is shown separately in the Schools card above.
Census & demographics
- Census place
- Mount Olive, MS
- Population (ZIP)
- 6,199
Population outlook (Covington County) Hauer SSP2
- Today (2025)
- 19,294 people
- By 2030
- 18,875 · -2.2%
- By 2040
- 17,777 · -7.9%
- By 2050
- 16,381 · -15.1%
- By 2075
- 12,704 · -34.2%
- By 2100
- 9,090 · -52.9%
Race, ethnicity, and origin ACS 2023
- Neighborhood character
- Majority Black (50%)
- Race & ethnicity
- Black 50% White 46% Two or more races 2% Hispanic / Latino 2%
- Common ancestry
- Serbian 4% Italian 1% Slovak 1%
- Foreign-born
- 0%
- Languages at home
- 99% English-only · Spanish 1%
Political lean MEDSL · Covington
- 2024 margin
- Solid R (+33.3) · D 33.0% · R 66.2%
- 2008→2024 swing
- -15.6pp toward R · 2008: -17.7pp · 2024: -33.3pp
- All cycles
- 2024: R+33.3 2020: R+26.0 2016: R+24.5 2012: R+16.2 2008: R+17.7
Not yet ingested
- Civics
- —
Market trends
- HPI YoY
- ▲ 7.57%
- Current HPI
- 150.7147
- Rent YoY
- —
- Metro
- —
- State GDP YoY
- —
- F500 in state
- 0
Price history
1 event — show timeline
- 2026-03-18 Listed $65,000 HAAR
Cash-flow waterfall
monthlySold comps — $/sqft
last 12 mo · ≤1 miLoading sold comps…