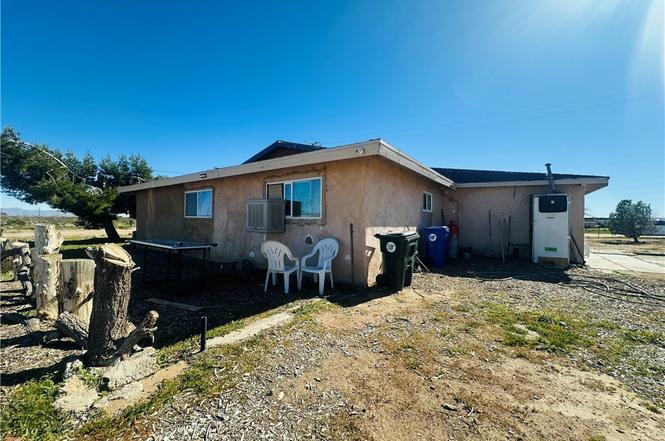
15026 Richmond · Victorville, CA
Flood risk 1/10 · Minimal
- FEMA flood zone
- X (unshaded)
- Chance of flooding over 30 yrs
- 0.0%
- Est. flood insurance / yr
- $507 – $1,088
Fire risk 5/10 · Moderate
- Est. fire insurance / yr
- $659 – $1,223
Heat risk 7/10 · Major
- Hot days now (above 97°F)
- 7 days/yr
- Hot days in 30 yrs
- 18 days/yr
Wind risk 1/10 · Minimal
- Chance of severe wind over 30 yrs
- —
Air-quality risk 8/10 · Major
- Unhealthy air days now
- 18 days/yr
- Unhealthy air days in 30 yrs
- 23 days/yr
Risk factors via First Street. Map © Google.
Why this score? — see what drove the D+ grade
The composite is a weighted blend of 9 inputs, each scored 0–100. Each bar is that input's sub-score; the figure is the points it added to the 100-point composite (weight × sub-score).
- Cash flow +13.1/30.0
- ARV discount +11.2/15.0
- Rent growth +4.1/5.0
- DSCR +3.9/10.0
- 1% rule +3.2/10.0
- Livability +2.7/5.0
- Condition / age +2.5/5.0
- Appreciation +2.4/10.0
- Schools +2.2/10.0
$325,000
🖨 Deal sheet 📄 Offer letter ✓ Due diligence
Listing remarks MLS
Needs some TLC but has potential. Wood burning stove in living room; ceiling fan; has small room off of dining which can be a small family room or office; above ground pool with work on the deck will be great for the hot summer days. A little over 2 acres just a block off of Hwy 395. Will not go FHA, but owner will carry depending on offer.
Key facts
- 2.03 acre lot
- Built 1962
- Listed 106 days
Property features AI
Finance
- Other: Parcel number 3135341150000
- HOA & community: Rural community
Exterior
- Utilities: Well water; Septic (type unknown)
- Home design: Single-story house; No accessory dwelling unit
- Construction: Year built (per assessor); No common walls
- Exterior features: House; No pool
Interior
- Bedrooms: 3 bedrooms on the main level
- Bathrooms: 1 full bathroom
- Heating & cooling: Wall/window cooling
- Interior features: Main entrance; One-level home; All bedrooms on the main level; Main level has 3 bedrooms and 1 bathroom
- Laundry & utility: Indoor laundry
Neighborhood map
What this means for you Summary
Snapshot
- This is a 3-bed/1.0-bath single-family listed at $325k.
Deal economics
- At list price, monthly cash flow is $-10 ($-117/yr) — negative.
- To cash-flow at today's rent, offer at most $323k (0.5% below list).
- To meet the 1% rule (rent ≥ 1% of price), the offer needs to be $266k (18.2% below list).
- Recommended offer: $266k (18.2% below list) — sets the bar for 1% rule.
- Cap rate 6.3% vs local median 4.2% in Victorville — top-decile yield for the area; either an underpriced asset or a hidden risk that comps aren't pricing in. Stress-test before assuming the spread holds.
Location & tenants
- Location reads 54/100 on livability (#906 in CA) — a working-class tenant base; expect higher turnover. Strengths: housing A+; Watch: employment D+, schools D-, crime F.
- Victor Valley Union High (urban): math 25% / reading 25% proficiency, ranked #407 of 517 in CA (top 79%) — low school quality limits family demand, transient renter base, plan for 1-2y turnover; 72% free/reduced lunch — lower-income household profile, screen leases tightly.
- Market conditions: Rents rising fast (+6.5%/yr); 166 active listings in the ZIP; 2 comparable units currently listed for rent nearby; solid renter incomes; 5,458 units permitted in San Bernardino County in 2024 (1,500 in 5+ unit buildings).
- This rent runs 41% of the median local income ($78k/yr) — at the standard rent-burdened threshold; future hikes will face affordability resistance.
Forward outlook
- Local home prices are declining (-3.0%/yr); year-one equity from $2k of loan paydown is wiped out by about $10k of value loss. Plan a longer hold.
- San Bernardino County population projected at +15% by 2050 — modest demand growth; plan on rents tracking national, not racing it.
Negotiation context
- It's been on market 106 days — a 9% lower offer ($296k) is reasonable based on typical stale-listing flexibility.
- 2 sale attempts since 2y ago; this cycle's ask has dropped $27k (8%) from the opening price — seller is motivated, your offer sets the floor, not the list.
- Current owner paid $260k; 25% above their basis — modest negotiation headroom, anchor on the comps not their cost.
Risks & watch-outs
- Climate carrying-cost: moderate wildfire risk; extreme-heat days projected 7→18/yr by 2055 (HVAC capex compounding) — expect insurance premiums to compound above CPI over the hold.
Questions for the listing agent
- What do current leases actually rent for vs. the listed asking? Can we see a recent rent roll and the last 12 months of T-12 income?
- It's been on market 106 days. Have you received any prior offers? Is the seller open to a 18% concession, seller financing, or rate buy-down credit?
- Built in 1962 — when were the roof, HVAC, electrical panel, plumbing, and water heater last replaced?
- Why hasn't it sold? Are there any deal-killer items the seller is aware of (foundation, flood, title, zoning, code violations)?
- Is there a deadline driving the sale (1031 exchange, divorce, estate, relocation)? That informs how much negotiation room exists.
- Schools are D-rated, which usually means shorter tenancies and higher turnover. Who's the typical renter profile here, and what's been the actual vacancy rate?
- Crime grade is F in this area — have there been break-ins, vandalism, or insurance claims at this property in the last 3 years? What carrier currently insures it and at what premium?
- The area grade is low — what's the realistic commute time and amenity access for the typical tenant pool here? Any planned neighborhood developments (good or bad) we should know about?
- What's the average days-on-market for RENTAL listings here right now (not sales)? A rising rental-DOM trend means longer vacancies and softer asking-rent achievability than the comps imply.
- What's the recent tenant-quality profile in this submarket — average credit score on applications, eviction rate, late-payment / NSF rate, and stable-employment percentage? A property-management company in the area should have these aggregated.
- How much new for-sale + rental construction is in the pipeline within 1–3 miles? Heavy new supply typically softens prices + rents 12–24 months out; constrained supply supports both.
Investment metrics
- 1% rule
- 0.82% ✗
- Cap rate
- 6.26%
- Cash-on-cash
- -0.13%
- DSCR
- 0.99
- GRM
- 10.2
CMA / ARV
- ARV (on-the-fly)
- $354,510
- Comps found
- 12
Show comp detail 12 sales within ~0.75 mi
| Address | Dist | Beds/Ba | Sqft | Sold | Price | $/sf | Match |
|---|---|---|---|---|---|---|---|
| 15074 Richmond Ave | 0.05mi | 3/1.0 | 1,170 (0%) | 12mo | $265,000 | $226 | 88 |
| 15024 Carrolton St | 0.54mi | 3/2.0 | 1,110 (-5%) | 1mo | $371,000 | $334 | 61 |
| 11735 Star | 0.57mi | 3/2.0 | 1,110 (-5%) | 1mo | $385,000 | $347 | 60 |
| 11791 Wolcott St | 0.51mi | 3/2.0 | 1,110 (-5%) | 19mo | $375,000 | $338 | 48 |
| 11882 Star St | 0.40mi | 3/2.0 | 1,338 (+14%) | 7mo | $400,000 | $299 | 47 |
| 11755 Star St | 0.54mi | 3/2.0 | 1,110 (-5%) | 19mo | $378,000 | $341 | 46 |
| 11850 Star St | 0.44mi | 3/2.0 | 1,338 (+14%) | 12mo | $405,000 | $303 | 42 |
| 11800 wolcott | 0.51mi | 4/2.0 (+1) | 1,338 (+14%) | 7mo | $390,000 | $291 | 38 |
| 11721 Virginia | 0.59mi | 4/2.0 (+1) | 1,338 (+14%) | 3mo | $400,000 | $299 | 37 |
| 11836 Stockton St | 0.47mi | 4/2.0 (+1) | 1,338 (+14%) | 13mo | $395,000 | $295 | 34 |
| 11745 Stockton St | 0.57mi | 4/2.0 (+1) | 1,338 (+14%) | 11mo | $400,000 | $299 | 31 |
| 11806 STAR St | 0.49mi | 4/2.0 (+1) | 1,338 (+14%) | 16mo | $420,000 | $314 | 30 |
Match score weights: distance 35% · size 25% · config 20% · recency 20%. Top-matched comps best support the ARV.
Projected returns pro-forma
-3.0% appreciation · 6.46% rent growth · sell at horizon
- IRR
- -12.9%
- Equity multiple
- 0.52×
- Total profit
- $-43,751
- Equity at exit
- $48,459
- IRR
- 0.4%
- Equity multiple
- 1.03×
- Total profit
- $3,119
- Equity at exit
- $28,100
Cash invested: $91,000 (down + closing). Projections, not guarantees.
Landlord ↔ Tenant lean methodology
- Overall (STATE)
- 18 Strongly Tenant-Friendly
- State California
- 18 Strongly Tenant-Friendly · D+13
- County
- — inherits STATE
- City
- — inherits STATE
ZIP-level market 92394
- Home prices YoY
- -1.3%
- Rents YoY
- 6.5%
- Active inventory
- 166
- Price-to-rent
- 10.2×
Monthly cashflow live
- Estimated rent
- $2,658 medium interval (Pro) →
- Mortgage (P&I)
- −$1,704
- Tax from tax record
- −$270 /mo · $3,239/yr
- Insurance
- −$135
- HOA
- −$0
- Vacancy / Maint / Mgmt
- −$558
- Net cashflow
- $-10
Break-even live
UW: 25.0% down · 7.5% · 30yr · 1.5% tax · 5.0% vac · 8.0% maint · 8.0% mgmt
Financing live
Cash to close
- Down payment
- $81,250
- Closing costs
- $9,750
- Reserves months
- —
- Total cash needed
- —
Loan-product check · same deal, 3 products live
Conventional
25% down · 7.5% · 30yr
- Down + closing
- —
- Monthly P&I
- —
- Monthly cashflow
- —
- DSCR
- —
- Eligible?
- —
Personal DTI + credit; lowest rate.
DSCR
20% down · 8.5% · 30yr
- Down + closing
- —
- Monthly P&I
- —
- Monthly cashflow
- —
- DSCR
- —
- Eligible?
- —
No personal income docs; deal must DSCR.
Hard money
10% down · 12.0% · 12mo
- Down + closing
- —
- Monthly P&I
- —
- Monthly cashflow
- —
- DSCR
- —
- Eligible?
- —
Short-term bridge; refi at stabilization.
Rent comps 2 comps
| Address | Beds | Baths | Sqft | Rent | $/sqft | DOM | Units | Dist |
|---|---|---|---|---|---|---|---|---|
| 14513 Palm St Adelanto, CA | 3.0 | 2.0 | 1500 | $2,300 | $1.53 | 1d | 1 | 1.14mi |
| 11028 Pemberton Way Adelanto, CA | 3.0 | 2.0 | 1126 | $2,000 | $1.78 | 1d | 1 | 1.45mi |
Listing history 23 events
-
2026-06-18days on market $325,000 Active 106 DOM
-
2026-06-17days on market $325,000 Active 105 DOM
-
2026-06-16days on market $325,000 Active 104 DOM
-
2026-06-15days on market $325,000 Active 103 DOM
-
2026-06-13days on market $325,000 Active 101 DOM
-
2026-06-09days on market $325,000 Active 97 DOM
-
2026-06-08days on market $325,000 Active 96 DOM
-
2026-06-07days on market $325,000 Active 95 DOM
-
2026-06-04days on market $325,000 Active 92 DOM
-
2026-06-03days on market $325,000 Active 91 DOM
-
2026-06-02days on market $325,000 Active 90 DOM
-
2026-06-01days on market $325,000 Active 89 DOM
-
2026-05-31days on market $325,000 Active 88 DOM
-
2026-05-15price $325,000
-
2026-03-04$352,000 Active
-
2026-02-14historical $352,000
-
2024-12-30historical
-
2024-11-23price $374,999
-
2024-10-22price $399,900
-
2024-09-28$420,000 Active
-
2024-05-06soldstatus $260,000
-
2003-02-21soldstatus $80,000 343-char remark
Show marketing remark (343 chars)
Needs some TLC but has potential. Wood burning stove in living room; ceiling fan; has small room off of dining which can be a small family room or office; above ground pool with work on the deck will be great for the hot summer days. A little over 2 acres just a block off of Hwy 395. Will not go FHA, but owner will carry depending on offer.
-
2003-02-21soldstatus $80,000
Show marketing remark (343 chars)
Needs some TLC but has potential. Wood burning stove in living room; ceiling fan; has small room off of dining which can be a small family room or office; above ground pool with work on the deck will be great for the hot summer days. A little over 2 acres just a block off of Hwy 395. Will not go FHA, but owner will carry depending on offer.
ⓘ Source: listings_history table (triggers on properties + properties_extension) + one-shot
backfill from property_details.listing_events for pre-trigger history.
Tax reassessment forecast CA · Resets to sale price
- Current annual tax
- $3,239 · $270/mo
- Projected year-2 tax
- $3,239 · $270/mo
- Expected delta
- $0/yr ($0/mo · 0.0%)
ⓘ Screening estimate from a state-policy table — verify with the county assessor before closing.
Climate risk First Street
- Flood 1/10 Low FEMA zone X (unshaded) · 0% chance over 30 yrs
- Wildfire 5/10 Major
- Heat 7/10 Severe 7 d/yr ≥97°F today · 18 d/yr by 30 yrs out
- Wind 1/10 Low
- Air quality 8/10 Severe 18 unhealthy d/yr today · 23 by 30 yrs out
Nearby sold comps map
Loading sold comps map…
Walkable amenities ~0.75 mi
Loading nearby amenities…
Taxation est. · year 1
- Rental income
- $31,898
- − Mortgage interest
- −$18,205
- − Property taxes
- −$3,239
- − Insurance
- −$1,625
- − Repairs & maintenance
- −$2,552
- − Management
- −$2,552
- − Depreciation
- −$9,455
- Taxable loss
- −$5,729
- Est. tax savings @ 24.0%
- +$1,375
- After-tax cash flow
- $1,258/yr
For passive investors: Depreciation is non-cash, so a rental often shows a tax loss while cash-flowing — sheltering income. Rental losses are passive: they offset passive income freely, and up to $25,000/yr can offset ordinary (W-2) income if you actively participate and your MAGI is under $100k (phasing out to $0 by $150k); unused losses carry forward. On sale, claimed depreciation is recaptured at up to 25%, and gains may owe capital-gains tax (a 1031 exchange can defer both). Figures are a year-1 estimate at your 24.0% rate — not tax advice; consult a CPA.
Schools (NCES district)
- District
- Victor Valley Union High
- NCES district ID
- 0636972
- Math proficiency
- 25% ▲ 6.00%
- Reading proficiency
- 25% ▼ -12.00%
- Median HH income
- $45,112
- Composite
- 21.6/100
- National rank
- #8296
- State rank
- #407 of 517 in CA
Livability — Victorville
- Score
- 54/100
- State rank
- #906
- US rank
- #24038
Category grades
Schools grade is shown separately in the Schools card above.
Census & demographics
- Census place
- Victorville, CA
- County
- San Bernardino County · 2,030,291 people
- City population
- 154,418
- Metro
- Riverside-San Bernardino-Ontario, CA
- Population (ZIP)
- 41,614
- Household income
- $78,466
- Rent vs Own
- Severe rent burden
- 1485.0
Population outlook (San Bernardino County) Hauer SSP2
- Today (2025)
- 2,300,329 people
- By 2030
- 2,378,907 · +3.4%
- By 2040
- 2,523,137 · +9.7%
- By 2050
- 2,642,388 · +14.9%
- By 2075
- 2,880,769 · +25.2%
- By 2100
- 2,909,436 · +26.5%
Race, ethnicity, and origin ACS 2023
- Neighborhood character
- Diverse neighborhood (Simpson 0.61)
- Race & ethnicity
- Hispanic / Latino 57% Two or more races 24% Black 20% White 15% Asian 4% Native American 2%
- Hispanic origin (detail)
- Mexican 44% Puerto Rican 1%
- Common ancestry
- Italian 1% Romanian 1% Lithuanian 1%
- Foreign-born
- 20% · Canada, South Korea
- Languages at home
- 58% English-only · Spanish 38% Tagalog/Filipino 2% Arabic 1%
Political lean MEDSL · San Bernardino
- 2024 margin
- Toss-up / Even · D 47.5% · R 49.7% · Other 2.8%
- 2008→2024 swing
- -8.5pp toward R · 2008: 6.3pp · 2024: -2.1pp
- All cycles
- 2024: R+2.1 2020: D+10.7 2016: D+9.8 2012: D+5.4 2008: D+6.3
Not yet ingested
- Civics
- —
Market trends
- HPI YoY
- ▼ -5.17%
- Current HPI
- 384.3185
- Rent YoY
- ▲ 6.46%
- Metro
- Riverside-San Bernardino-Ontario, CA
- State GDP YoY
- ▲ 3.21%
- F500 in state
- 116
Industry mix (Fortune 500 HQ in CA)
| Industry | F500 HQs | Revenue |
|---|---|---|
| Technology | 27 | $1,492B |
|
||
| Financial Services | 3 | $174B |
|
||
| Retail | 3 | $44B |
|
||
| Insurance | 3 | $26B |
|
||
| Media / Entertainment | 2 | $115B |
|
||
| Pharmaceuticals / Biotech | 2 | $62B |
|
||
Price history
+306.2% since first listed10 events — show timeline
- 2026-05-15 Price Changed $325,000 CRMLS
- 2026-03-04 Listed $352,000 CRMLS
- 2026-02-14 Coming Soon $352,000 CRMLS
- 2024-12-30 Listing Removed — CRMLS
- 2024-11-23 Price Changed $374,999 CRMLS
- 2024-10-22 Price Changed $399,900 CRMLS
- 2024-09-28 Listed $420,000 CRMLS
- 2024-05-06 Sold (Public Records) $260,000 Public Records
- 2003-02-21 Sold (Public Records) $80,000 Public Records
- 2003-02-21 Sold (MLS) $80,000 CRMLS
Property tax history
+7.2%/yrLatest (2025): $3,239 · +139.5% YoY. Source: county tax records.
Cash-flow waterfall
monthlySold comps — $/sqft
last 12 mo · ≤1 miLoading sold comps…