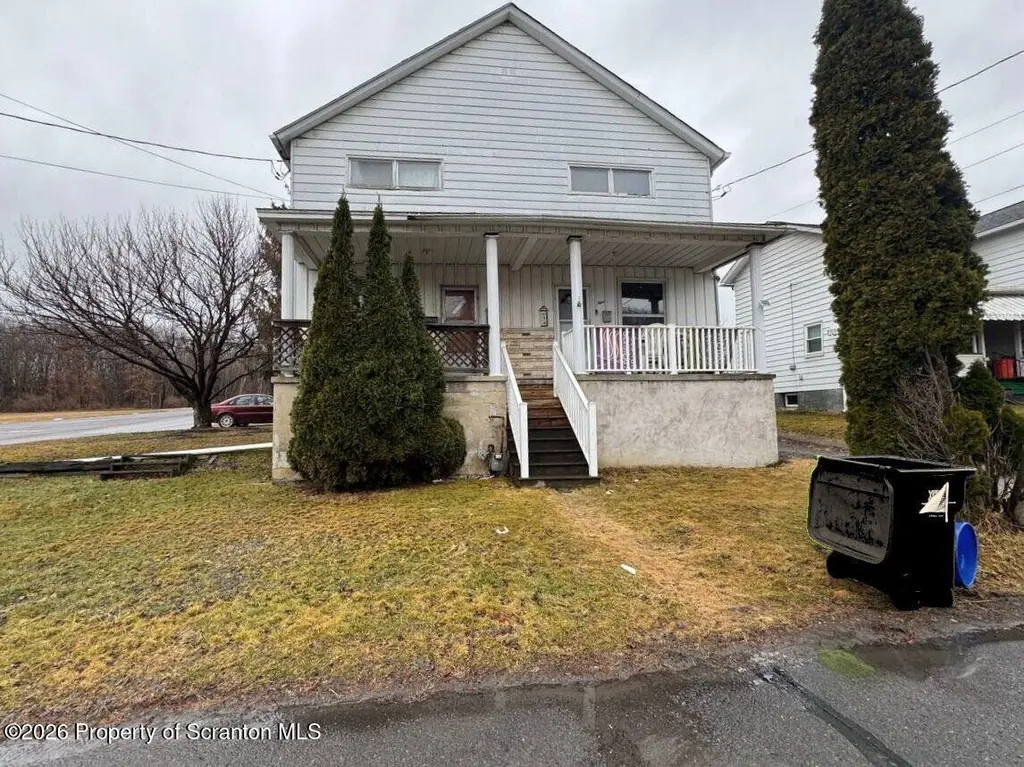
7 Spring · Pittston, PA
Flood risk 4/10 · Minor
- FEMA flood zone
- X (unshaded)
- Chance of flooding over 30 yrs
- 0.24%
- Est. flood insurance / yr
- $507 – $1,088
Fire risk 1/10 · Minimal
- Est. fire insurance / yr
- $511 – $949
Heat risk 4/10 · Minor
- Hot days now (above 96°F)
- 7 days/yr
- Hot days in 30 yrs
- 17 days/yr
Wind risk 3/10 · Minor
- Chance of severe wind over 30 yrs
- 4.0%
Air-quality risk 2/10 · Minimal
- Unhealthy air days now
- 1 days/yr
- Unhealthy air days in 30 yrs
- 2 days/yr
Risk factors via First Street. Map © Google.
Why this score? — see what drove the B grade
The composite is a weighted blend of 9 inputs, each scored 0–100. Each bar is that input's sub-score; the figure is the points it added to the 100-point composite (weight × sub-score).
- Cash flow +30.0/30.0
- ARV discount +15.0/15.0
- DSCR +10.0/10.0
- 1% rule +8.2/10.0
- Livability +3.7/5.0
- Schools +3.0/10.0
- Rent growth +2.5/5.0
- Condition / age +2.5/5.0
- Appreciation +0.0/10.0
$99,000
🖨 Deal sheet 📄 Offer letter ✓ Due diligence
Listing remarks MLS
Great property with plenty of potential and ready for your personal touch! This home is perfect for those eager to apply some TLC and creative vision to make it truly shine. Ideal for anyone looking to craft their dream space to create many lasting memories! Don't miss this chance to transform a gem into your masterpiece!
Key facts
- 4,356 sq ft lot
- Built 1931
- Listed 47 days
Neighborhood map
What this means for you Summary
Snapshot
- This is a 3-bed/1.0-bath single-family listed at $99k.
Deal economics
- At list price, monthly cash flow is $376 ($5k/yr) — positive.
- The deal already cash-flows at list — no discount required.
- Meets the 1% rule at list price ($1k rent vs $99k).
- Recommended offer: $96k (3.0% below list) — sets the bar for market timing.
- Cap rate 10.8% vs local median 6.9% in Pittston — top-decile yield for the area; either an underpriced asset or a hidden risk that comps aren't pricing in. Stress-test before assuming the spread holds.
Location & tenants
- Location reads 74/100 on livability (#493 in PA, #4,549 nationally) — a middle-class / working-renter tenant base. Strengths: crime A+, cost of living A+, health & safety A+; Watch: amenities F, commute F, employment F.
- Pittston Area SD (suburban): math 30% / reading 40% proficiency, ranked #418 of 539 in PA (top 78%) — families likely to look elsewhere, expect single-tenant / working-renter base with shorter leases.
- Market conditions: 103 active listings in the ZIP; 16 comparable units currently listed for rent nearby; rentals lingering (median 44d on market — plan ~5-8 weeks vacancy on turnover, expect pricing pressure); 50% of comp listings sitting > 30 days — soft ceiling on asking rent; 349 units permitted in Luzerne County in 2024 (16 in 5+ unit buildings).
Forward outlook
- Local home prices are declining (-3.0%/yr); year-one equity from $684 of loan paydown is wiped out by about $3k of value loss. Plan a longer hold.
- Luzerne County population projected at +4% by 2050 — modest demand growth; plan on rents tracking national, not racing it.
- At projected returns (-3.0% appreciation + 3.0% rent growth), your $28k cash investment doubles in ~8 years — after that, you're playing with house money.
Negotiation context
- It's been on market 47 days — a 3% lower offer ($96k) is reasonable based on typical stale-listing flexibility.
- 2 sale attempts with the ask held roughly flat each time — persistent listings suggest the price (not the market) is what's stuck; bring a comps-based counter.
- Current owner paid $40k; list at $99k implies a 148% gain — meaningful room to come down on a strong offer.
Risks & watch-outs
- Watch-outs: built in 1931 — expect roof / HVAC / electrical / plumbing capex.
Questions for the listing agent
- It's been on market 47 days. Have you received any prior offers? Is the seller open to a 3% concession, seller financing, or rate buy-down credit?
- Built in 1931 — when were the roof, HVAC, electrical panel, plumbing, and water heater last replaced?
- Is there a deadline driving the sale (1031 exchange, divorce, estate, relocation)? That informs how much negotiation room exists.
- What's the average days-on-market for RENTAL listings here right now (not sales)? A rising rental-DOM trend means longer vacancies and softer asking-rent achievability than the comps imply.
- What's the recent tenant-quality profile in this submarket — average credit score on applications, eviction rate, late-payment / NSF rate, and stable-employment percentage? A property-management company in the area should have these aggregated.
- How much new for-sale + rental construction is in the pipeline within 1–3 miles? Heavy new supply typically softens prices + rents 12–24 months out; constrained supply supports both.
Investment metrics
- 1% rule
- 1.32% ✓
- Cap rate
- 10.85%
- Cash-on-cash
- 16.27%
- DSCR
- 1.72
- GRM
- 6.3
CMA / ARV
- ARV (median comp)
- $158,411
- List price
- $99,000
- Delta
- -37.50%
- Verdict
- UNDERPRICED
- Comps
- 20 within 1.0 mi
Show comp detail 12 sales within ~0.75 mi
| Address | Dist | Beds/Ba | Sqft | Sold | Price | $/sf | Match |
|---|---|---|---|---|---|---|---|
| 69 Market St | 0.13mi | 4/1.0 (+1) | 1,300 (+2%) | 9mo | $204,000 | $157 | 79 |
| 28 Pine St | 0.13mi | 4/1.5 (+1) | 1,350 (+6%) | 2mo | $90,000 | $67 | 76 |
| 101 Johnson St | 0.42mi | 3/1.0 | 1,240 (-3%) | 10mo | $145,000 | $117 | 66 |
| 51 Fulton St | 0.46mi | 3/2.0 | 1,213 (-5%) | 0mo | $85,000 | $70 | 66 |
| 1 Garfield St | 0.49mi | 3/1.0 | 1,380 (+8%) | 5mo | $120,000 | $87 | 60 |
| 39 Tompkins St | 0.24mi | 3/1.0 | 1,107 (-14%) | 10mo | $156,500 | $141 | 58 |
| 80 Parsonage St | 0.73mi | 3/1.0 | 1,280 (0%) | 10mo | $89,900 | $70 | 58 |
| 50 Bryden St | 0.70mi | 2/1.0 (-1) | 1,297 (+1%) | 8mo | $119,000 | $92 | 54 |
| 314 Excelsior St | 0.50mi | 3/2.0 | 1,400 (+9%) | 7mo | $135,000 | $96 | 51 |
| 179 Railroad St | 0.47mi | 2/1.0 (-1) | 1,420 (+11%) | 6mo | $95,000 | $67 | 50 |
| 35 Stark St | 0.54mi | 3/1.0 | 1,140 (-11%) | 8mo | $115,000 | $101 | 50 |
| 51 Plank St | 0.64mi | 4/2.0 (+1) | 1,410 (+10%) | 10mo | $180,000 | $128 | 36 |
Match score weights: distance 35% · size 25% · config 20% · recency 20%. Top-matched comps best support the ARV.
Projected returns pro-forma
-3.0% appreciation · 3.0% rent growth · sell at horizon
- IRR
- 7.3%
- Equity multiple
- 1.28×
- Total profit
- $7,891
- Equity at exit
- $14,761
- IRR
- 16.6%
- Equity multiple
- 2.36×
- Total profit
- $37,691
- Equity at exit
- $8,560
Cash invested: $27,720 (down + closing). Projections, not guarantees.
Landlord ↔ Tenant lean methodology
- Overall (STATE)
- 62 Landlord-Friendly
- State Pennsylvania
- 62 Landlord-Friendly · EVEN
- County
- — inherits STATE
- City
- — inherits STATE
ZIP-level market 18640
- Home prices YoY
- -34.9%
- Active inventory
- 103
- Price-to-rent
- 6.3×
Monthly cashflow live
- Estimated rent
- $1,302 high interval (Pro) →
- Mortgage (P&I)
- −$519
- Tax from tax record
- −$93 /mo · $1,111/yr
- Insurance
- −$41
- HOA
- −$0
- Vacancy / Maint / Mgmt
- −$273
- Net cashflow
- $376
Break-even live
UW: 25.0% down · 7.5% · 30yr · 1.5% tax · 5.0% vac · 8.0% maint · 8.0% mgmt
Financing live
Cash to close
- Down payment
- $24,750
- Closing costs
- $2,970
- Reserves months
- —
- Total cash needed
- —
Loan-product check · same deal, 3 products live
Conventional
25% down · 7.5% · 30yr
- Down + closing
- —
- Monthly P&I
- —
- Monthly cashflow
- —
- DSCR
- —
- Eligible?
- —
Personal DTI + credit; lowest rate.
DSCR
20% down · 8.5% · 30yr
- Down + closing
- —
- Monthly P&I
- —
- Monthly cashflow
- —
- DSCR
- —
- Eligible?
- —
No personal income docs; deal must DSCR.
Hard money
10% down · 12.0% · 12mo
- Down + closing
- —
- Monthly P&I
- —
- Monthly cashflow
- —
- DSCR
- —
- Eligible?
- —
Short-term bridge; refi at stabilization.
Rent comps 16 comps
| Address | Beds | Baths | Sqft | Rent | $/sqft | DOM | Units | Dist |
|---|---|---|---|---|---|---|---|---|
| 109 Main St Pittston, PA | 2.0–3.0 | 2.0 | 1070 | $1,300 | $1.21 | 13d | 1 | 0.11mi |
| 24 E Columbus Ave Pittston, PA | 2.0 | 1.0 | 896 | $1,200 | $1.34 | 21d | 1 | 0.19mi |
| 118 1/2 Broad St Pittston, PA | 2.0 | 1.0 | 950 | $1,200 | $1.26 | 13d | 1 | 0.25mi |
| 252 S Main St Pittston, PA | 4.0 | 2.5 | 1548 | $1,750 | $1.13 | 44d | 1 | 0.41mi |
| 197 Rear Broad St Pittston, PA | 2.0 | 2.0 | 1600 | $1,350 | $0.84 | 13d | 1 | 0.44mi |
| 197 Rear Broad St Pittston, PA | 2.0 | 2.0 | 1800 | $1,350 | $0.75 | 44d | 1 | 0.44mi |
| 7 Miller St Pittston, PA | 2.0 | 1.0 | 1120 | $1,150 | $1.03 | 13d | 1 | 0.69mi |
| 3 Miller St Pittston, PA | 3.0 | 1.0 | 1007 | $1,200 | $1.19 | 44d | 1 | 0.69mi |
| 102A Searle St Pittston, PA | 3.0 | 1.0 | 960 | $1,350 | $1.41 | 44d | 1 | 0.72mi |
| 202 Philadelphia Ave West Pittston, PA | 2.0 | 1.5 | 1550 | $1,600 | $1.03 | 13d | 1 | 0.72mi |
| 524 Spring St #2 Jenkins Township, PA | 2.0 | 1.0 | 1300 | $925 | $0.71 | 44d | 1 | 0.79mi |
| 524 Spring St Pittston, PA | 2.0 | 1.0 | 1450 | $900 | $0.62 | 44d | 1 | 0.79mi |
| 178 Parsonage St Pittston, PA | 3.0 | 1.0 | 1500 | $1,500 | $1.00 | 13d | 1 | 0.85mi |
| 327 Fremont St Unit 329 West Pittston, PA | 3.0 | 1.0 | 1250 | $1,400 | $1.12 | 44d | 1 | 1.01mi |
| 329 Fremont St West Pittston, PA | 3.0 | 1.0 | 1250 | $1,400 | $1.12 | 44d | 1 | 1.01mi |
| 226 Fremont St West Pittston, PA | 3.0 | 2.0 | 1140 | $1,395 | $1.22 | 13d | 1 | 1.04mi |
Listing history 5 events
-
2026-05-07status Pending 323-char remark
Show marketing remark (323 chars)
Great property with plenty of potential and ready for your personal touch! This home is perfect for those eager to apply some TLC and creative vision to make it truly shine. Ideal for anyone looking to craft their dream space to create many lasting memories! Don't miss this chance to transform a gem into your masterpiece!
-
2026-03-25status Active 323-char remark
Show marketing remark (323 chars)
Great property with plenty of potential and ready for your personal touch! This home is perfect for those eager to apply some TLC and creative vision to make it truly shine. Ideal for anyone looking to craft their dream space to create many lasting memories! Don't miss this chance to transform a gem into your masterpiece!
-
2026-03-20status Pending 323-char remark
Show marketing remark (323 chars)
Great property with plenty of potential and ready for your personal touch! This home is perfect for those eager to apply some TLC and creative vision to make it truly shine. Ideal for anyone looking to craft their dream space to create many lasting memories! Don't miss this chance to transform a gem into your masterpiece!
-
2026-03-16$99,000 Active 323-char remark
Show marketing remark (323 chars)
Great property with plenty of potential and ready for your personal touch! This home is perfect for those eager to apply some TLC and creative vision to make it truly shine. Ideal for anyone looking to craft their dream space to create many lasting memories! Don't miss this chance to transform a gem into your masterpiece!
-
2006-07-06soldstatus $40,000
ⓘ Source: listings_history table (triggers on properties + properties_extension) + one-shot
backfill from property_details.listing_events for pre-trigger history.
Tax reassessment forecast PA · Partial reset (capped growth)
- Current annual tax
- $1,111 · $93/mo
- Projected year-2 tax
- $1,337 · $111/mo
- Expected delta
- +$227/yr (+$19/mo · 20.4%)
ⓘ Screening estimate from a state-policy table — verify with the county assessor before closing.
Climate risk First Street
- Flood 4/10 Moderate FEMA zone X (unshaded) · 24% chance over 30 yrs
- Wildfire 1/10 Low
- Heat 4/10 Moderate 7 d/yr ≥96°F today · 17 d/yr by 30 yrs out
- Wind 3/10 Moderate 4% chance of damaging wind over 30 yrs
- Air quality 2/10 Low 1 unhealthy d/yr today · 2 by 30 yrs out
Nearby sold comps map
Loading sold comps map…
Walkable amenities ~0.75 mi
Loading nearby amenities…
Taxation est. · year 1
- Rental income
- $15,626
- − Mortgage interest
- −$5,546
- − Property taxes
- −$1,111
- − Insurance
- −$495
- − Repairs & maintenance
- −$1,250
- − Management
- −$1,250
- − Depreciation
- −$2,880
- Taxable income
- $3,095
- Est. tax owed @ 24.0%
- −$743
- After-tax cash flow
- $3,766/yr
For passive investors: Depreciation is non-cash, so a rental often shows a tax loss while cash-flowing — sheltering income. Rental losses are passive: they offset passive income freely, and up to $25,000/yr can offset ordinary (W-2) income if you actively participate and your MAGI is under $100k (phasing out to $0 by $150k); unused losses carry forward. On sale, claimed depreciation is recaptured at up to 25%, and gains may owe capital-gains tax (a 1031 exchange can defer both). Figures are a year-1 estimate at your 24.0% rate — not tax advice; consult a CPA.
Schools (NCES district)
- District
- Pittston Area SD
- NCES district ID
- 4219200
- Math proficiency
- 30% ▼ -12.00%
- Reading proficiency
- 40% ▼ -19.00%
- Median HH income
- $45,316
- Composite
- 29.86/100
- National rank
- #6409
- State rank
- #418 of 539 in PA
Livability — Pittston
- Score
- 74/100
- State rank
- #493
- US rank
- #4549
Category grades
Schools grade is shown separately in the Schools card above.
Census & demographics
- Census place
- Pittston, PA
- Population (ZIP)
- 16,418
Population outlook (Luzerne County) Hauer SSP2
- Today (2025)
- 319,505 people
- By 2030
- 319,943 · +0.1%
- By 2040
- 322,643 · +1.0%
- By 2050
- 330,817 · +3.5%
- By 2075
- 379,145 · +18.7%
- By 2100
- 431,908 · +35.2%
Race, ethnicity, and origin ACS 2023
- Neighborhood character
- Predominantly White (85%)
- Race & ethnicity
- White 85% Hispanic / Latino 6% Two or more races 5% Black 4%
- Hispanic origin (detail)
- Puerto Rican 4%
- Common ancestry
- Romanian 19% Scotch-Irish 2% Iranian 1%
- Foreign-born
- 3% · Canada, Jamaica
- Languages at home
- 93% English-only · Spanish 4% Other Indo-European 1% Chinese 1%
Political lean MEDSL · Luzerne
- 2024 margin
- R (+19.2) · D 40.0% · R 59.2%
- 2008→2024 swing
- -27.6pp toward R · 2008: 8.4pp · 2024: -19.2pp
- All cycles
- 2024: R+19.2 2020: R+14.4 2016: R+19.6 2012: D+4.8 2008: D+8.4
Not yet ingested
- Civics
- —
Market trends
- HPI YoY
- ▼ -102.89%
- Current HPI
- 191.973
- Rent YoY
- —
- Metro
- —
- State GDP YoY
- ▲ 1.68%
- F500 in state
- 34
Industry mix (Fortune 500 HQ in PA)
| Industry | F500 HQs | Revenue |
|---|---|---|
| Healthcare | 2 | $309B |
|
||
| Insurance | 2 | $27B |
|
||
| Telecommunications / Media | 1 | $124B |
|
||
| Industrial Distribution | 1 | $22B |
|
||
| Financial Services | 1 | $20B |
|
||
| Chemicals / Materials | 1 | $18B |
|
||
Price history
+147.5% since first listed5 events — show timeline
- 2026-05-07 Pending — GSBR as distributed by MLS GRID
- 2026-03-25 Relisted — GSBR as distributed by MLS GRID
- 2026-03-20 Pending — GSBR as distributed by MLS GRID
- 2026-03-16 Listed $99,000 GSBR as distributed by MLS GRID
- 2006-07-06 Sold (Public Records) $40,000 Public Records
Property tax history
+1.7%/yrLatest (2026): $1,111 · +2.5% YoY. Source: county tax records.
Cash-flow waterfall
monthlySold comps — $/sqft
last 12 mo · ≤1 miLoading sold comps…