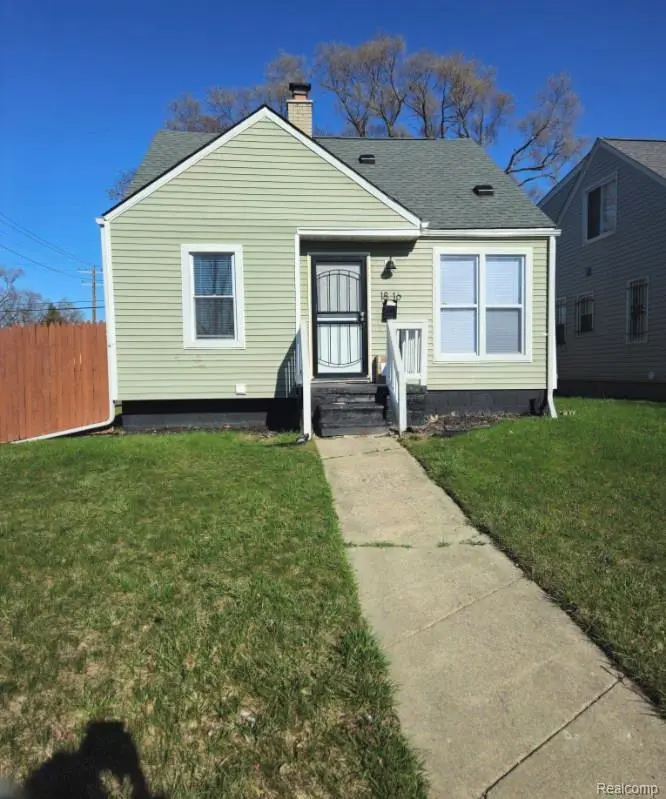
18116 Bloom St · Detroit, MI
Flood risk 1/10 · Minimal
- FEMA flood zone
- X (unshaded)
- Chance of flooding over 30 yrs
- 0.0%
- Est. flood insurance / yr
- $507 – $1,088
Fire risk 1/10 · Minimal
- Est. fire insurance / yr
- $784 – $1,456
Heat risk 3/10 · Minor
- Hot days now (above 97°F)
- 7 days/yr
- Hot days in 30 yrs
- 15 days/yr
Wind risk 2/10 · Minimal
- Chance of severe wind over 30 yrs
- —
Air-quality risk 3/10 · Minor
- Unhealthy air days now
- 2 days/yr
- Unhealthy air days in 30 yrs
- 5 days/yr
Risk factors via First Street. Map © Google.
Why this score? — see what drove the C grade
The composite is a weighted blend of 9 inputs, each scored 0–100. Each bar is that input's sub-score; the figure is the points it added to the 100-point composite (weight × sub-score).
- Cash flow +28.8/30.0
- DSCR +10.0/10.0
- 1% rule +8.0/10.0
- Rent growth +4.2/5.0
- Livability +3.7/5.0
- Condition / age +2.5/5.0
- Schools +1.3/10.0
- ARV discount +0.0/15.0
- Appreciation +0.0/10.0
$100,000
🖨 Deal sheet (PDF) 📄 Offer letter ✓ Due diligence
Listing remarks MLS
A must see! Nestled in a friendly, family-oriented neighborhood. Discover this true gem, offering the perfect combination of comfort, convenience, and charm. 3 Bedroom Aluminum Bungalow perfectly blends classic charm with modern updates. This home boast a beautifully remodeled kitchen, showcasing sleek countertop, elegant & relaxing bathtub. Ideal for first-time homebuyers or savvy investors, this move-in-ready property boasts modern upgrades: windows, roof, furnace, hot water tank, plumbing, and hardwood flooring. Property located close to shopping center, highway and roads. Available for immediate occupancy-don't miss the opportunity. Located just minutes from top-rated schools, parks, and local amenities, this home combines convenience with charm in a vibrant Detroit community. Don't miss out on this affordable, high-potential property - schedule a showing today! BATVAI
Key facts
- Hardwood flooring
- Sleek countertop
- Modern upgrades
Tags
Property features AI
Exterior
- Parking: No garage
- Utilities: Public water; Public sewer; Water and sewer available
- Home design: Single-family residence; Residential property; One and one-half stories; Ground-level entry
- Construction: Aluminum siding; Block foundation; Shingle and tile roof; Built area above grade: 720; Finished area below grade: 720
- Exterior features: Front porch; Backyard fencing (fenced)
Interior
- Kitchen: Free-standing refrigerator
- Bedrooms: 3 total rooms
- Bathrooms: 1 full bathroom
- Heating & cooling: Forced air heating; Natural gas heating; No cooling
- Interior features: Gas water heater; Unfinished full basement
- Laundry & utility: Washer; Dryer
Neighborhood map
What this means for you Summary
Snapshot
- This is a 3-bed/1.0-bath single-family listed at $100k.
Deal economics
- At list price, monthly cash flow is $337 ($4k/yr) — positive.
- The deal already cash-flows at list — no discount required.
- Meets the 1% rule at list price ($1k rent vs $100k).
- Recommended offer: $98k (1.5% below list) — sets the bar for market timing.
Location & tenants
- Location reads 73/100 on livability (#218 in MI) — a middle-class / working-renter tenant base. Strengths: amenities A+, commute A+, cost of living A+; Watch: schools F, crime F, employment F.
- Detroit Public Schools Community District (urban): math 10% / reading 24% proficiency, ranked #499 of 540 in MI (top 92%) — low school quality limits family demand, transient renter base, plan for 1-2y turnover; 90% free/reduced lunch — lower-income household profile, screen leases tightly.
- Market conditions: Rents rising fast (+6.7%/yr); 227 active listings in the ZIP; 24 comparable units currently listed for rent nearby; rentals at typical pace (median 18d on market — plan ~3-4 weeks tenant-placement turnaround); lower-income renter base — watch delinquency; 2,639 units permitted in Wayne County in 2024 (1,216 in 5+ unit buildings).
- This rent runs 44% of the median local income ($35k/yr) — at the standard rent-burdened threshold; future hikes will face affordability resistance.
Forward outlook
- Local home prices are declining (-3.0%/yr); year-one equity from $691 of loan paydown is wiped out by about $3k of value loss. Plan a longer hold.
- Wayne County population projected at -17% by 2050 — secular population decline; favor cash flow + early exit over multi-decade hold.
- At projected returns (-3.0% appreciation + 6.7% rent growth), your $28k cash investment doubles in ~7 years — after that, you're playing with house money.
Negotiation context
- It's been on market 23 days — a 2% lower offer ($98k) is reasonable based on typical stale-listing flexibility.
- 11 sale attempts since 16y ago with the ask held roughly flat each time — persistent listings suggest the price (not the market) is what's stuck; bring a comps-based counter.
Risks & watch-outs
- Watch-outs: built in 1950 — expect roof / HVAC / electrical / plumbing capex.
Questions for the listing agent
- Built in 1950 — when were the roof, HVAC, electrical panel, plumbing, and water heater last replaced?
- Is there a deadline driving the sale (1031 exchange, divorce, estate, relocation)? That informs how much negotiation room exists.
- Schools are F-rated, which usually means shorter tenancies and higher turnover. Who's the typical renter profile here, and what's been the actual vacancy rate?
- Crime grade is F in this area — have there been break-ins, vandalism, or insurance claims at this property in the last 3 years? What carrier currently insures it and at what premium?
- What's the average days-on-market for RENTAL listings here right now (not sales)? A rising rental-DOM trend means longer vacancies and softer asking-rent achievability than the comps imply.
- What's the recent tenant-quality profile in this submarket — average credit score on applications, eviction rate, late-payment / NSF rate, and stable-employment percentage? A property-management company in the area should have these aggregated.
- How much new for-sale + rental construction is in the pipeline within 1–3 miles? Heavy new supply typically softens prices + rents 12–24 months out; constrained supply supports both.
Investment metrics
- 1% rule
- 1.30% ✓
- Cap rate
- 10.34%
- Cash-on-cash
- 14.44%
- DSCR
- 1.64
- GRM
- 6.4
CMA / ARV
- ARV (on-the-fly)
- $82,080
- Comps found
- 12
Show comp detail 12 sales within ~0.75 mi
| Address | Dist | Beds/Ba | Sqft | Sold | Price | $/sf | Match |
|---|---|---|---|---|---|---|---|
| 18105 Caldwell St | 0.09mi | 3/1.0 | 1,500 (+4%) | 1mo | $35,000 | $23 | 88 |
| 18677 Moenart St | 0.23mi | 2/1.0 (-1) | 1,470 (+2%) | 6mo | $43,000 | $29 | 76 |
| 18057 Albany St | 0.20mi | 3/2.0 | 1,350 (-6%) | 5mo | $144,000 | $107 | 72 |
| 18410 Fenelon St | 0.21mi | 2/1.0 (-1) | 1,344 (-7%) | 11mo | $70,500 | $52 | 65 |
| 18844 Healy St | 0.44mi | 4/2.0 (+1) | 1,252 (-13%) | 2mo | $45,000 | $36 | 47 |
| 19443 Conley St | 0.73mi | 2/1.0 (-1) | 1,398 (-3%) | 12mo | $38,000 | $27 | 46 |
| 19189 Justine St | 0.70mi | 3/1.0 | 1,534 (+6%) | 13mo | $87,000 | $57 | 45 |
| 17160 Conley St | 0.57mi | 4/2.0 (+1) | 1,600 (+11%) | 7mo | $70,000 | $44 | 40 |
| 18503 Dean St | 0.69mi | 3/2.0 | 1,311 (-9%) | 12mo | $140,000 | $107 | 39 |
| 18461 Sunset St | 0.63mi | 3/2.0 | 1,620 (+12%) | 10mo | $192,500 | $119 | 38 |
| 19210 Gable St | 0.60mi | 4/1.5 (+1) | 1,298 (-10%) | 14mo | $79,000 | $61 | 37 |
| 18880 Hasse St | 0.50mi | 4/2.0 (+1) | 1,233 (-14%) | 12mo | $99,900 | $81 | 34 |
Match score weights: distance 35% · size 25% · config 20% · recency 20%. Top-matched comps best support the ARV.
Projected returns pro-forma
-3.0% appreciation · 6.72% rent growth · sell at horizon
- IRR
- 9.0%
- Equity multiple
- 1.37×
- Total profit
- $10,333
- Equity at exit
- $14,910
- IRR
- 21.1%
- Equity multiple
- 3.11×
- Total profit
- $59,102
- Equity at exit
- $8,646
Cash invested: $28,000 (down + closing). Projections, not guarantees.
Landlord ↔ Tenant lean methodology
- Overall (STATE)
- 62 Landlord-Friendly
- State Michigan
- 62 Landlord-Friendly · EVEN
- County
- — inherits STATE
- City
- — inherits STATE
ZIP-level market 48234
- Home prices YoY
- -11.9%
- Rents YoY
- 6.7%
- Active inventory
- 227
- Price-to-rent
- 6.4×
Monthly cashflow live
- Estimated rent
- $1,301 high interval (Pro) →
- Mortgage (P&I)
- −$524
- Tax est. 1.5%
- −$125 /mo · $1,500/yr
- Insurance
- −$42
- HOA
- −$0
- Vacancy / Maint / Mgmt
- −$273
- Net cashflow
- $337
Break-even live
Sensitivity live
| Price | -10% $406 | -5% $372 | +0% $337 | +5% $302 | +10% $268 |
|---|---|---|---|---|---|
| Rent | -10% $234 | -5% $286 | +0% $337 | +5% $388 | +10% $440 |
| Rate | -1.0pp $387 | -0.5pp $362 | base $337 | +0.5pp $311 | +1.0pp $285 |
UW: 25.0% down · 7.5% · 30yr · 1.5% tax · 5.0% vac · 8.0% maint · 8.0% mgmt
Financing live
Cash to close
- Down payment
- $25,000
- Closing costs
- $3,000
- Reserves months
- —
- Total cash needed
- —
Loan-product check · same deal, 3 products live
Conventional
25% down · 7.5% · 30yr
- Down + closing
- —
- Monthly P&I
- —
- Monthly cashflow
- —
- DSCR
- —
- Eligible?
- —
Personal DTI + credit; lowest rate.
DSCR
20% down · 8.5% · 30yr
- Down + closing
- —
- Monthly P&I
- —
- Monthly cashflow
- —
- DSCR
- —
- Eligible?
- —
No personal income docs; deal must DSCR.
Hard money
10% down · 12.0% · 12mo
- Down + closing
- —
- Monthly P&I
- —
- Monthly cashflow
- —
- DSCR
- —
- Eligible?
- —
Short-term bridge; refi at stabilization.
Rent comps 24 comps
| Address | Beds | Baths | Sqft | Rent | $/sqft | DOM | Units | Dist |
|---|---|---|---|---|---|---|---|---|
| 18677 Moenart St Detroit, MI | 2.0 | 1.0 | 1470 | $1,200 | $0.82 | 45d | 1 | 0.21mi |
| 18884 Bloom St Detroit, MI | 3.0 | 1.0 | 979 | $975 | $1.00 | 45d | 1 | 0.33mi |
| 18884 Bloom St Detroit, MI | 3.0 | 1.0 | 979 | $975 | $1.00 | 23d | 1 | 0.33mi |
| 18891 Moenart St Detroit, MI | 3.0 | 1.0 | 1150 | $1,250 | $1.09 | 0d | 1 | 0.34mi |
| 19162 Conley St Detroit, MI | 2.0 | 1.0 | 1000 | $1,300 | $1.30 | 45d | 1 | 0.47mi |
| 19260 Bloom St Detroit, MI | 3.0 | 1.0 | 1100 | $1,350 | $1.23 | 6d | 1 | 0.54mi |
| 19361 Moenart St Unit 1 Detroit, MI | 2.0 | 1.0 | 1000 | $1,100 | $1.10 | 25d | 1 | 0.62mi |
| 19450 Fenelon St Detroit, MI | 3.0 | 1.0 | 1062 | $1,384 | $1.30 | 6d | 1 | 0.74mi |
| 19415 Gable St Detroit, MI | 3.0 | 1.0 | 1000 | $1,373 | $1.37 | 25d | 1 | 0.74mi |
| 18557 Wexford St Detroit, MI | 3.0 | 1.0 | 1216 | $1,250 | $1.03 | 25d | 1 | 0.85mi |
| 19458 Binder St Detroit, MI | 3.0 | 1.5 | 1550 | $1,500 | $0.97 | 5d | 1 | 1.04mi |
| 20058 Bloom St Detroit, MI | 4.0 | 1.0 | 1350 | $1,450 | $1.07 | 18d | 1 | 1.06mi |
| 19171 Cliff St Detroit, MI | 3.0 | 1.0 | 1000 | $1,200 | $1.20 | 18d | 1 | 1.14mi |
| 19360 Revere St Detroit, MI | 3.0 | 1.0 | 1050 | $1,250 | $1.19 | 25d | 1 | 1.15mi |
| 19450 Norwood St Detroit, MI | 3.0 | 1.0 | 1000 | $1,200 | $1.20 | 6d | 1 | 1.15mi |
| 19930 Binder St Detroit, MI | 3.0 | 1.0 | 1000 | $1,450 | $1.45 | 18d | 1 | 1.20mi |
| 20263 Caldwell St Detroit, MI | 3.0 | 1.0 | 909 | $1,350 | $1.49 | 18d | 1 | 1.20mi |
| 18666 Joseph Campau St Detroit, MI | 3.0 | 1.0 | 1000 | $1,400 | $1.40 | 18d | 1 | 1.22mi |
| 19682 Rogge St Detroit, MI | 3.0 | 1.0 | 1000 | $1,350 | $1.35 | 0d | 1 | 1.29mi |
| 19694 Gallagher St Detroit, MI | 3.0 | 1.0 | 1000 | $1,150 | $1.15 | 16d | 1 | 1.34mi |
| 20000 Norwood St Detroit, MI | 3.0 | 1.5 | 1150 | $1,200 | $1.04 | 25d | 1 | 1.34mi |
| 20042 Rogge St Detroit, MI | 4.0 | 2.0 | 1232 | $1,394 | $1.13 | 45d | 1 | 1.46mi |
| 20794 Audrey Ave Warren, MI | 3.0 | 1.0 | 954 | $1,350 | $1.42 | 45d | 1 | 1.48mi |
| 7600 Dobel St Detroit, MI | 3.0 | 1.0 | 1234 | $1,400 | $1.13 | 18d | 1 | 1.50mi |
Listing history 14 events
-
2026-06-21days on market $100,000 Active 23 DOM
-
2026-06-18days on market $100,000 Active 20 DOM
-
2026-06-17days on market $100,000 Active 19 DOM
-
2026-06-15days on market $100,000 Active 17 DOM
-
2026-06-13days on market $100,000 Active 15 DOM
-
2026-06-13days on market $100,000 Active 14 DOM
-
2026-06-09days on market $100,000 Active 11 DOM
-
2026-06-08days on market $100,000 Active 10 DOM
-
2026-06-07days on market $100,000 Active 9 DOM
-
2026-06-04days on market $100,000 Active 6 DOM
-
2026-06-03days on market $100,000 Active 5 DOM
-
2026-06-02days on market $100,000 Active 4 DOM
-
2026-06-01days on market $100,000 Active 3 DOM
-
2026-05-31days on market $100,000 Active 2 DOM
ⓘ Source: listings_history table (triggers on properties + properties_extension) + one-shot
backfill from property_details.listing_events for pre-trigger history.
Climate risk First Street
- Flood 1/10 Low FEMA zone X (unshaded) · 0% chance over 30 yrs
- Wildfire 1/10 Low
- Heat 3/10 Moderate 7 d/yr ≥97°F today · 15 d/yr by 30 yrs out
- Wind 2/10 Low
- Air quality 3/10 Moderate 2 unhealthy d/yr today · 5 by 30 yrs out
Nearby sold comps map
Loading sold comps map…
Walkable amenities ~0.75 mi
Loading nearby amenities…
Taxation est. · year 1
- Rental income
- $15,617
- − Mortgage interest
- −$5,602
- − Property taxes
- −$1,500
- − Insurance
- −$500
- − Repairs & maintenance
- −$1,249
- − Management
- −$1,249
- − Depreciation
- −$2,909
- Taxable income
- $2,607
- Est. tax owed @ 24.0%
- −$626
- After-tax cash flow
- $3,418/yr
For passive investors: Depreciation is non-cash, so a rental often shows a tax loss while cash-flowing — sheltering income. Rental losses are passive: they offset passive income freely, and up to $25,000/yr can offset ordinary (W-2) income if you actively participate and your MAGI is under $100k (phasing out to $0 by $150k); unused losses carry forward. On sale, claimed depreciation is recaptured at up to 25%, and gains may owe capital-gains tax (a 1031 exchange can defer both). Figures are a year-1 estimate at your 24.0% rate — not tax advice; consult a CPA.
Schools (NCES district)
- District
- Detroit Public Schools Community District
- NCES district ID
- 2601103
- Math proficiency
- 10% ▼ -2.00%
- Reading proficiency
- 24% ▲ 6.00%
- Median HH income
- $25,815
- Composite
- 13.06/100
- National rank
- #9564
- State rank
- #499 of 540 in MI
Livability — Detroit
- Score
- 73/100
- State rank
- #218
- US rank
- #5427
Category grades
Schools grade is shown separately in the Schools card above.
Census & demographics
- Census place
- Detroit, MI
- County
- Wayne County · 1,562,939 people
- City population
- 572,865
- Metro
- Detroit-Warren-Dearborn, MI
- Population (ZIP)
- 32,760
- Household income
- $35,322
- Rent vs Own
- Severe rent burden
- 2372.0
Population outlook (Wayne County) Hauer SSP2
- Today (2025)
- 1,675,273 people
- By 2030
- 1,620,300 · -3.3%
- By 2040
- 1,502,341 · -10.3%
- By 2050
- 1,384,039 · -17.4%
- By 2075
- 1,124,592 · -32.9%
- By 2100
- 881,193 · -47.4%
Race, ethnicity, and origin ACS 2023
- Neighborhood character
- Predominantly Black (94%)
- Race & ethnicity
- Black 94% White 3% Two or more races 1%
- Common ancestry
- Romanian 1%
- Foreign-born
- 2% · Canada, Vietnam, Philippines
- Languages at home
- 97% English-only · French/Haitian/Cajun 1%
Political lean MEDSL · Wayne
- 2024 margin
- Strong D (+29.0) · D 62.7% · R 33.7% · Other 3.6%
- 2008→2024 swing
- -20.5pp toward R · 2008: 49.5pp · 2024: 29.0pp
- All cycles
- 2024: D+29.0 2020: D+38.1 2016: D+37.3 2012: D+46.9 2008: D+49.5
Not yet ingested
- Civics
- —
Market trends
- HPI YoY
- ▼ -44.65%
- Current HPI
- 328.8978
- Rent YoY
- ▲ 6.72%
- Metro
- Detroit-Warren-Dearborn, MI
- State GDP YoY
- ▲ 1.37%
- F500 in state
- 28
Industry mix (Fortune 500 HQ in MI)
| Industry | F500 HQs | Revenue |
|---|---|---|
| Automotive Parts | 3 | $48B |
|
||
| Automotive | 2 | $372B |
|
||
| Chemicals | 1 | $45B |
|
||
| Automotive Retail | 1 | $29B |
|
||
| Healthcare / Medical Devices | 1 | $23B |
|
||
| Automotive Technology | 1 | $20B |
|
||
Price history
+2841.2% since first listed31 events — show timeline
- 2026-05-29 Listed $100,000 REALCOMP
- 2026-05-29 Listed $100,000 MiRealSource-MiMLS
- 2024-07-29 Sold (Public Records) $87,000 Public Records
- 2024-07-22 Sold (MLS) $87,000 MiRealSource-MiMLS
- 2024-07-22 Sold (MLS) $87,000 REALCOMP
- 2024-06-22 Contingent — MiRealSource-MiMLS
- 2024-06-22 Contingent — REALCOMP
- 2024-05-21 Listed $87,000 MiRealSource-MiMLS
- 2024-05-21 Listed $87,000 REALCOMP
- 2024-01-10 Listing Removed — MiRealSource-MiMLS
- 2024-01-10 Listing Removed — REALCOMP
- 2023-12-17 Relisted — MiRealSource-MiMLS
- 2023-12-17 Relisted — REALCOMP
- 2023-12-07 Pending — MiRealSource-MiMLS
- 2023-12-07 Pending — REALCOMP
- 2023-11-25 Price Changed $92,000 MiRealSource-MiMLS
- 2023-11-24 Price Changed $92,000 REALCOMP
- 2023-10-26 Price Changed $92,500 MiRealSource-MiMLS
- 2023-10-25 Price Changed $92,500 REALCOMP
- 2023-10-02 Relisted — MiRealSource-MiMLS
- 2023-10-02 Relisted — REALCOMP
- 2023-09-19 Pending — REALCOMP
- 2023-09-19 Pending — MiRealSource-MiMLS
- 2023-08-10 Price Changed $93,500 MiRealSource-MiMLS
- 2023-08-10 Price Changed $93,500 REALCOMP
- 2023-07-21 Listed $94,500 MiRealSource-MiMLS
- 2023-07-21 Listed $94,500 REALCOMP
- 2023-07-20 Coming Soon — MiRealSource-MiMLS
- 2023-07-20 Coming Soon — REALCOMP
- 2010-08-12 Sold (MLS) $3,400 REALCOMP
- 2010-07-06 Listed $3,400 REALCOMP
Property tax history
-14.2%/yrLatest (2025): $59 · +128.8% YoY. Source: county tax records.
Cash-flow waterfall
monthlySold comps — $/sqft
last 12 mo · ≤1 miLoading sold comps…