10 Park Ave Unit 7S · New York, NY
Flood risk 1/10 · Minimal
- FEMA flood zone
- X (unshaded)
- Chance of flooding over 30 yrs
- 0.0%
- Est. flood insurance / yr
- $507 – $1,088
Fire risk 1/10 · Minimal
- Est. fire insurance / yr
- $691 – $1,283
Heat risk 6/10 · Moderate
- Hot days now (above 99°F)
- 7 days/yr
- Hot days in 30 yrs
- 15 days/yr
Wind risk 6/10 · Moderate
- Chance of severe wind over 30 yrs
- 27.0%
Air-quality risk 4/10 · Minor
- Unhealthy air days now
- 5 days/yr
- Unhealthy air days in 30 yrs
- 7 days/yr
Risk factors via First Street. Map © Google.
Why this score? — see what drove the B+ grade
The composite is a weighted blend of 9 inputs, each scored 0–100. Each bar is that input's sub-score; the figure is the points it added to the 100-point composite (weight × sub-score).
- Cash flow +30.0/30.0
- 1% rule +10.0/10.0
- DSCR +10.0/10.0
- ARV discount +7.5/15.0
- Appreciation +6.3/10.0
- Schools +5.0/10.0
- Rent growth +3.9/5.0
- Livability +3.8/5.0
- Condition / age +2.5/5.0
$425,000
🖨 Deal sheet 📄 Offer letter ✓ Due diligence
Listing remarks
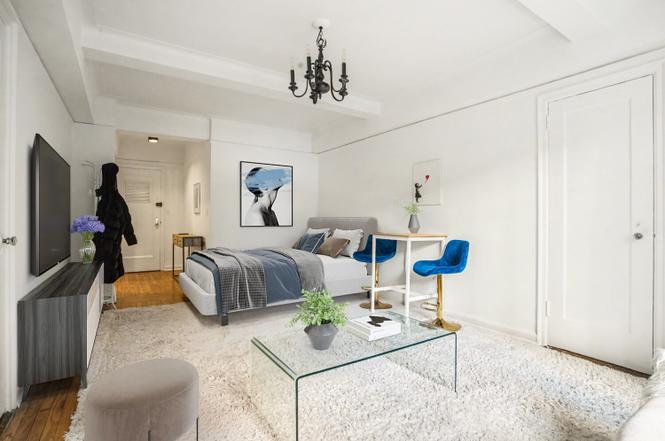
NEW PRICE! SEE ASAP. This bright and sunny studio offers a peaceful retreat in the heart of Midtown, combining classic prewar charm with modern convenience. Exceptionally quiet and filled with natural light, the apartment features high beamed ceilings and casement windows that enhance its timeless character. The updated, windowed kitchen is equipped with modern appliances, while the apartment has been freshly painted for a crisp, move-in-ready feel. Storage is abundant with multiple closets, including walk-ins, along with a separate dressing area that adds both functionality and comfort. A charming and well-maintained Art Deco bathroom completes the home, preserving its original elegance.
Key facts
- Casement windows
- High beamed ceilings
- Updated kitchen
Tags
Property features AI
Finance
- HOA & community: Monthly association fee of $1,151; Pets allowed (building rules: yes; individual restrictions may apply)
Exterior
- Parking: Bike storage
- Home design: Entry on level 26; 28-story building; Zoned C5-3
- Exterior features: Building roof deck; West exposure
Interior
- Bedrooms: 2 total rooms
- Bathrooms: 1 full bathroom
- Interior features: Walk-in closet(s); Basement (Other)
- Laundry & utility: Building laundry
Neighborhood map
What this means for you Summary
Snapshot
- This is a ?-bed/1.0-bath condo listed at $425k.
Deal economics
- At list price, monthly cash flow is $3k ($35k/yr) — positive.
- The deal already cash-flows at list — no discount required.
- Meets the 1% rule at list price ($9k rent vs $425k).
- Recommended offer: $387k (9.0% below list) — sets the bar for market timing.
- Cap rate 14.5% vs local median 2.6% in New York — top-decile yield for the area; either an underpriced asset or a hidden risk that comps aren't pricing in. Stress-test before assuming the spread holds.
Location & tenants
- Location reads 75/100 on livability (#268 in NY, #4,188 nationally) — a middle-class / working-renter tenant base. Strengths: amenities A+, commute A+, health & safety A; Watch: crime F, cost of living F.
- Market conditions: Rents rising fast (+5.4%/yr); 491 active listings in the ZIP; 40 comparable units currently listed for rent nearby; rentals leasing fast (median 11d on market — plan ~1-2 weeks tenant-placement turnaround); high-income renter base; 4,467 units permitted in New York County in 2024 (4,463 in 5+ unit buildings).
- At $8,847/mo this rent would consume 76% of the median local household income ($140k/yr) (locally 5269% of renters already pay >50% of income on rent) — very limited rent-growth headroom before tenants either downsize or default.
Forward outlook
- In year one you build about $14k of equity ($3k loan paydown + $11k appreciation (2.7% local appreciation)).
- New York County population projected at +21% by 2050 — long-run rental-demand tailwind backs the buy-and-hold thesis.
- At projected returns (2.7% appreciation + 5.4% rent growth), your $119k cash investment doubles in ~3 years — after that, you're playing with house money.
- By year 3, paydown + projected appreciation supports a ~$36k cash-out refi (75% LTV) — recoverable capital for the next deal without selling this one.
Negotiation context
- It's been on market 103 days — a 9% lower offer ($387k) is reasonable based on typical stale-listing flexibility.
- 2 sale attempts; this cycle's ask is 21% above the opening price — seller raised mid-cycle; expect resistance to lowballs.
Risks & watch-outs
- Watch-outs: built in 1932 — expect roof / HVAC / electrical / plumbing capex.
- Climate carrying-cost: major wind risk, 27% chance of damaging wind over 30y; extreme-heat days projected 7→15/yr by 2055 (HVAC capex compounding) — expect insurance premiums to compound above CPI over the hold.
Questions for the listing agent
- It's been on market 103 days. Have you received any prior offers? Is the seller open to a 9% concession, seller financing, or rate buy-down credit?
- Built in 1932 — when were the roof, HVAC, electrical panel, plumbing, and water heater last replaced?
- What does the HOA fee cover, when was the last increase, and are there any pending special assessments or reserve-fund shortfalls?
- Any open or pending special assessments — roof, HVAC, plumbing, elevator, façade? What's the per-unit balance and payoff schedule, and is the seller paying it off at close or rolling it to the buyer?
- Why hasn't it sold? Are there any deal-killer items the seller is aware of (foundation, flood, title, zoning, code violations)?
- Is there a deadline driving the sale (1031 exchange, divorce, estate, relocation)? That informs how much negotiation room exists.
- Schools are B-rated — typically a magnet for longer-tenancy family renters. What's the average tenant stay here, and is there a school-zone premium baked into asking?
- Crime grade is F in this area — have there been break-ins, vandalism, or insurance claims at this property in the last 3 years? What carrier currently insures it and at what premium?
- What's the average days-on-market for RENTAL listings here right now (not sales)? A rising rental-DOM trend means longer vacancies and softer asking-rent achievability than the comps imply.
- What's the recent tenant-quality profile in this submarket — average credit score on applications, eviction rate, late-payment / NSF rate, and stable-employment percentage? A property-management company in the area should have these aggregated.
- How much new apartment / multifamily construction is in the pipeline within 1–3 miles? Heavy new supply (>2% of stock underway) typically softens rents 12–24 months out; light construction supports rent growth.
Investment metrics
- 1% rule
- 2.08% ✓
- Cap rate
- 14.49%
- Cash-on-cash
- 29.26%
- DSCR
- 2.30
- GRM
- 4.0
CMA / ARV
No comps found within radius.
Projected returns pro-forma
2.7% appreciation · 5.42% rent growth · sell at horizon
- IRR
- 37.1%
- Equity multiple
- 3.12×
- Total profit
- $252,125
- Equity at exit
- $183,896
- IRR
- 39.0%
- Equity multiple
- 6.75×
- Total profit
- $684,107
- Equity at exit
- $277,929
Cash invested: $119,000 (down + closing). Projections, not guarantees.
Landlord ↔ Tenant lean methodology
- Overall (CITY)
- 0 Strongly Tenant-Friendly
- State New York
- 15 Strongly Tenant-Friendly · D+10
- County
- — inherits STATE
- City New York
- 0 Strongly Tenant-Friendly · D+34
ZIP-level market 10016
- Home prices YoY
- 0.9%
- Rents YoY
- 5.4%
- Active inventory
- 491
- Price-to-rent
- 4.0×
Monthly cashflow live
- Estimated rent
- $8,847 high interval (Pro) →
- Mortgage (P&I)
- −$2,229
- Tax est. 1.5%
- −$531 /mo · $6,375/yr
- Insurance
- −$177
- HOA
- −$1,151
- Vacancy / Maint / Mgmt
- −$1,858
- Net cashflow
- $2,901
Break-even live
UW: 25.0% down · 7.5% · 30yr · 1.5% tax · 5.0% vac · 8.0% maint · 8.0% mgmt
Financing live
Cash to close
- Down payment
- $106,250
- Closing costs
- $12,750
- Reserves months
- —
- Total cash needed
- —
Loan-product check · same deal, 3 products live
Conventional
25% down · 7.5% · 30yr
- Down + closing
- —
- Monthly P&I
- —
- Monthly cashflow
- —
- DSCR
- —
- Eligible?
- —
Personal DTI + credit; lowest rate.
DSCR
20% down · 8.5% · 30yr
- Down + closing
- —
- Monthly P&I
- —
- Monthly cashflow
- —
- DSCR
- —
- Eligible?
- —
No personal income docs; deal must DSCR.
Hard money
10% down · 12.0% · 12mo
- Down + closing
- —
- Monthly P&I
- —
- Monthly cashflow
- —
- DSCR
- —
- Eligible?
- —
Short-term bridge; refi at stabilization.
Rent comps 40 comps
| Address | Beds | Baths | Sqft | Rent | $/sqft | DOM | Units | Dist |
|---|---|---|---|---|---|---|---|---|
| 30 Park Ave Unit 30B New York, NY | 3.0 | 3.0 | 2773 | $28,000 | $10.10 | 24d | 1 | 0.02mi |
| 30 Park Ave #1347 New York, NY | 2.0 | 1.0 | 950 | $9,570 | $10.07 | 1d | 3 | 0.02mi |
| 41 Park Ave New York, NY | 2.0 | 1.0–2.0 | 815 | $8,170 | $10.02 | 7d | 3 | 0.06mi |
| 49 E 34th St New York, NY | 1.0 | 1.5 | — | $8,995 | — | 24d | 1 | 0.07mi |
| 237 Madison Ave New York, NY | 2.0 | 3.0 | — | $18,000 | — | 5d | 1 | 0.12mi |
| 237 Madison Ave Unit PHA New York, NY | 2.0 | 3.0 | — | $18,000 | — | 7d | 1 | 0.12mi |
| 141 E 33rd St #1278 New York, NY | 2.0 | 1.0–1.5 | 683 | $7,210 | $10.56 | 7d | 3 | 0.17mi |
| 7 Sniffen Ct Unit 1467099P New York, NY | 1.0 | 1.0 | — | $7,748 | — | 7d | 1 | 0.17mi |
| 138 E 38th St New York, NY | 3.0 | 1.0–2.0 | 750 | $6,420 | $8.56 | 24d | 4 | 0.18mi |
| 162 E 36th St Unit 18B New York, NY | 1.0 | 1.0 | — | $7,175 | — | 5d | 1 | 0.19mi |
| 158 E 37th St Unit 5A New York, NY | 2.0 | 1.0 | — | $7,500 | — | 18d | 1 | 0.20mi |
| 400 5th Ave Unit 41E New York, NY | 2.0 | 2.5 | 1437 | $12,750 | $8.87 | 11d | 1 | 0.20mi |
| 556 3rd Ave New York, NY | 1.0 | 1.0 | 540 | $5,635 | $10.44 | 1d | 2 | 0.21mi |
| 556 3rd Ave New York, NY | 1.0 | 1.0 | 580 | $5,240 | $9.03 | 19d | 2 | 0.21mi |
| 556 3rd Ave Unit 2244 New York, NY | 1.0 | 1.0 | 500 | $5,650 | $11.30 | 2d | 1 | 0.21mi |
| 400 5th Ave New York, NY | 2.0 | 2.5 | 1302 | $11,350 | $8.71 | 4d | 2 | 0.21mi |
| 325 5th Ave New York, NY | 2.0–3.0 | 2.0–3.0 | — | $9,500 | — | 24d | 2 | 0.21mi |
| 309 5th Ave New York, NY | 1.0 | 1.0 | 597 | $7,596 | $12.72 | 7d | 13 | 0.24mi |
| 155 E 31st St #2190 New York, NY | 1.0–2.0 | 1.0–1.5 | 725 | $8,070 | $11.13 | 7d | 2 | 0.26mi |
| 155 E 31st St Unit E3F New York, NY | 3.0 | 1.0 | — | $7,400 | — | 7d | 1 | 0.26mi |
| 594 3rd Ave New York, NY | 2.0 | 1.0 | — | $4,700 | — | 24d | 1 | 0.26mi |
| 121 Madison Ave New York, NY | 2.0–4.0 | 1.0–2.0 | 1012 | $7,295 | $7.20 | 7d | 3 | 0.26mi |
| 105 Park Ave Unit 07 New York, NY | 2.0 | 2.0 | — | $5,950 | — | 24d | 1 | 0.28mi |
| 105 Park Ave Unit 10 New York, NY | 3.0 | 3.0 | — | $8,000 | — | 24d | 1 | 0.28mi |
| 105 Park Ave Unit 09 New York, NY | 3.0 | 3.0 | — | $7,750 | — | 24d | 1 | 0.28mi |
| 222 E 34th St #999 New York, NY | 1.0 | 1.0 | 554 | $5,490 | $9.91 | 6d | 1 | 0.29mi |
| 147 Lexington Ave Unit 1541851P New York, NY | 3.0 | 3.0 | — | $27,842 | — | 21d | 1 | 0.31mi |
| 222 E 39th St New York, NY | 4.0 | 1.0–2.0 | 1100 | $6,972 | $6.34 | 10d | 19 | 0.32mi |
| 222 E 39th St New York, NY | 1.0–4.0 | 1.0–2.0 | 1100 | $6,850 | $6.23 | 6d | 19 | 0.32mi |
| 222 E 39th St New York, NY | 1.0–4.0 | 1.0–2.0 | 1100 | $6,783 | $6.17 | 20d | 19 | 0.32mi |
| 222 E 39th St New York, NY | 1.0–4.0 | 1.0–2.0 | 1100 | $6,133 | $5.58 | 2d | 20 | 0.32mi |
| 222 E 39th St New York, NY | 1.0–4.0 | 1.0–2.0 | 1100 | $6,783 | $6.17 | 24d | 18 | 0.32mi |
| 239 E 33rd St Unit 2J New York, NY | 2.0 | 1.0 | — | $4,600 | — | 11d | 1 | 0.32mi |
| 239 E 33rd St Unit 11G New York, NY | 3.0 | 1.0 | — | $6,500 | — | 24d | 1 | 0.32mi |
| 16 W 40th St Unit 25C New York, NY | 2.0 | 2.5 | — | $13,995 | — | 24d | 1 | 0.32mi |
| 230 E 32nd St New York, NY | 2.0 | 1.0 | — | $5,495 | — | 11d | 1 | 0.33mi |
| 230 E 32nd St Unit 1C New York, NY | 2.0 | 1.0 | — | $5,295 | — | 5d | 1 | 0.33mi |
| 230 E 32nd St New York, NY | 2.0 | 1.0 | 800 | $5,395 | $6.74 | 15d | 2 | 0.33mi |
| 230 E 32nd St New York, NY | 2.0 | 1.0 | — | $5,295 | — | 24d | 1 | 0.33mi |
| 225 E 39th St New York, NY | 1.0 | 1.0 | — | $5,800 | — | 24d | 1 | 0.34mi |
HOA detail condo
- Monthly dues
- $1,151 · $13,812/yr
- Assessments
- None detected in remarks — confirm with the listing agent.
Listing history 15 events
-
2026-06-18days on market $425,000 Active 103 DOM
-
2026-06-17days on market $425,000 Active 102 DOM
-
2026-06-15days on market $425,000 Active 100 DOM
-
2026-06-13days on market $425,000 Active 98 DOM
-
2026-06-10days on market $425,000 Active 94 DOM
-
2026-06-08days on market $425,000 Active 93 DOM
-
2026-06-08days on market $425,000 Active 92 DOM
-
2026-06-04days on market $425,000 Active 89 DOM
-
2026-06-03days on market $425,000 Active 88 DOM
-
2026-06-01days on market $425,000 Active 86 DOM
-
2026-05-31pricedays on market $425,000 Active 85 DOM
-
2026-04-23price $450,000
-
2026-04-23price $420,000
-
2026-04-23status Active
-
2026-02-12$350,000 Active
ⓘ Source: listings_history table (triggers on properties + properties_extension) + one-shot
backfill from property_details.listing_events for pre-trigger history.
Climate risk First Street
- Flood 1/10 Low FEMA zone X (unshaded) · 0% chance over 30 yrs
- Wildfire 1/10 Low
- Heat 6/10 Major 7 d/yr ≥99°F today · 15 d/yr by 30 yrs out
- Wind 6/10 Major 27% chance of damaging wind over 30 yrs
- Air quality 4/10 Moderate 5 unhealthy d/yr today · 7 by 30 yrs out
Nearby sold comps map
Loading sold comps map…
Walkable amenities ~0.75 mi
Loading nearby amenities…
Taxation est. · year 1
- Rental income
- $106,170
- − Mortgage interest
- −$23,807
- − Property taxes
- −$6,375
- − Insurance
- −$2,125
- − Repairs & maintenance
- −$8,494
- − Management
- −$8,494
- − HOA
- −$13,812
- − Depreciation
- −$12,364
- Taxable income
- $30,700
- Est. tax owed @ 24.0%
- −$7,368
- After-tax cash flow
- $27,449/yr
For passive investors: Depreciation is non-cash, so a rental often shows a tax loss while cash-flowing — sheltering income. Rental losses are passive: they offset passive income freely, and up to $25,000/yr can offset ordinary (W-2) income if you actively participate and your MAGI is under $100k (phasing out to $0 by $150k); unused losses carry forward. On sale, claimed depreciation is recaptured at up to 25%, and gains may owe capital-gains tax (a 1031 exchange can defer both). Figures are a year-1 estimate at your 24.0% rate — not tax advice; consult a CPA.
Schools (NCES district)
No district data.
Livability — New York
- Score
- 75/100
- State rank
- #268
- US rank
- #4188
Category grades
Schools grade is shown separately in the Schools card above.
Census & demographics
- Census place
- New York, NY
- County
- New York County · 1,599,927 people
- City population
- 7,731,280
- Metro
- New York-Newark-Jersey City, NY-NJ-PA
- Population (ZIP)
- 52,971
- Household income
- $140,381
- Rent vs Own
- Severe rent burden
- 5269.0
Population outlook (New York County) Hauer SSP2
- Today (2025)
- 1,825,725 people
- By 2030
- 1,904,611 · +4.3%
- By 2040
- 2,052,719 · +12.4%
- By 2050
- 2,206,601 · +20.9%
- By 2075
- 2,509,427 · +37.4%
- By 2100
- 2,702,933 · +48.0%
Race, ethnicity, and origin ACS 2023
- Neighborhood character
- Diverse neighborhood (Simpson 0.60)
- Race & ethnicity
- White 59% Asian 20% Two or more races 11% Hispanic / Latino 11% Black 4%
- Hispanic origin (detail)
- Puerto Rican 3%
- Common ancestry
- Romanian 4% Scotch-Irish 4% Lithuanian 2%
- Foreign-born
- 26% · Canada, China, South Korea
- Languages at home
- 71% English-only · Spanish 9% Other Indo-European 6% Chinese 5%
Political lean MEDSL · New York
- 2024 margin
- Solid D (+64.8) · D 82.4% · R 17.6%
- 2008→2024 swing
- -7.4pp toward R · 2008: 72.2pp · 2024: 64.8pp
- All cycles
- 2024: D+64.8 2020: D+74.5 2016: D+77.2 2012: D+69.6 2008: D+72.2
Not yet ingested
- Civics
- —
Market trends
- HPI YoY
- ▲ 2.70%
- Current HPI
- 313.0343
- Rent YoY
- ▲ 5.42%
- Metro
- New York-Newark-Jersey City, NY-NJ-PA
- State GDP YoY
- ▲ 2.60%
- F500 in state
- 92
Industry mix (Fortune 500 HQ in NY)
| Industry | F500 HQs | Revenue |
|---|---|---|
| Financial Services | 10 | $950B |
|
||
| Consumer Goods | 9 | $162B |
|
||
| Insurance | 4 | $225B |
|
||
| Telecommunications | 2 | $144B |
|
||
| Pharmaceuticals | 2 | $112B |
|
||
| Media / Entertainment | 2 | $69B |
|
||
Price history
+28.6% since first listed4 events — show timeline
- 2026-04-23 Price Changed $450,000 RLS at REBNY
- 2026-04-23 Price Changed $420,000 RLS at REBNY
- 2026-04-23 Relisted — RLS at REBNY
- 2026-02-12 Listed $350,000 RLS at REBNY
Cash-flow waterfall
monthlySold comps — $/sqft
last 12 mo · ≤1 miLoading sold comps…