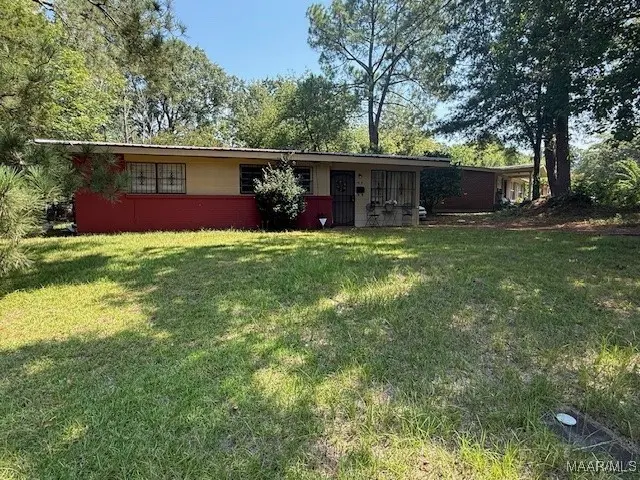
3261 Upchurch Cir · Montgomery, AL
Flood risk 1/10 · Minimal
- FEMA flood zone
- X (unshaded)
- Chance of flooding over 30 yrs
- 0.0%
- Est. flood insurance / yr
- $507 – $1,088
Fire risk 1/10 · Minimal
- Est. fire insurance / yr
- $916 – $1,700
Heat risk 7/10 · Major
- Hot days now (above 108°F)
- 7 days/yr
- Hot days in 30 yrs
- 20 days/yr
Wind risk 8/10 · Major
- Chance of severe wind over 30 yrs
- 80.0%
Air-quality risk 2/10 · Minimal
- Unhealthy air days now
- 1 days/yr
- Unhealthy air days in 30 yrs
- 1 days/yr
Risk factors via First Street. Map © Google.
Why this score? — see what drove the B- grade
The composite is a weighted blend of 9 inputs, each scored 0–100. Each bar is that input's sub-score; the figure is the points it added to the 100-point composite (weight × sub-score).
- Cash flow +30.0/30.0
- 1% rule +10.0/10.0
- DSCR +10.0/10.0
- ARV discount +7.5/15.0
- Livability +3.2/5.0
- Rent growth +2.5/5.0
- Condition / age +2.5/5.0
- Schools +1.7/10.0
- Appreciation +0.0/10.0
$74,000
🖨 Deal sheet (PDF) 📄 Offer letter ✓ Due diligence
Listing remarks MLS
Investor Special! Don’t miss this well-maintained 3 bedroom, 1 bath home that’s perfect to add to your portfolio. With a flowing floor plan and great bones, this property is ready for your vision—whether you’re looking for your next flip or rental. A solid investment opportunity just waiting for its new owner!
Key facts
- 0.25 acre lot
- Parking
- Built 1955
Neighborhood map
What this means for you Summary
Snapshot
- This is a 3-bed/1.0-bath single-family listed at $74k.
Deal economics
- At list price, monthly cash flow is $435 ($5k/yr) — positive.
- The deal already cash-flows at list — no discount required.
- Meets the 1% rule at list price ($1k rent vs $74k).
- Recommended offer: $65k (12.0% below list) — sets the bar for market timing.
Location & tenants
- Location reads 65/100 on livability (#138 in AL) — a middle-class / working-renter tenant base. Strengths: cost of living A+, housing A+; Watch: employment D, crime F, amenities D-.
- Montgomery County (urban): math 9% / reading 31% proficiency, ranked #106 of 129 in AL (top 82%) — low school quality limits family demand, transient renter base, plan for 1-2y turnover; 70% free/reduced lunch — lower-income household profile, screen leases tightly.
- Zoned schools: Davis Elementary School (math 2% / reading 12%, grade F, #601 of 627 statewide, top 98%, 509 students, 97% FRL, charter); Bellingrath Middle School (math 0% / reading 12%, grade F, #252 of 257 statewide, top 98%, 607 students, 96% FRL, charter); Lanier Senior High School (math 2% / reading 12%, grade F, #265 of 305 statewide, top 89%, 798 students, 94% FRL) — zoned schools average 95% FRL vs 70% district-wide (25 pts higher); higher-poverty schools than district average — tighter screening recommended.
- Zoned-school proficiency averages 7% at this address vs 20% district-wide (-13 pts) — the specific schools serving this property underperform the Montgomery County average; the district grade overstates school quality for this exact location.
- Market conditions: 79 active listings in the ZIP; 21 comparable units currently listed for rent nearby; rentals lingering (median 45d on market — plan ~5-8 weeks vacancy on turnover, expect pricing pressure); 57% of comp listings sitting > 30 days — soft ceiling on asking rent; lower-income renter base — watch delinquency; 460 units permitted in Montgomery County in 2024 (37 in 5+ unit buildings).
Forward outlook
- Local home prices are declining (-3.0%/yr); year-one equity from $512 of loan paydown is wiped out by about $2k of value loss. Plan a longer hold.
- Montgomery County population projected to shrink 8% by 2050 — rents likely to lag national; underwrite the cash flow, not the appreciation.
- At projected returns (-3.0% appreciation + 3.0% rent growth), your $21k cash investment doubles in ~5 years — after that, you're playing with house money.
Negotiation context
- It's been on market 295 days — a 12% lower offer ($65k) is reasonable based on typical stale-listing flexibility.
- 4 sale attempts since 19y ago with the ask held roughly flat each time — persistent listings suggest the price (not the market) is what's stuck; bring a comps-based counter.
- Current owner paid $16k; list at $74k implies a 348% gain — meaningful room to come down on a strong offer.
Risks & watch-outs
- Watch-outs: built in 1955 — expect roof / HVAC / electrical / plumbing capex.
- Climate carrying-cost: severe wind risk, 80% chance of damaging wind over 30y; extreme-heat days projected 7→20/yr by 2055 (HVAC capex compounding) — expect insurance premiums to compound above CPI over the hold.
Questions for the listing agent
- It's been on market 295 days. Have you received any prior offers? Is the seller open to a 12% concession, seller financing, or rate buy-down credit?
- Built in 1955 — when were the roof, HVAC, electrical panel, plumbing, and water heater last replaced?
- Why hasn't it sold? Are there any deal-killer items the seller is aware of (foundation, flood, title, zoning, code violations)?
- Is there a deadline driving the sale (1031 exchange, divorce, estate, relocation)? That informs how much negotiation room exists.
- Crime grade is F in this area — have there been break-ins, vandalism, or insurance claims at this property in the last 3 years? What carrier currently insures it and at what premium?
- What's the average days-on-market for RENTAL listings here right now (not sales)? A rising rental-DOM trend means longer vacancies and softer asking-rent achievability than the comps imply.
- What's the recent tenant-quality profile in this submarket — average credit score on applications, eviction rate, late-payment / NSF rate, and stable-employment percentage? A property-management company in the area should have these aggregated.
- How much new for-sale + rental construction is in the pipeline within 1–3 miles? Heavy new supply typically softens prices + rents 12–24 months out; constrained supply supports both.
Investment metrics
- 1% rule
- 1.52% ✓
- Cap rate
- 13.35%
- Cash-on-cash
- 25.20%
- DSCR
- 2.12
- GRM
- 5.5
CMA / ARV
- ARV (median comp)
- $46,360
- List price
- $74,000
- Delta
- 59.62%
- Verdict
- OVERPRICED
- Comps
- 20 within 1.0 mi
Show comp detail 11 sales within ~0.75 mi
| Address | Dist | Beds/Ba | Sqft | Sold | Price | $/sf | Match |
|---|---|---|---|---|---|---|---|
| 3119 Gaston Ave | 0.20mi | 3/1.0 | 1,112 (+2%) | 12mo | $112,000 | $101 | 76 |
| 3130 Upchurch Cir | 0.16mi | 3/1.0 | 1,190 (+10%) | 5mo | $28,000 | $24 | 73 |
| 3551 Gaston Ave | 0.39mi | 2/1.0 (-1) | 1,056 (-3%) | 22mo | $47,000 | $45 | 53 |
| 3831 Oak St | 0.74mi | 3/1.0 | 1,152 (+6%) | 4mo | $14,900 | $13 | 52 |
| 330 National St | 0.62mi | 2/1.0 (-1) | 1,150 (+6%) | 6mo | $50,000 | $43 | 52 |
| 107 Courtland Dr | 0.43mi | 2/1.0 (-1) | 1,118 (+3%) | 24mo | $42,000 | $38 | 50 |
| 3312 Court St | 0.67mi | 2/1.0 (-1) | 1,022 (-6%) | 14mo | $34,600 | $34 | 42 |
| 1824 S Holt St | 0.43mi | 2/1.0 (-1) | 952 (-12%) | 15mo | $22,000 | $23 | 41 |
| 1555 Sierra St | 0.67mi | 3/1.0 | 1,151 (+6%) | 21mo | $42,700 | $37 | 41 |
| 1374 Bragg St | 0.75mi | 3/1.0 | 988 (-9%) | 13mo | $12,000 | $12 | 39 |
| 1402 Bragg St | 0.73mi | 3/1.0 | 1,232 (+13%) | 18mo | $52,000 | $42 | 29 |
Match score weights: distance 35% · size 25% · config 20% · recency 20%. Top-matched comps best support the ARV.
Projected returns pro-forma
-3.0% appreciation · 3.0% rent growth · sell at horizon
- IRR
- 18.7%
- Equity multiple
- 1.76×
- Total profit
- $15,707
- Equity at exit
- $11,034
- IRR
- 27.0%
- Equity multiple
- 3.38×
- Total profit
- $49,288
- Equity at exit
- $6,398
Cash invested: $20,720 (down + closing). Projections, not guarantees.
Landlord ↔ Tenant lean methodology
- Overall (STATE)
- 90 Strongly Landlord-Friendly
- State Alabama
- 90 Strongly Landlord-Friendly · R+15
- County
- — inherits STATE
- City
- — inherits STATE
ZIP-level market 36105
- Home prices YoY
- -32.6%
- Active inventory
- 79
- Price-to-rent
- 5.5×
Monthly cashflow live
- Estimated rent
- $1,122 high interval (Pro) →
- Mortgage (P&I)
- −$388
- Tax from tax record
- −$32 /mo · $389/yr
- Insurance
- −$31
- HOA
- −$0
- Vacancy / Maint / Mgmt
- −$236
- Net cashflow
- $435
Break-even live
Sensitivity live
| Price | -10% $477 | -5% $456 | +0% $435 | +5% $414 | +10% $393 |
|---|---|---|---|---|---|
| Rent | -10% $347 | -5% $391 | +0% $435 | +5% $480 | +10% $524 |
| Rate | -1.0pp $472 | -0.5pp $454 | base $435 | +0.5pp $416 | +1.0pp $397 |
UW: 25.0% down · 7.5% · 30yr · 1.5% tax · 5.0% vac · 8.0% maint · 8.0% mgmt
Financing live
Cash to close
- Down payment
- $18,500
- Closing costs
- $2,220
- Reserves months
- —
- Total cash needed
- —
Loan-product check · same deal, 3 products live
Conventional
25% down · 7.5% · 30yr
- Down + closing
- —
- Monthly P&I
- —
- Monthly cashflow
- —
- DSCR
- —
- Eligible?
- —
Personal DTI + credit; lowest rate.
DSCR
20% down · 8.5% · 30yr
- Down + closing
- —
- Monthly P&I
- —
- Monthly cashflow
- —
- DSCR
- —
- Eligible?
- —
No personal income docs; deal must DSCR.
Hard money
10% down · 12.0% · 12mo
- Down + closing
- —
- Monthly P&I
- —
- Monthly cashflow
- —
- DSCR
- —
- Eligible?
- —
Short-term bridge; refi at stabilization.
Rent comps 21 comps
| Address | Beds | Baths | Sqft | Rent | $/sqft | DOM | Units | Dist |
|---|---|---|---|---|---|---|---|---|
| 3220 Doris Cir Montgomery, AL | 3.0 | 1.0 | 1139 | $1,100 | $0.97 | 45d | 1 | 0.15mi |
| 718 W Edgemont Ave Unit A Montgomery, AL | 3.0 | 1.0 | 875 | $875 | $1.00 | 45d | 1 | 0.17mi |
| 718 W Edgemont Ave Unit B Montgomery, AL | 2.0 | 1.0 | 875 | $800 | $0.91 | 22d | 1 | 0.17mi |
| 3577 Whiting Ave Montgomery, AL | 3.0 | 1.0 | 1269 | $1,150 | $0.91 | 45d | 1 | 0.43mi |
| 763 Belvedere Dr Montgomery, AL | 3.0 | 1.0 | 1044 | $1,000 | $0.96 | 45d | 1 | 0.70mi |
| 3225 McElvy St Montgomery, AL | 3.0 | 2.0 | 1258 | $1,350 | $1.07 | 15d | 1 | 0.71mi |
| 105 Arlington Rd Unit B Montgomery, AL | 2.0 | 1.0 | 1100 | $925 | $0.84 | 45d | 1 | 0.84mi |
| 2654 Rutland St Montgomery, AL | 3.0 | 1.0 | 1176 | $1,075 | $0.91 | 22d | 1 | 0.84mi |
| 3394 Southmont Dr Unit 3 Montgomery, AL | 2.0 | 1.0 | 810 | $1,050 | $1.30 | 45d | 1 | 0.87mi |
| 3394 Southmont Dr Unit 2 Montgomery, AL | 2.0 | 1.0 | 810 | $1,475 | $1.82 | 45d | 1 | 0.87mi |
| 3338 S Hull St Montgomery, AL | 2.0 | 2.0 | 1311 | $1,150 | $0.88 | 22d | 1 | 1.02mi |
| 4037 Oak St Montgomery, AL | 3.0 | 2.0 | 1314 | $1,450 | $1.10 | 45d | 1 | 1.04mi |
| 24 Flood St Montgomery, AL | 2.0 | 1.0 | 1140 | $1,000 | $0.88 | 22d | 1 | 1.10mi |
| 4148 Edgar D Nixon Ave Montgomery, AL | 4.0 | 1.0 | 1208 | $1,200 | $0.99 | 45d | 1 | 1.12mi |
| 1301 S Perry St Unit A Montgomery, AL | 2.0 | 1.0 | 1100 | $950 | $0.86 | 15d | 1 | 1.21mi |
| 370 Collinwood Ave Montgomery, AL | 3.0 | 1.0 | 1080 | $1,000 | $0.93 | 22d | 1 | 1.25mi |
| 3357 Lexington Rd Montgomery, AL | 2.0 | 1.0 | 1200 | $1,175 | $0.98 | 15d | 1 | 1.29mi |
| 3515 Norman Bridge Rd Unit A Montgomery, AL | 2.0 | 1.0 | 1150 | $1,150 | $1.00 | 45d | 1 | 1.31mi |
| 3608 Wilmington Rd Montgomery, AL | 3.0 | 1.0 | 1160 | $950 | $0.82 | 45d | 1 | 1.31mi |
| 432 Clanton Ave Montgomery, AL | 2.0 | 1.0 | 800 | $995 | $1.24 | 15d | 1 | 1.34mi |
| 3369 Montezuma Rd Montgomery, AL | 3.0 | 1.0 | 1281 | $1,150 | $0.90 | 45d | 1 | 1.47mi |
Listing history 26 events
-
2026-06-21days on market $74,000 Active 295 DOM
-
2026-06-18days on market $74,000 Active 292 DOM
-
2026-06-17days on market $74,000 Active 291 DOM
-
2026-06-16days on market $74,000 Active 290 DOM
-
2026-06-15days on market $74,000 Active 289 DOM
-
2026-06-14days on market $74,000 Active 287 DOM
-
2026-06-13days on market $74,000 Active 286 DOM
-
2026-06-10days on market $74,000 Active 284 DOM
-
2026-06-09days on market $74,000 Active 283 DOM
-
2026-06-08days on market $74,000 Active 282 DOM
-
2026-06-07days on market $74,000 Active 281 DOM
-
2026-06-03days on market $74,000 Active 277 DOM
-
2026-06-02days on market $74,000 Active 276 DOM
-
2026-06-01days on market $74,000 Active 275 DOM
-
2026-05-31days on market $74,000 Active 274 DOM
-
2026-05-30days on market $74,000 Active 273 DOM
-
2025-10-10price $74,000 335-char remark
Show marketing remark (335 chars)
Investor Special! Don’t miss this well-maintained 3 bedroom, 1 bath home that’s perfect to add to your portfolio. With a flowing floor plan and great bones, this property is ready for your vision—whether you’re looking for your next flip or rental. A solid investment opportunity just waiting for its new owner!
-
2025-08-29$75,000 Active 335-char remark
Show marketing remark (335 chars)
Investor Special! Don’t miss this well-maintained 3 bedroom, 1 bath home that’s perfect to add to your portfolio. With a flowing floor plan and great bones, this property is ready for your vision—whether you’re looking for your next flip or rental. A solid investment opportunity just waiting for its new owner!
-
2021-03-08soldstatus $16,500
-
2019-04-24soldstatus $35,000
-
2019-04-19soldstatus $35,000 530-char remark
Show marketing remark (530 chars)
SUPER $4000 PRICE REDUCTION * * EXTRA * EXTRA * READ ALL ABOUT IT!!!DON'T MISS OUT ON THIS OPPORTUNITY TO MAKE THIS PRIZE PROPERTY AN AWESOME INVESTMENT OPPORTUNITY OR YOUR 1ST DREAM HOME * * HOME FEATURES 3BED, 1BATH, GREATRM/DINING COMBO/KITCHEN WITH CABINET SPACE, REFRIGERATOR & STORE * * 2 OUTDOOR STORAGE ROOMS * CARPORT AND 2 SEPARATE DRIVEWAYS * HOME SITS ON A LARGE CURVE LOT AND OFFERS PLENTY OF ROOM FOR OUTDOOR FUN * * DON'T DELAY, CALL ME OR GET WITH YOUR FAVORITE REALTOR TO SEE TODAY & BUY TODAY!!!!
-
2018-12-10$39,500 530-char remark
Show marketing remark (530 chars)
SUPER $4000 PRICE REDUCTION * * EXTRA * EXTRA * READ ALL ABOUT IT!!!DON'T MISS OUT ON THIS OPPORTUNITY TO MAKE THIS PRIZE PROPERTY AN AWESOME INVESTMENT OPPORTUNITY OR YOUR 1ST DREAM HOME * * HOME FEATURES 3BED, 1BATH, GREATRM/DINING COMBO/KITCHEN WITH CABINET SPACE, REFRIGERATOR & STORE * * 2 OUTDOOR STORAGE ROOMS * CARPORT AND 2 SEPARATE DRIVEWAYS * HOME SITS ON A LARGE CURVE LOT AND OFFERS PLENTY OF ROOM FOR OUTDOOR FUN * * DON'T DELAY, CALL ME OR GET WITH YOUR FAVORITE REALTOR TO SEE TODAY & BUY TODAY!!!!
-
2008-09-24soldstatus $22,020
-
2008-08-25soldstatus $21,900
-
2008-01-31$39,900
-
2007-10-04$50,000
ⓘ Source: listings_history table (triggers on properties + properties_extension) + one-shot
backfill from property_details.listing_events for pre-trigger history.
Tax reassessment forecast AL · Resets to sale price
- Current annual tax
- $389 · $32/mo
- Projected year-2 tax
- $389 · $32/mo
- Expected delta
- $0/yr ($0/mo · 0.0%)
ⓘ Screening estimate from a state-policy table — verify with the county assessor before closing.
Climate risk First Street
- Flood 1/10 Low FEMA zone X (unshaded) · 0% chance over 30 yrs
- Wildfire 1/10 Low
- Heat 7/10 Severe 7 d/yr ≥108°F today · 20 d/yr by 30 yrs out
- Wind 8/10 Severe 80% chance of damaging wind over 30 yrs
- Air quality 2/10 Low 1 unhealthy d/yr today · 1 by 30 yrs out
Nearby sold comps map
Loading sold comps map…
Walkable amenities ~0.75 mi
Loading nearby amenities…
Taxation est. · year 1
- Rental income
- $13,466
- − Mortgage interest
- −$4,145
- − Property taxes
- −$389
- − Insurance
- −$370
- − Repairs & maintenance
- −$1,077
- − Management
- −$1,077
- − Depreciation
- −$2,153
- Taxable income
- $4,255
- Est. tax owed @ 24.0%
- −$1,021
- After-tax cash flow
- $4,201/yr
For passive investors: Depreciation is non-cash, so a rental often shows a tax loss while cash-flowing — sheltering income. Rental losses are passive: they offset passive income freely, and up to $25,000/yr can offset ordinary (W-2) income if you actively participate and your MAGI is under $100k (phasing out to $0 by $150k); unused losses carry forward. On sale, claimed depreciation is recaptured at up to 25%, and gains may owe capital-gains tax (a 1031 exchange can defer both). Figures are a year-1 estimate at your 24.0% rate — not tax advice; consult a CPA.
Schools (NCES district)
- District
- Montgomery County
- NCES district ID
- 0102430
- Math proficiency
- 9% ▼ -21.00%
- Reading proficiency
- 31% ▼ -1.00%
- Median HH income
- $43,902
- Composite
- 17.24/100
- National rank
- #9093
- State rank
- #106 of 129 in AL
Livability — Montgomery
- Score
- 65/100
- State rank
- #138
- US rank
- #13416
Category grades
Schools grade is shown separately in the Schools card above.
Census & demographics
- Census place
- Montgomery, AL
- County
- Montgomery County · 190,016 people
- City population
- 175,913
- Metro
- Montgomery, AL
- Population (ZIP)
- 9,207
- Household income
- $41,486
- Rent vs Own
- Severe rent burden
- 679.0
Population outlook (Montgomery County) Hauer SSP2
- Today (2025)
- 224,008 people
- By 2030
- 221,460 · -1.1%
- By 2040
- 214,179 · -4.4%
- By 2050
- 204,912 · -8.5%
- By 2075
- 177,821 · -20.6%
- By 2100
- 145,134 · -35.2%
Race, ethnicity, and origin ACS 2023
- Neighborhood character
- Predominantly Black (83%)
- Race & ethnicity
- Black 83% White 12% Hispanic / Latino 4% Two or more races 3%
- Common ancestry
- Italian 1%
- Foreign-born
- 3% · Canada, South Korea
- Languages at home
- 95% English-only · Spanish 4%
Political lean MEDSL · Montgomery
- 2024 margin
- Solid D (+30.7) · D 64.8% · R 34.1% · Other 1.1%
- 2008→2024 swing
- +11.5pp toward D · 2008: 19.2pp · 2024: 30.7pp
- All cycles
- 2024: D+30.7 2020: D+31.5 2016: D+26.2 2012: D+24.3 2008: D+19.2
Not yet ingested
- Civics
- —
Market trends
- HPI YoY
- ▼ -31.17%
- Current HPI
- 64.4673
- Rent YoY
- —
- Metro
- Montgomery, AL
- State GDP YoY
- ▲ 2.94%
- F500 in state
- 4
Industry mix (Fortune 500 HQ in AL)
| Industry | F500 HQs | Revenue |
|---|---|---|
| Financial Services | 1 | $8B |
|
||
| Healthcare | 1 | $5B |
|
||
Price history
+48.0% since first listed10 events — show timeline
- 2025-10-10 Price Changed $74,000 MAAR
- 2025-08-29 Listed $75,000 MAAR
- 2021-03-08 Sold (Public Records) $16,500 Public Records
- 2019-04-24 Sold (Public Records) $35,000 Public Records
- 2019-04-19 Sold (MLS) $35,000 MAAR
- 2018-12-10 Listed $39,500 MAAR
- 2008-09-24 Sold (Public Records) $22,020 Public Records
- 2008-08-25 Sold (MLS) $21,900 MAAR
- 2008-01-31 Listed $39,900 MAAR
- 2007-10-04 Listed $50,000 MAAR
Property tax history
+12.1%/yrLatest (2025): $389 · +6.9% YoY. Source: county tax records.
Cash-flow waterfall
monthlySold comps — $/sqft
last 12 mo · ≤1 miLoading sold comps…