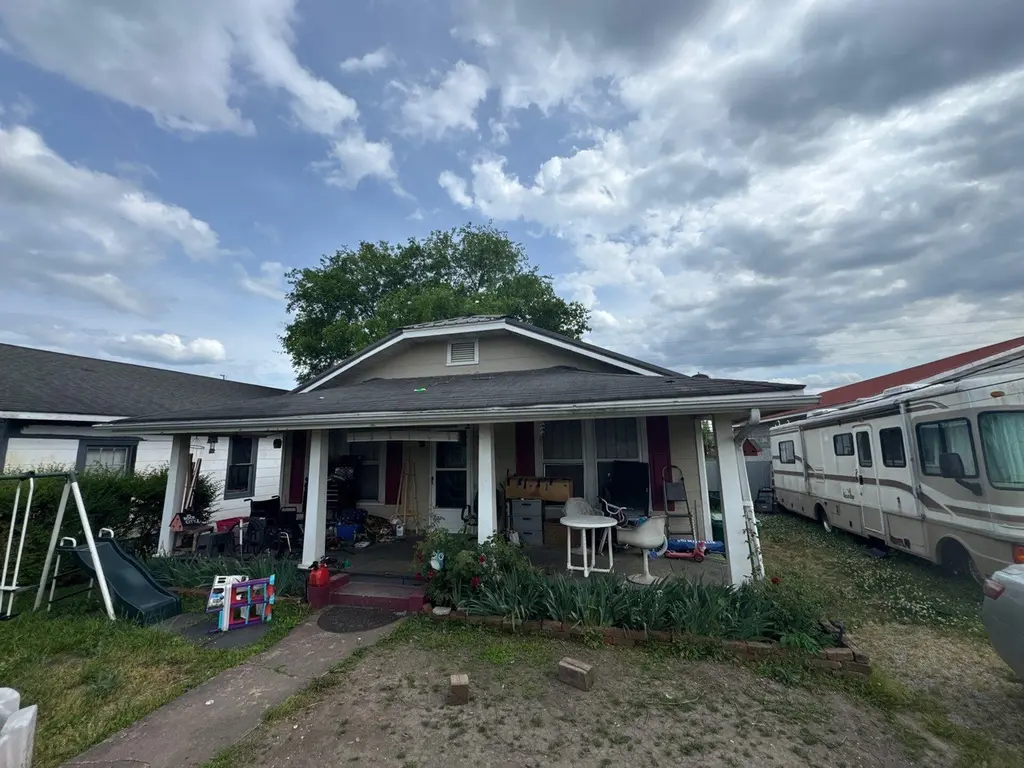
106 Rowland Ave · Rossville, GA
Flood risk 7/10 · Major
- FEMA flood zone
- AE
- Chance of flooding over 30 yrs
- 0.79%
- Est. flood insurance / yr
- $1,737 – $8,500
Fire risk 4/10 · Minor
- Est. fire insurance / yr
- $963 – $1,789
Heat risk 7/10 · Major
- Hot days now (above 104°F)
- 8 days/yr
- Hot days in 30 yrs
- 22 days/yr
Wind risk 4/10 · Minor
- Chance of severe wind over 30 yrs
- 11.0%
Air-quality risk 3/10 · Minor
- Unhealthy air days now
- 2 days/yr
- Unhealthy air days in 30 yrs
- 2 days/yr
Risk factors via First Street. Map © Google.
Why this score? — see what drove the B- grade
The composite is a weighted blend of 9 inputs, each scored 0–100. Each bar is that input's sub-score; the figure is the points it added to the 100-point composite (weight × sub-score).
- Cash flow +30.0/30.0
- 1% rule +10.0/10.0
- DSCR +10.0/10.0
- ARV discount +7.5/15.0
- Rent growth +4.4/5.0
- Livability +2.8/5.0
- Condition / age +2.5/5.0
- Schools +2.3/10.0
- Appreciation +0.0/10.0
$69,000
🖨 Deal sheet 📄 Offer letter ✓ Due diligence
Listing remarks MLS
Equitable Ownership Interest. Contact listing agent for details. This home is ready for renovation. It has a metal roof with no leaks, a newer AC, and the foundation and subfloor are solid. It will need updates to the baths and flooring. It also features a flat, fenced-in yard. This property is being sold as-is.
Key facts
- Newer ac
- Flat fenced-in yard
- Metal roof
Tags
Neighborhood map
What this means for you Summary
Snapshot
- This is a 3-bed/1.0-bath single-family listed at $69k.
Deal economics
- At list price, monthly cash flow is $131 ($2k/yr) — positive.
- The deal already cash-flows at list — no discount required.
- Meets the 1% rule at list price ($1k rent vs $69k).
- Recommended offer: $68k (1.5% below list) — sets the bar for market timing.
- Cap rate 16.0% vs local median 5.3% in Rossville — top-decile yield for the area; either an underpriced asset or a hidden risk that comps aren't pricing in. Stress-test before assuming the spread holds.
Location & tenants
- Location reads 56/100 on livability (#484 in GA) — a working-class tenant base; expect higher turnover. Strengths: cost of living A+, housing A-, crime B+; Watch: schools F, amenities F, commute F.
- Walker County (rural): math 25% / reading 29% proficiency, ranked #114 of 174 in GA (top 66%) — low school quality limits family demand, transient renter base, plan for 1-2y turnover; 61% free/reduced lunch — lower-income household profile, screen leases tightly.
- Market conditions: Rents rising fast (+7.4%/yr); 425 active listings in the ZIP; 15 comparable units currently listed for rent nearby; rentals at typical pace (median 24d on market — plan ~3-4 weeks tenant-placement turnaround); 347 units permitted in Walker County in 2024 (24 in 5+ unit buildings).
Forward outlook
- Local home prices are declining (-3.0%/yr); year-one equity from $477 of loan paydown is wiped out by about $2k of value loss. Plan a longer hold.
- Walker County population projected at -16% by 2050 — secular population decline; favor cash flow + early exit over multi-decade hold.
- At projected returns (-3.0% appreciation + 7.4% rent growth), your $19k cash investment doubles in ~7 years — after that, you're playing with house money.
Negotiation context
- It's been on market 18 days — a 2% lower offer ($68k) is reasonable based on typical stale-listing flexibility.
- Current owner paid $46k; list at $69k implies a 52% gain — meaningful room to come down on a strong offer.
Risks & watch-outs
- Watch-outs: flood insurance adds $427/mo; built in 1920 — expect roof / HVAC / electrical / plumbing capex.
- Climate carrying-cost: in FEMA flood zone AE (mandatory federal flood insurance); extreme-heat days projected 8→22/yr by 2055 (HVAC capex compounding) — expect insurance premiums to compound above CPI over the hold.
Questions for the listing agent
- Built in 1920 — when were the roof, HVAC, electrical panel, plumbing, and water heater last replaced?
- What's the actual annual flood-insurance premium (NFIP or private), and is the property in a SFHA with mandatory coverage?
- Is there a deadline driving the sale (1031 exchange, divorce, estate, relocation)? That informs how much negotiation room exists.
- Schools are F-rated, which usually means shorter tenancies and higher turnover. Who's the typical renter profile here, and what's been the actual vacancy rate?
- What's the average days-on-market for RENTAL listings here right now (not sales)? A rising rental-DOM trend means longer vacancies and softer asking-rent achievability than the comps imply.
- What's the recent tenant-quality profile in this submarket — average credit score on applications, eviction rate, late-payment / NSF rate, and stable-employment percentage? A property-management company in the area should have these aggregated.
- How much new for-sale + rental construction is in the pipeline within 1–3 miles? Heavy new supply typically softens prices + rents 12–24 months out; constrained supply supports both.
Investment metrics
- 1% rule
- 1.86% ✓
- Cap rate
- 15.99%
- Cash-on-cash
- 34.62%
- DSCR
- 2.54
- GRM
- 4.5
CMA / ARV
- ARV (median comp)
- $143,501
- List price
- $69,000
- Delta
- -51.92%
- Verdict
- UNDERPRICED
- Comps
- 20 within 1.0 mi
Show comp detail 12 sales within ~0.75 mi
| Address | Dist | Beds/Ba | Sqft | Sold | Price | $/sf | Match |
|---|---|---|---|---|---|---|---|
| 519 W Gordon Ave | 0.21mi | 2/1.0 (-1) | 841 (+1%) | 12mo | $165,000 | $196 | 74 |
| 106 Beech St | 0.35mi | 2/1.0 (-1) | 848 (+2%) | 11mo | $45,000 | $53 | 66 |
| 801 Lee Ave | 0.54mi | 2/1.0 (-1) | 856 (+3%) | 2mo | $160,000 | $187 | 64 |
| 1611 E 50th St | 0.22mi | 2/1.0 (-1) | 784 (-6%) | 19mo | $104,000 | $133 | 59 |
| 602 Carden Ave | 0.35mi | 2/1.0 (-1) | 880 (+6%) | 16mo | $193,000 | $219 | 56 |
| 803 Lee Ave | 0.55mi | 2/1.5 (-1) | 815 (-2%) | 11mo | $149,000 | $183 | 55 |
| 712 Henderson Ave | 0.52mi | 2/1.0 (-1) | 928 (+11%) | 2mo | $135,000 | $145 | 50 |
| 102 Mt View Dr | 0.75mi | 2/1.0 (-1) | 817 (-2%) | 9mo | $90,000 | $110 | 50 |
| 215 Spruce St | 0.61mi | 2/1.0 (-1) | 776 (-7%) | 17mo | $77,000 | $99 | 41 |
| 807 Richmond Ave | 0.59mi | 2/1.0 (-1) | 720 (-14%) | 9mo | $147,000 | $204 | 37 |
| 400 Richmond Avenue Ave | 0.36mi | 2/1.0 (-1) | 950 (+14%) | 21mo | $74,000 | $78 | 37 |
| 824 Henderson Ave | 0.68mi | 2/1.0 (-1) | 750 (-10%) | 20mo | $155,000 | $207 | 30 |
Match score weights: distance 35% · size 25% · config 20% · recency 20%. Top-matched comps best support the ARV.
Projected returns pro-forma
-3.0% appreciation · 7.44% rent growth · sell at horizon
- IRR
- 4.2%
- Equity multiple
- 1.18×
- Total profit
- $3,412
- Equity at exit
- $10,288
- IRR
- 19.4%
- Equity multiple
- 3.16×
- Total profit
- $41,741
- Equity at exit
- $5,966
Cash invested: $19,320 (down + closing). Projections, not guarantees.
Landlord ↔ Tenant lean methodology
- Overall (STATE)
- 90 Strongly Landlord-Friendly
- State Georgia
- 90 Strongly Landlord-Friendly · R+3
- County
- — inherits STATE
- City
- — inherits STATE
ZIP-level market 30741
- Home prices YoY
- -30.7%
- Rents YoY
- 7.4%
- Active inventory
- 425
- Price-to-rent
- 4.5×
Monthly cashflow live
- Estimated rent
- $1,284 high interval (Pro) →
- Mortgage (P&I)
- −$362
- Tax from tax record
- −$66 /mo · $793/yr
- Insurance
- −$29
- Flood insurance flood zone
- −$427 /mo · $5,118/yr
- HOA
- −$0
- Vacancy / Maint / Mgmt
- −$270
- Net cashflow
- $131
Break-even live
UW: 25.0% down · 7.5% · 30yr · 1.5% tax · 5.0% vac · 8.0% maint · 8.0% mgmt
Financing live
Cash to close
- Down payment
- $17,250
- Closing costs
- $2,070
- Reserves months
- —
- Total cash needed
- —
Loan-product check · same deal, 3 products live
Conventional
25% down · 7.5% · 30yr
- Down + closing
- —
- Monthly P&I
- —
- Monthly cashflow
- —
- DSCR
- —
- Eligible?
- —
Personal DTI + credit; lowest rate.
DSCR
20% down · 8.5% · 30yr
- Down + closing
- —
- Monthly P&I
- —
- Monthly cashflow
- —
- DSCR
- —
- Eligible?
- —
No personal income docs; deal must DSCR.
Hard money
10% down · 12.0% · 12mo
- Down + closing
- —
- Monthly P&I
- —
- Monthly cashflow
- —
- DSCR
- —
- Eligible?
- —
Short-term bridge; refi at stabilization.
Rent comps 15 comps
| Address | Beds | Baths | Sqft | Rent | $/sqft | DOM | Units | Dist |
|---|---|---|---|---|---|---|---|---|
| 515 W Gordon Ave Rossville, GA | 2.0 | 1.0 | 906 | $999 | $1.10 | 43d | 1 | 0.20mi |
| 505 Flegal Ave Rossville, GA | 2.0 | 1.0 | 768 | $1,050 | $1.37 | 23d | 1 | 0.27mi |
| 304 Cherry St Rossville, GA | 2.0 | 1.0 | 982 | $1,675 | $1.71 | 43d | 1 | 0.50mi |
| 804 Henderson Ave Rossville, GA | 2.0 | 1.0 | 948 | $1,025 | $1.08 | 13d | 1 | 0.59mi |
| 817 Henderson Ave Rossville, GA | 2.0 | 1.0 | 844 | $1,150 | $1.36 | 13d | 1 | 0.66mi |
| 1591 Park City Rd Apt E15 Rossville, GA | 2.0 | 1.0 | 1050 | $1,145 | $1.09 | 23d | 1 | 0.85mi |
| 1007 Glentana St Lot 62 Rossville, GA | 2.0 | 2.0 | 840 | $35,995 | $42.85 | 43d | 1 | 0.90mi |
| 813 Chickamauga Ave Unit A Rossville, GA | 2.0 | 1.0 | 900 | $1,099 | $1.22 | 23d | 1 | 0.97mi |
| 108 Suggs St Rossville, GA | 2.0 | 1.0 | 900 | $1,525 | $1.69 | 13d | 1 | 1.05mi |
| 819 Asterwood Dr Unit B Rossville, GA | 2.0 | 2.0 | 975 | $1,445 | $1.48 | 13d | 1 | 1.24mi |
| 107 Stegall St Rossville, GA | 2.0 | 1.5 | 986 | $1,149 | $1.17 | 13d | 1 | 1.28mi |
| 340 Alpine Dr Rossville, GA | 2.0 | 1.0 | 836 | $1,275 | $1.53 | 13d | 1 | 1.31mi |
| 5200 Fagan St Chattanooga, TN | 3.0 | 1.0 | 816 | $1,350 | $1.65 | 23d | 1 | 1.36mi |
| 1422 Wilson Rd Rossville, GA | 2.0 | 1.0 | 885 | $1,050 | $1.19 | 23d | 1 | 1.42mi |
| 1422 Wilson Rd Rossville, GA | 2.0 | 1.0 | 885 | $1,050 | $1.19 | 43d | 1 | 1.42mi |
Listing history 3 events
-
2026-05-15price $69,000 313-char remark
-
2026-05-11$79,000 Active 313-char remark
Show marketing remark (316 chars)
Equitable Ownership Interest. Contact listing agent for details. This home is ready for renovation. It has a metal roof with no leaks, a newer AC, and the foundation and subfloor are solid. It will need updates to the baths and flooring. It also features a flat, fenced-in yard. This property is being sold as-is.
-
2018-06-05soldstatus $45,500
ⓘ Source: listings_history table (triggers on properties + properties_extension) + one-shot
backfill from property_details.listing_events for pre-trigger history.
Tax reassessment forecast GA · Resets to sale price
- Current annual tax
- $793 · $66/mo
- Projected year-2 tax
- $793 · $66/mo
- Expected delta
- $0/yr ($0/mo · 0.0%)
ⓘ Screening estimate from a state-policy table — verify with the county assessor before closing.
Climate risk First Street
- Flood 7/10 Severe FEMA zone AE · 79% chance over 30 yrs
- Wildfire 4/10 Moderate
- Heat 7/10 Severe 8 d/yr ≥104°F today · 22 d/yr by 30 yrs out
- Wind 4/10 Moderate 11% chance of damaging wind over 30 yrs
- Air quality 3/10 Moderate 2 unhealthy d/yr today · 2 by 30 yrs out
Nearby sold comps map
Loading sold comps map…
Walkable amenities ~0.75 mi
Loading nearby amenities…
Taxation est. · year 1
- Rental income
- $15,403
- − Mortgage interest
- −$3,865
- − Property taxes
- −$793
- − Insurance
- −$5,464
- − Repairs & maintenance
- −$1,232
- − Management
- −$1,232
- − Depreciation
- −$2,007
- Taxable income
- $810
- Est. tax owed @ 24.0%
- −$194
- After-tax cash flow
- $1,376/yr
For passive investors: Depreciation is non-cash, so a rental often shows a tax loss while cash-flowing — sheltering income. Rental losses are passive: they offset passive income freely, and up to $25,000/yr can offset ordinary (W-2) income if you actively participate and your MAGI is under $100k (phasing out to $0 by $150k); unused losses carry forward. On sale, claimed depreciation is recaptured at up to 25%, and gains may owe capital-gains tax (a 1031 exchange can defer both). Figures are a year-1 estimate at your 24.0% rate — not tax advice; consult a CPA.
Schools (NCES district)
- District
- Walker County
- NCES district ID
- 1305370
- Math proficiency
- 25% ▼ -10.00%
- Reading proficiency
- 29% ▼ -10.00%
- Median HH income
- $39,889
- Composite
- 22.74/100
- National rank
- #8035
- State rank
- #114 of 174 in GA
Livability — Rossville
- Score
- 56/100
- State rank
- #484
- US rank
- #22540
Category grades
Schools grade is shown separately in the Schools card above.
Census & demographics
- Census place
- Rossville, GA
- County
- Walker County · 48,831 people
- City population
- 30,041
- Metro
- Chattanooga, TN-GA
- Population (ZIP)
- 30,041
- Household income
- $58,834
- Rent vs Own
- Severe rent burden
- 834.0
Population outlook (Walker County) Hauer SSP2
- Today (2025)
- 66,050 people
- By 2030
- 64,305 · -2.6%
- By 2040
- 60,127 · -9.0%
- By 2050
- 55,551 · -15.9%
- By 2075
- 44,886 · -32.0%
- By 2100
- 34,015 · -48.5%
Race, ethnicity, and origin ACS 2023
- Neighborhood character
- Predominantly White (86%)
- Race & ethnicity
- White 86% Black 5% Two or more races 5% Hispanic / Latino 5%
- Common ancestry
- Slovak 3% Iranian 2% Italian 1%
- Foreign-born
- 2% · Canada
- Languages at home
- 96% English-only · Spanish 3%
Political lean MEDSL · Walker
- 2024 margin
- Solid R (+59.3) · D 20.1% · R 79.4%
- 2008→2024 swing
- -12.5pp toward R · 2008: -46.8pp · 2024: -59.3pp
- All cycles
- 2024: R+59.3 2020: R+59.3 2016: R+61.5 2012: R+50.2 2008: R+46.8
Not yet ingested
- Civics
- —
Market trends
- HPI YoY
- ▼ -118.05%
- Current HPI
- 267.0047
- Rent YoY
- ▲ 7.44%
- Metro
- Chattanooga, TN-GA
- State GDP YoY
- ▲ 2.66%
- F500 in state
- 28
Industry mix (Fortune 500 HQ in GA)
| Industry | F500 HQs | Revenue |
|---|---|---|
| Paper / Packaging | 2 | $29B |
|
||
| Retail | 1 | $160B |
|
||
| Transportation / Logistics | 1 | $91B |
|
||
| Airlines | 1 | $62B |
|
||
| Consumer Goods | 1 | $47B |
|
||
| Utilities | 1 | $25B |
|
||
Price history
+51.6% since first listed4 events — show timeline
- 2026-05-30 Listing Removed — REALTRACS as Distributed by MLS Grid
- 2026-05-15 Price Changed $69,000 GCAR
- 2026-05-11 Listed $69,000 REALTRACS as Distributed by MLS Grid
- 2018-06-05 Sold (Public Records) $45,500 Public Records
Property tax history
+4.8%/yrLatest (2025): $793 · -0.0% YoY. Source: county tax records.
Cash-flow waterfall
monthlySold comps — $/sqft
last 12 mo · ≤1 miLoading sold comps…