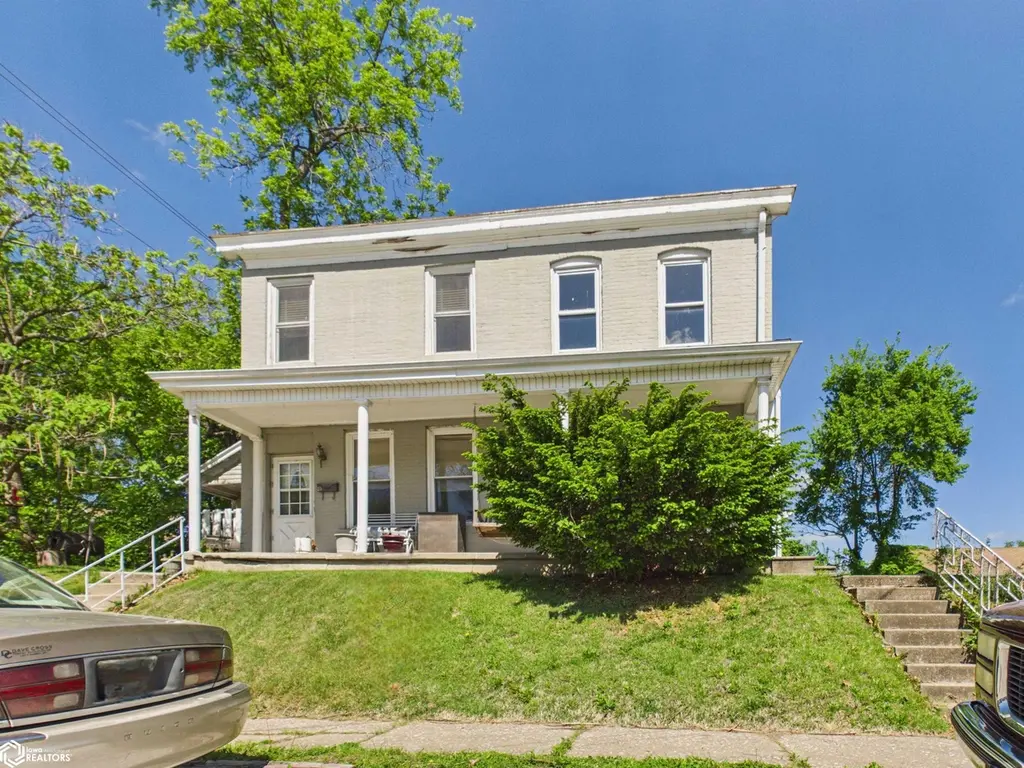
 Duplex
208 S 14th St · Keokuk, IA
Flood risk 1/10 · Minimal
- FEMA flood zone
- X (unshaded)
- Chance of flooding over 30 yrs
- 0.0%
- Est. flood insurance / yr
- $473 – $860
Fire risk 1/10 · Minimal
- Est. fire insurance / yr
- $902 – $1,676
Heat risk 3/10 · Minor
- Hot days now (above 106°F)
- 7 days/yr
- Hot days in 30 yrs
- 16 days/yr
Wind risk 2/10 · Minimal
- Chance of severe wind over 30 yrs
- —
Air-quality risk 2/10 · Minimal
- Unhealthy air days now
- 0 days/yr
- Unhealthy air days in 30 yrs
- 1 days/yr
Risk factors via First Street. Map © Google.
Why this score? — see what drove the B+ grade
The composite is a weighted blend of 9 inputs, each scored 0–100. Each bar is that input's sub-score; the figure is the points it added to the 100-point composite (weight × sub-score).
- Cash flow +30.0/30.0
- ARV discount +15.0/15.0
- 1% rule +10.0/10.0
- DSCR +10.0/10.0
- Schools +4.2/10.0
- Livability +3.9/5.0
- Rent growth +2.5/5.0
- Condition / age +2.5/5.0
- Appreciation +0.0/10.0
$39,900
🖨 Deal sheet (PDF) 📄 Offer letter ✓ Due diligence
Multi-family units
County records classify this as Multi-Family (2-4 Unit). Listing-text estimate: 2 units. confirmed
Listing remarks
Great investment opportunity with strong upside potential! This side-by-side duplex offers the perfect blend of immediate income potential and value-add opportunity. One unit is nearly rent-ready and just needs a little TLC to get it marketable, making it ideal for generating cash flow quickly. The second unit has already been partially rehabbed, giving you a head start on renovations—simply finish it out to maximize rental income or resale value. With solid bones and major improvements already underway, this duplex is primed for someone ready to bring it across the finish line. Don’t miss your chance to turn this property into a profitable asset!
Key facts
- 7,405 sq ft lot
- Built 1870
- Listed 52 days
Property features AI
Exterior
- Utilities: Public water; Public sewer
- Home design: Duplex residential income property; 2 stories
- Construction: Brick construction
- Exterior features: Lot is approximately 0.17 acres (about 7,300 SF)
Interior
- Heating & cooling: Forced air heating
- Interior features: Has basement; Forced air heating
Neighborhood map
What this means for you Summary
Snapshot
- This is a 2 × 2-bed/1-bath units multifamily listed at $40k.
Deal economics
- At list price, monthly cash flow is $887 ($11k/yr) — positive. Per door: $443/mo.
- The deal already cash-flows at list — no discount required.
- Meets the 1% rule at list price ($2k rent vs $40k).
- Recommended offer: $39k (3.0% below list) — sets the bar for market timing.
- Cap rate 33.0% vs local median 8.2% in Keokuk — top-decile yield for the area; either an underpriced asset or a hidden risk that comps aren't pricing in. Stress-test before assuming the spread holds.
Location & tenants
- Location reads 77/100 on livability (#166 in IA, #3,002 nationally) — a middle-class / working-renter tenant base. Strengths: cost of living A+, housing A+, health & safety A+; Watch: amenities C-, commute F, employment F.
- Keokuk Community School District (town): math 48% / reading 54% proficiency, ranked #282 of 289 in IA (top 98%) — acceptable for families but not a draw, mixed tenant base, ~2y average lease.
- Zoned schools: Hawthorne Elementary School (math 62% / reading 37%, grade D, #514 of 616 statewide, top 85%, 464 students, 68% FRL); Keokuk Middle School (math 45% / reading 48%, grade D+, #230 of 246 statewide, top 93%, 377 students, 60% FRL); Keokuk High School (math 48% / reading 63%, grade C, #287 of 336 statewide, top 86%, 598 students, 53% FRL).
- Market conditions: 74 active listings in the ZIP; 15 units permitted in Lee County in 2024 (0 in 5+ unit buildings).
Forward outlook
- Local home prices are declining (-3.0%/yr); year-one equity from $276 of loan paydown is wiped out by about $1k of value loss. Plan a longer hold.
- Lee County population projected at -15% by 2050 — secular population decline; favor cash flow + early exit over multi-decade hold.
- At projected returns (-3.0% appreciation + 3.0% rent growth), your $11k cash investment doubles in ~2 years — after that, you're playing with house money.
Negotiation context
- It's been on market 52 days — a 3% lower offer ($39k) is reasonable based on typical stale-listing flexibility.
Risks & watch-outs
- Watch-outs: property tax is 3.1% of price; built in 1870 — expect roof / HVAC / electrical / plumbing capex.
Questions for the listing agent
- It's been on market 52 days. Have you received any prior offers? Is the seller open to a 3% concession, seller financing, or rate buy-down credit?
- Can we see the unit-by-unit rent roll, current vacancy, and any below-market leases? What's the average tenancy length?
- What capital expenditures (roof, boiler, parking lot, exteriors) have been made in the last 5 years, and what's planned in the next 2?
- Built in 1870 — when were the roof, HVAC, electrical panel, plumbing, and water heater last replaced?
- Property tax is high relative to price — has the assessment been appealed recently, and will the sale trigger a re-assessment?
- Is there a deadline driving the sale (1031 exchange, divorce, estate, relocation)? That informs how much negotiation room exists.
- What's the average days-on-market for RENTAL listings here right now (not sales)? A rising rental-DOM trend means longer vacancies and softer asking-rent achievability than the comps imply.
- What's the recent tenant-quality profile in this submarket — average credit score on applications, eviction rate, late-payment / NSF rate, and stable-employment percentage? A property-management company in the area should have these aggregated.
- How much new apartment / multifamily construction is in the pipeline within 1–3 miles? Heavy new supply (>2% of stock underway) typically softens rents 12–24 months out; light construction supports rent growth.
Investment metrics
- 1% rule
- 3.85% ✓
- Cap rate
- 32.96%
- Cash-on-cash
- 95.22%
- DSCR
- 5.24
- GRM
- 2.2
CMA / ARV
- ARV (median comp)
- $50,904
- List price
- $39,900
- Delta
- -21.62%
- Verdict
- UNDERPRICED
- Comps
- 14 within 1.0 mi
Projected returns pro-forma
-3.0% appreciation · 3.0% rent growth · sell at horizon
- IRR
- 96.1%
- Equity multiple
- 5.48×
- Total profit
- $50,053
- Equity at exit
- $5,949
- IRR
- 98.8%
- Equity multiple
- 11.43×
- Total profit
- $116,515
- Equity at exit
- $3,450
Cash invested: $11,172 (down + closing). Projections, not guarantees.
Landlord ↔ Tenant lean methodology
- Overall (STATE)
- 83 Strongly Landlord-Friendly
- State Iowa
- 83 Strongly Landlord-Friendly · R+6
- County
- — inherits STATE
- City
- — inherits STATE
ZIP-level market 52632
- Home prices YoY
- -25.5%
- Active inventory
- 74
- Price-to-rent
- 4.3×
Monthly cashflow live
- Estimated rent
- $1,537 medium interval (Pro) →
- Mortgage (P&I)
- −$209
- Tax from tax record
- −$102 /mo · $1,222/yr
- Insurance
- −$17
- HOA
- −$0
- Vacancy / Maint / Mgmt
- −$323
- Net cashflow
- $887
Break-even live
Sensitivity live
| Price | -10% $909 | -5% $898 | +0% $887 | +5% $875 | +10% $864 |
|---|---|---|---|---|---|
| Rent | -10% $765 | -5% $826 | +0% $887 | +5% $947 | +10% $1,008 |
| Rate | -1.0pp $907 | -0.5pp $897 | base $887 | +0.5pp $876 | +1.0pp $866 |
2-unit breakdown (identical units grouped — click to expand)
| Units | Beds | Baths | Est. rent |
|---|---|---|---|
| 2× units | 2 | 1 | $1,536 |
| #1 | 2 | 1 | $768 |
| #2 | 2 | 1 | $768 |
| Total (2 units) | $1,537 | ||
UW: 25.0% down · 7.5% · 30yr · 1.5% tax · 5.0% vac · 8.0% maint · 8.0% mgmt
Financing live
Cash to close
- Down payment
- $9,975
- Closing costs
- $1,197
- Reserves months
- —
- Total cash needed
- —
Loan-product check · same deal, 3 products live
Conventional
25% down · 7.5% · 30yr
- Down + closing
- —
- Monthly P&I
- —
- Monthly cashflow
- —
- DSCR
- —
- Eligible?
- —
Personal DTI + credit; lowest rate.
DSCR
20% down · 8.5% · 30yr
- Down + closing
- —
- Monthly P&I
- —
- Monthly cashflow
- —
- DSCR
- —
- Eligible?
- —
No personal income docs; deal must DSCR.
Hard money
10% down · 12.0% · 12mo
- Down + closing
- —
- Monthly P&I
- —
- Monthly cashflow
- —
- DSCR
- —
- Eligible?
- —
Short-term bridge; refi at stabilization.
Listing history 18 events
-
2026-06-21days on market $39,900 Active 52 DOM
-
2026-06-21days on market $39,900 Active 51 DOM
-
2026-06-18days on market $39,900 Active 49 DOM
-
2026-06-17days on market $39,900 Active 48 DOM
-
2026-06-16days on market $39,900 Active 47 DOM
-
2026-06-15days on market $39,900 Active 46 DOM
-
2026-06-13days on market $39,900 Active 44 DOM
-
2026-06-12days on market $39,900 Active 43 DOM
-
2026-06-09days on market $39,900 Active 40 DOM
-
2026-06-08days on market $39,900 Active 39 DOM
-
2026-06-07days on market $39,900 Active 38 DOM
-
2026-06-07days on market $39,900 Active 37 DOM
-
2026-06-04days on market $39,900 Active 34 DOM
-
2026-06-02days on market $39,900 Active 33 DOM
-
2026-06-01days on market $39,900 Active 32 DOM
-
2026-05-31days on market $39,900 Active 31 DOM
-
2026-05-31days on market $39,900 Active 30 DOM
-
2026-04-30$39,900 Active 667-char remark
ⓘ Source: listings_history table (triggers on properties + properties_extension) + one-shot
backfill from property_details.listing_events for pre-trigger history.
Tax reassessment forecast IA · Partial reset (capped growth)
- Current annual tax
- $1,222 · $102/mo
- Projected year-2 tax
- $1,222 · $102/mo
- Expected delta
- $0/yr ($0/mo · 0.0%)
ⓘ Screening estimate from a state-policy table — verify with the county assessor before closing.
Climate risk First Street
- Flood 1/10 Low FEMA zone X (unshaded) · 0% chance over 30 yrs
- Wildfire 1/10 Low
- Heat 3/10 Moderate 7 d/yr ≥106°F today · 16 d/yr by 30 yrs out
- Wind 2/10 Low
- Air quality 2/10 Low 0 unhealthy d/yr today · 1 by 30 yrs out
Nearby sold comps map
Loading sold comps map…
Walkable amenities ~0.75 mi
Loading nearby amenities…
Taxation est. · year 1
- Rental income
- $18,444
- − Mortgage interest
- −$2,235
- − Property taxes
- −$1,222
- − Insurance
- −$200
- − Repairs & maintenance
- −$1,476
- − Management
- −$1,476
- − Depreciation
- −$1,161
- Taxable income
- $10,676
- Est. tax owed @ 24.0%
- −$2,562
- After-tax cash flow
- $8,076/yr
For passive investors: Depreciation is non-cash, so a rental often shows a tax loss while cash-flowing — sheltering income. Rental losses are passive: they offset passive income freely, and up to $25,000/yr can offset ordinary (W-2) income if you actively participate and your MAGI is under $100k (phasing out to $0 by $150k); unused losses carry forward. On sale, claimed depreciation is recaptured at up to 25%, and gains may owe capital-gains tax (a 1031 exchange can defer both). Figures are a year-1 estimate at your 24.0% rate — not tax advice; consult a CPA.
Schools (NCES district)
- District
- Keokuk Community School District
- NCES district ID
- 1915630
- Math proficiency
- 48% ▼ -9.00%
- Reading proficiency
- 54% ▼ -2.00%
- Median HH income
- $36,973
- Composite
- 42.35/100
- National rank
- #3249
- State rank
- #282 of 289 in IA
Livability — Keokuk
- Score
- 77/100
- State rank
- #166
- US rank
- #3002
Category grades
Schools grade is shown separately in the Schools card above.
Census & demographics
- Census place
- Keokuk, IA
- Population (ZIP)
- 11,904
Population outlook (Lee County) Hauer SSP2
- Today (2025)
- 33,813 people
- By 2030
- 32,835 · -2.9%
- By 2040
- 30,690 · -9.2%
- By 2050
- 28,777 · -14.9%
- By 2075
- 25,568 · -24.4%
- By 2100
- 21,983 · -35.0%
Race, ethnicity, and origin ACS 2023
- Neighborhood character
- Predominantly White (91%)
- Race & ethnicity
- White 91% Two or more races 6% Hispanic / Latino 3% Black 3%
- Common ancestry
- Portuguese 3% Italian 2% Lithuanian 2%
- Foreign-born
- 1%
- Languages at home
- 99% English-only · Spanish 1%
Political lean MEDSL · Lee
- 2024 margin
- Strong R (+27.8) · D 35.0% · R 62.9% · Other 2.1%
- 2008→2024 swing
- -43.8pp toward R · 2008: 16.0pp · 2024: -27.8pp
- All cycles
- 2024: R+27.8 2020: R+19.3 2016: R+16.1 2012: D+16.0 2008: D+16.0
Not yet ingested
- Civics
- —
Market trends
- HPI YoY
- ▼ -41.80%
- Current HPI
- 122.2866
- Rent YoY
- —
- Metro
- —
- State GDP YoY
- ▲ 2.48%
- F500 in state
- 4
Industry mix (Fortune 500 HQ in IA)
| Industry | F500 HQs | Revenue |
|---|---|---|
| Financial Services | 1 | $16B |
|
||
| Retail / Convenience | 1 | $15B |
|
||
Price history
1 event — show timeline
- 2026-04-30 Listed $39,900 IAR
Property tax history
+3.4%/yrLatest (2025): $1,222 · +5.7% YoY. Source: county tax records.
Cash-flow waterfall
monthlySold comps — $/sqft
last 12 mo · ≤1 miLoading sold comps…