 6-Plex
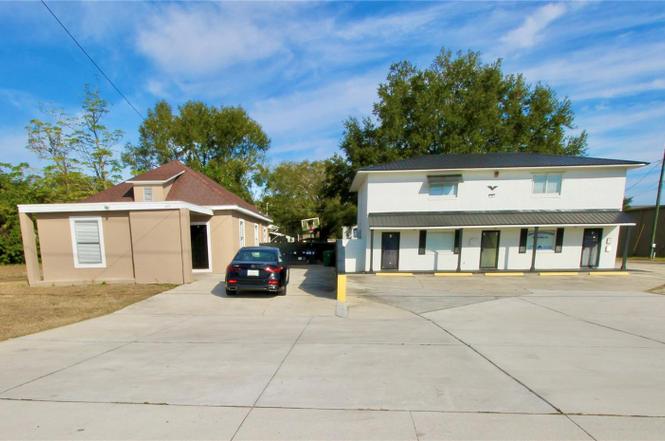
608 Dundee Rd · Dundee, FL
Flood risk No data
- FEMA flood zone
- —
- Chance of flooding over 30 yrs
- —
- Est. flood insurance / yr
- —
Fire risk No data
- Est. fire insurance / yr
- —
Heat risk No data
- Hot days now (above threshold)
- —
- Hot days in 30 yrs
- —
Wind risk No data
- Chance of severe wind over 30 yrs
- —
Air-quality risk No data
- Unhealthy air days now
- —
- Unhealthy air days in 30 yrs
- —
Risk factors via First Street. Map © Google.
Why this score? — see what drove the B+ grade
The composite is a weighted blend of 9 inputs, each scored 0–100. Each bar is that input's sub-score; the figure is the points it added to the 100-point composite (weight × sub-score).
- Cash flow +30.0/30.0
- DSCR +10.0/10.0
- Appreciation +10.0/10.0
- 1% rule +9.5/10.0
- ARV discount +7.5/15.0
- Schools +3.5/10.0
- Livability +3.2/5.0
- Rent growth +2.5/5.0
- Condition / age +2.5/5.0
$724,900
🖨 Deal sheet 📄 Offer letter ✓ Due diligence
Multi-family units
County records classify this as Multi-Family (5+ Unit). Listing-text estimate: 6 units. confirmed
5+ unit building — per-unit beds/baths from public records are typically unavailable; the breakdown below (if shown) is an estimate from the listing text.
Listing remarks
This 6-unit residential income-producing property is an excellent opportunity with strong cash-flow that's located on Dundee Road, leading directly into the fast-growing town of Dundee! Boasting a 9.64% cap rate at CURRENT occupancy & a PROJECTED 12.70% cap rate at full occupancy, this property significantly exceeds the typical 5–8% multifamily cap rate range seen across Florida, offering investors an exceptional return from day one! With a total projected monthly income of $8,850, this property delivers a standout return on investment & has the ability to pay for itself before you even know it. Sitting on just over 1/3 of an acre, the property offers plenty of parking &a
Key facts
- New metal roof
- Recently updated
- Nice kitchenettes
Tags
Property features AI
Finance
- Other: Total living area and building area reported in public records; Directions: Turn east off Hwy 27 onto Dundee Road (County Road 542); property located on the left
- Financial info: Gross income reported at $106,200; Annual net income reported at $95,591; Annual expenses reported at $10,609; Pro forma rents by unit type: 3-bed $1,850; 2-bed $1,500; studios range $1,250–$1,500
- HOA & community: No association; Street lights in the community
Exterior
- Parking: Open driveway parking
- Utilities: Public water (multiple meters); Septic tank sewer; Electricity connected; Cable connected; Broadband/High-speed internet available; Water connected
- Home design: Residential income property (multi-family 5+); Two levels; Completed condition; Zoned C-1
- Construction: Block, stucco, and frame construction; Metal and shingle roofing; Block foundation with crawlspace; Total of 2 buildings on the property
- Exterior features: Covered patio/porch; Sidewalk; Paved road access; Property sits on approximately 0.34 acre (90 x 60)
Interior
- Kitchen: Cooktop; Range; Refrigerator
- Bedrooms: Total of 5 bedrooms; Unit mix includes one 3-bedroom unit, one 2-bedroom unit, and four studio units
- Flooring: Laminate; Tile; Vinyl
- Bathrooms: Multiple full bathrooms across units (each unit lists 1 bath)
- Heating & cooling: Central heating; Central air conditioning; Mini-split unit(s)
- Interior features: Ceiling fans; Eat-in kitchen; Living room / dining room combo; Split bedroom floorplan; Stone counters; Thermostat
- Laundry & utility: Laundry area located outside / other location; Electric water heater
Neighborhood map
What this means for you Summary
Snapshot
- This is a 6 × 5-bed/6.0-bath units multifamily listed at $725k.
Deal economics
- At list price, monthly cash flow is $3k ($39k/yr) — positive. Per door: $546/mo.
- The deal already cash-flows at list — no discount required.
- Meets the 1% rule at list price ($10k rent vs $725k).
- Recommended offer: $638k (12.0% below list) — sets the bar for market timing.
Location & tenants
- Location reads 65/100 on livability (#638 in FL) — a middle-class / working-renter tenant base. Strengths: cost of living A+, housing A+, crime B+; Watch: employment D+, schools D, amenities F.
- Polk (suburban): math 39% / reading 43% proficiency, ranked #62 of 73 in FL (top 85%) — families likely to look elsewhere, expect single-tenant / working-renter base with shorter leases.
- Market conditions: 149 active listings in the ZIP; 10,384 units permitted in Polk County in 2024 (1,716 in 5+ unit buildings).
Forward outlook
- In year one you build about $78k of equity ($5k loan paydown + $72k appreciation (10.0% local appreciation)).
- Polk County population projected at +33% by 2050 — long-run rental-demand tailwind backs the buy-and-hold thesis.
- At projected returns (10.0% appreciation + 3.0% rent growth), your $203k cash investment doubles in ~2 years — after that, you're playing with house money.
- By year 2, paydown + projected appreciation supports a ~$125k cash-out refi (75% LTV) — recoverable capital for the next deal without selling this one.
Negotiation context
- It's been on market 136 days — a 12% lower offer ($638k) is reasonable based on typical stale-listing flexibility.
Questions for the listing agent
- It's been on market 136 days. Have you received any prior offers? Is the seller open to a 12% concession, seller financing, or rate buy-down credit?
- Can we see the unit-by-unit rent roll, current vacancy, and any below-market leases? What's the average tenancy length?
- What capital expenditures (roof, boiler, parking lot, exteriors) have been made in the last 5 years, and what's planned in the next 2?
- Why hasn't it sold? Are there any deal-killer items the seller is aware of (foundation, flood, title, zoning, code violations)?
- Is there a deadline driving the sale (1031 exchange, divorce, estate, relocation)? That informs how much negotiation room exists.
- Schools are D-rated, which usually means shorter tenancies and higher turnover. Who's the typical renter profile here, and what's been the actual vacancy rate?
- What's the average days-on-market for RENTAL listings here right now (not sales)? A rising rental-DOM trend means longer vacancies and softer asking-rent achievability than the comps imply.
- What's the recent tenant-quality profile in this submarket — average credit score on applications, eviction rate, late-payment / NSF rate, and stable-employment percentage? A property-management company in the area should have these aggregated.
- How much new apartment / multifamily construction is in the pipeline within 1–3 miles? Heavy new supply (>2% of stock underway) typically softens rents 12–24 months out; light construction supports rent growth.
Investment metrics
- 1% rule
- 1.45% ✓
- Cap rate
- 11.72%
- Cash-on-cash
- 19.38%
- DSCR
- 1.86
- GRM
- 5.8
CMA / ARV
No comps found within radius.
Projected returns pro-forma
10.0% appreciation · 3.0% rent growth · sell at horizon
- IRR
- 38.7%
- Equity multiple
- 3.97×
- Total profit
- $603,753
- Equity at exit
- $653,047
- IRR
- 33.4%
- Equity multiple
- 8.95×
- Total profit
- $1,614,072
- Equity at exit
- $1,408,321
Cash invested: $202,972 (down + closing). Projections, not guarantees.
Landlord ↔ Tenant lean methodology
- Overall (STATE)
- 87 Strongly Landlord-Friendly
- State Florida
- 87 Strongly Landlord-Friendly · R+3
- County
- — inherits STATE
- City
- — inherits STATE
ZIP-level market 33838
- Home prices YoY
- 17.6%
- Active inventory
- 149
- Price-to-rent
- 34.5×
Monthly cashflow live
- Estimated rent
- $10,491 medium interval (Pro) →
- Mortgage (P&I)
- −$3,801
- Tax est. 1.5%
- −$906 /mo · $10,874/yr
- Insurance
- −$302
- HOA
- −$0
- Vacancy / Maint / Mgmt
- −$2,203
- Net cashflow
- $3,278
Break-even live
6-unit breakdown (identical units grouped — click to expand)
| Units | Beds | Baths | Est. rent |
|---|---|---|---|
| 6× units | 5 | 6 | $10,488 |
| #1 | 5 | 6 | $1,748 |
| #2 | 5 | 6 | $1,748 |
| #3 | 5 | 6 | $1,748 |
| #4 | 5 | 6 | $1,748 |
| #5 | 5 | 6 | $1,748 |
| #6 | 5 | 6 | $1,748 |
| Total (6 units) | $10,491 | ||
UW: 25.0% down · 7.5% · 30yr · 1.5% tax · 5.0% vac · 8.0% maint · 8.0% mgmt
Financing live
Cash to close
- Down payment
- $181,225
- Closing costs
- $21,747
- Reserves months
- —
- Total cash needed
- —
Loan-product check · same deal, 3 products live
Conventional
25% down · 7.5% · 30yr
- Down + closing
- —
- Monthly P&I
- —
- Monthly cashflow
- —
- DSCR
- —
- Eligible?
- —
Personal DTI + credit; lowest rate.
DSCR
20% down · 8.5% · 30yr
- Down + closing
- —
- Monthly P&I
- —
- Monthly cashflow
- —
- DSCR
- —
- Eligible?
- —
No personal income docs; deal must DSCR.
Hard money
10% down · 12.0% · 12mo
- Down + closing
- —
- Monthly P&I
- —
- Monthly cashflow
- —
- DSCR
- —
- Eligible?
- —
Short-term bridge; refi at stabilization.
Listing history 14 events
-
2026-06-18days on market $724,900 Active 136 DOM
-
2026-06-17days on market $724,900 Active 135 DOM
-
2026-06-16days on market $724,900 Active 134 DOM
-
2026-06-15days on market $724,900 Active 133 DOM
-
2026-06-13days on market $724,900 Active 131 DOM
-
2026-06-10days on market $724,900 Active 128 DOM
-
2026-06-09days on market $724,900 Active 127 DOM
-
2026-06-08days on market $724,900 Active 126 DOM
-
2026-06-07days on market $724,900 Active 125 DOM
-
2026-06-05days on market $724,900 Active 122 DOM
-
2026-06-03days on market $724,900 Active 120 DOM
-
2026-06-01days on market $724,900 Active 119 DOM
-
2026-05-31days on market $724,900 Active 118 DOM
-
2026-02-02$724,900 Active
ⓘ Source: listings_history table (triggers on properties + properties_extension) + one-shot
backfill from property_details.listing_events for pre-trigger history.
Nearby sold comps map
Loading sold comps map…
Walkable amenities ~0.75 mi
Loading nearby amenities…
Taxation est. · year 1
- Rental income
- $125,892
- − Mortgage interest
- −$40,606
- − Property taxes
- −$10,874
- − Insurance
- −$3,624
- − Repairs & maintenance
- −$10,071
- − Management
- −$10,071
- − Depreciation
- −$21,088
- Taxable income
- $29,558
- Est. tax owed @ 24.0%
- −$7,094
- After-tax cash flow
- $32,245/yr
For passive investors: Depreciation is non-cash, so a rental often shows a tax loss while cash-flowing — sheltering income. Rental losses are passive: they offset passive income freely, and up to $25,000/yr can offset ordinary (W-2) income if you actively participate and your MAGI is under $100k (phasing out to $0 by $150k); unused losses carry forward. On sale, claimed depreciation is recaptured at up to 25%, and gains may owe capital-gains tax (a 1031 exchange can defer both). Figures are a year-1 estimate at your 24.0% rate — not tax advice; consult a CPA.
Schools (NCES district)
- District
- Polk
- NCES district ID
- 1201590
- Math proficiency
- 39% ▼ -11.00%
- Reading proficiency
- 43% ▼ -4.00%
- Median HH income
- $43,979
- Composite
- 34.74/100
- National rank
- #5132
- State rank
- #62 of 73 in FL
Livability — Dundee
- Score
- 65/100
- State rank
- #638
- US rank
- #12542
Category grades
Schools grade is shown separately in the Schools card above.
Census & demographics
- Census place
- Dundee, FL
- City population
- 5,431
- Population (ZIP)
- 5,431
Population outlook (Polk County) Hauer SSP2
- Today (2025)
- 752,975 people
- By 2030
- 804,621 · +6.9%
- By 2040
- 906,117 · +20.3%
- By 2050
- 1,000,476 · +32.9%
- By 2075
- 1,197,520 · +59.0%
- By 2100
- 1,271,518 · +68.9%
Race, ethnicity, and origin ACS 2023
- Neighborhood character
- Diverse neighborhood (Simpson 0.63)
- Race & ethnicity
- Hispanic / Latino 50% White 30% Black 14% Two or more races 7% Asian 3%
- Hispanic origin (detail)
- Mexican 14% Puerto Rican 19% Dominican 6%
- Common ancestry
- Portuguese 1%
- Foreign-born
- 18% · Canada, Guatemala
- Languages at home
- 53% English-only · Spanish 47%
Political lean MEDSL · Polk
- 2024 margin
- Strong R (+20.7) · D 39.2% · R 59.9%
- 2008→2024 swing
- -14.6pp toward R · 2008: -6.1pp · 2024: -20.7pp
- All cycles
- 2024: R+20.7 2020: R+14.4 2016: R+14.1 2012: R+6.8 2008: R+6.1
Not yet ingested
- Civics
- —
Market trends
- HPI YoY
- ▲ 54.34%
- Current HPI
- 363.9764
- Rent YoY
- —
- Metro
- —
- State GDP YoY
- ▲ 3.28%
- F500 in state
- 36
Industry mix (Fortune 500 HQ in FL)
| Industry | F500 HQs | Revenue |
|---|---|---|
| Industrial Technology | 2 | $29B |
|
||
| Insurance | 2 | $17B |
|
||
| Retail | 1 | $60B |
|
||
| Technology Distribution | 1 | $58B |
|
||
| Homebuilding | 1 | $35B |
|
||
| Technology Manufacturing | 1 | $35B |
|
||
Price history
1 event — show timeline
- 2026-02-02 Listed $724,900 Stellar MLS as Distributed by MLS Grid
Cash-flow waterfall
monthlySold comps — $/sqft
last 12 mo · ≤1 miLoading sold comps…