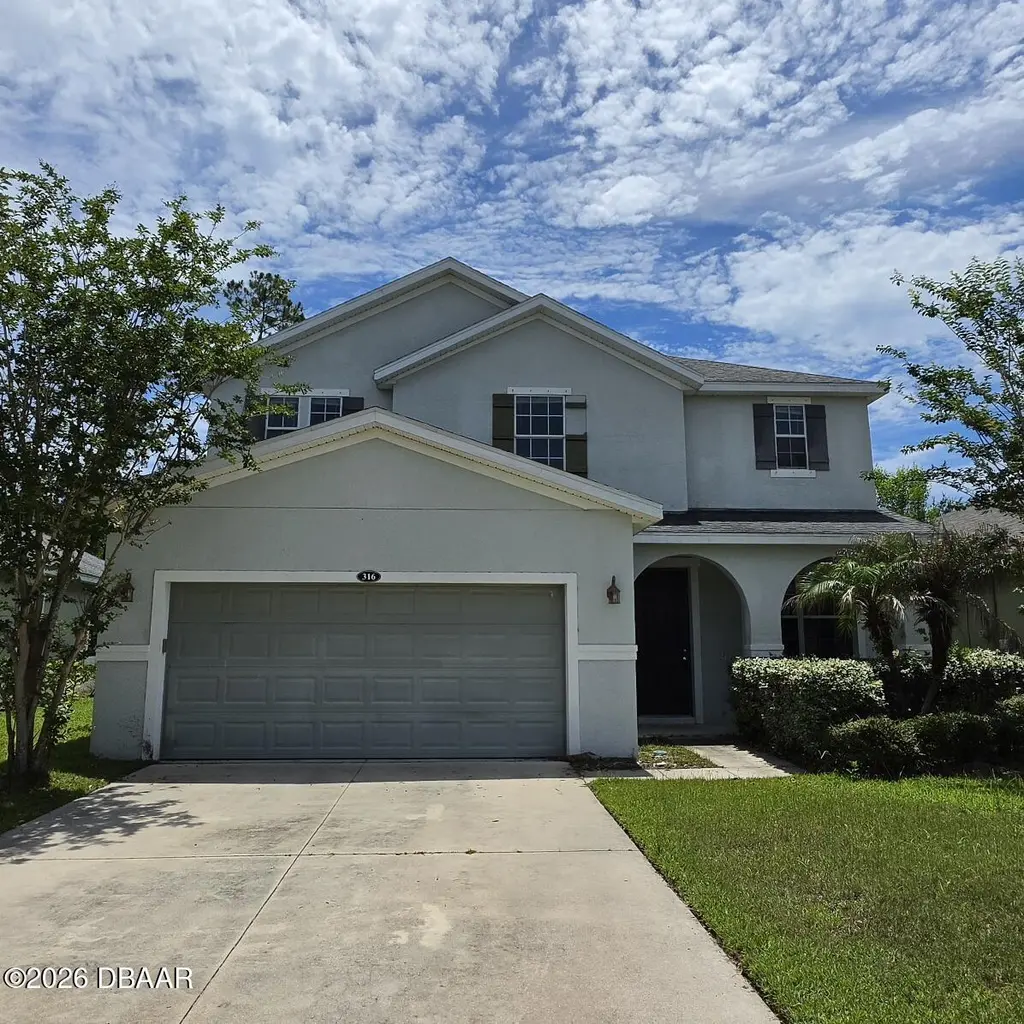
316 Grande Sunningdale Loop · Daytona Beach, FL
Flood risk 1/10 · Minimal
- FEMA flood zone
- X (unshaded)
- Chance of flooding over 30 yrs
- 0.0%
- Est. flood insurance / yr
- $507 – $1,088
Fire risk 6/10 · Moderate
- Est. fire insurance / yr
- $947 – $1,759
Heat risk 9/10 · Severe
- Hot days now (above 106°F)
- 7 days/yr
- Hot days in 30 yrs
- 21 days/yr
Wind risk 10/10 · Severe
- Chance of severe wind over 30 yrs
- 99.0%
Air-quality risk 2/10 · Minimal
- Unhealthy air days now
- 1 days/yr
- Unhealthy air days in 30 yrs
- 1 days/yr
Risk factors via First Street. Map © Google.
Why this score? — see what drove the D+ grade
The composite is a weighted blend of 9 inputs, each scored 0–100. Each bar is that input's sub-score; the figure is the points it added to the 100-point composite (weight × sub-score).
- Cash flow +14.8/30.0
- ARV discount +7.5/15.0
- DSCR +4.5/10.0
- Livability +4.2/5.0
- 1% rule +4.1/10.0
- Appreciation +4.0/10.0
- Rent growth +3.9/5.0
- Schools +3.9/10.0
- Condition / age +2.5/5.0
$316,450
🖨 Deal sheet (PDF) 📄 Offer letter ✓ Due diligence
Listing remarks MLS
Lovingly maintained two-story 4 bedroom. 2.5 bath family home. Home lies within a golf course community close to shopping, medical facilities, ''One Daytona'' & minutes from Tanger Outlets. The home features granite counter tops, stainless steel appliances with an open floor plan & plenty of room for entertaining guests. Vinyl flooring, tile covers the downstairs portion of the home with carpet and tile upstairs in the bedrooms/bathrooms. The laundry room is conveniently located upstairs with the 4 bedrooms. There is a large backyard which allows for pets or a future pool, should you desire. However, there is a beautiful well-maintained community pool that is just around the corner. It also features high performance windows with insulation to help reduce heating and cooling costs.
Key facts
- Fenced back yard
- Owner's suite
- 6,534 sq ft lot
Tags
Property features AI
Finance
- Other: Annual tax noted
- HOA & community: Homeowners association with quarterly fee of $222.60 (about $74.20/month)
Exterior
- Parking: Attached 2-car garage
- Utilities: Public water; Electricity connected; Water connected
- Home design: Single-family residence; Two levels
- Exterior features: Lot dimensions approximately 49 ft x 139 ft; Lot is about 0.15 acres; Residential zoning; Subdivision: Lpga
Interior
- Bedrooms: Total rooms: 2
- Bathrooms: 2 full bathrooms; 1 half bathroom
- Heating & cooling: Central heating (electric); Central air conditioning
- Interior features: Electric water heater
Neighborhood map
What this means for you Summary
Snapshot
- This is a 4-bed/2.5-bath single-family listed at $316k.
Deal economics
- At list price, monthly cash flow is $86 ($1k/yr) — positive.
- The deal already cash-flows at list — no discount required.
- To meet the 1% rule (rent ≥ 1% of price), the offer needs to be $289k (8.6% below list).
- Recommended offer: $289k (8.6% below list) — sets the bar for 1% rule.
Location & tenants
- Location reads 83/100 on livability (#46 in FL, #867 nationally) — a professional / high-income tenant draw. Strengths: amenities A+, commute A+, cost of living A+; Watch: employment D-.
- Volusia (suburban): math 44% / reading 49% proficiency, ranked #47 of 73 in FL (top 64%) — families likely to look elsewhere, expect single-tenant / working-renter base with shorter leases.
- Zoned schools: Champion Elementary School (math 39% / reading 44%, grade F, #1,437 of 2,144 statewide, top 68%, 584 students, 70% FRL); David C. Hinson Sr. Middle School (math 52% / reading 49%, grade C, #246 of 571 statewide, top 44%, 950 students, 52% FRL); Mainland High School (math 30% / reading 37%, grade F, #400 of 667 statewide, top 61%, 1,855 students, 64% FRL).
- Market conditions: Rents rising fast (+5.5%/yr); 335 active listings in the ZIP; 14 comparable units currently listed for rent nearby; rentals at typical pace (median 25d on market — plan ~3-4 weeks tenant-placement turnaround); solid renter incomes; 3,402 units permitted in Volusia County in 2024 (681 in 5+ unit buildings).
- This rent runs 37% of the median local income ($93k/yr) — at the standard rent-burdened threshold; future hikes will face affordability resistance.
Forward outlook
- Local home prices are declining (-2.0%/yr); year-one equity from $2k of loan paydown is wiped out by about $6k of value loss. Plan a longer hold.
- Volusia County population projected at +19% by 2050 — long-run rental-demand tailwind backs the buy-and-hold thesis.
Negotiation context
- Only 7 days on market — expect competitive offers; lowballing is unlikely to land.
- 6 sale attempts since 11y ago with the ask held roughly flat each time — persistent listings suggest the price (not the market) is what's stuck; bring a comps-based counter.
- Current owner paid $256k; 24% above their basis — modest negotiation headroom, anchor on the comps not their cost.
Risks & watch-outs
- Climate carrying-cost: severe wind risk, 99% chance of damaging wind over 30y; major wildfire risk; extreme-heat days projected 7→21/yr by 2055 (HVAC capex compounding) — expect insurance premiums to compound above CPI over the hold.
Questions for the listing agent
- What does the HOA fee cover, when was the last increase, and are there any pending special assessments or reserve-fund shortfalls?
- Is there a deadline driving the sale (1031 exchange, divorce, estate, relocation)? That informs how much negotiation room exists.
- Schools are D-rated, which usually means shorter tenancies and higher turnover. Who's the typical renter profile here, and what's been the actual vacancy rate?
- The area grade is low — what's the realistic commute time and amenity access for the typical tenant pool here? Any planned neighborhood developments (good or bad) we should know about?
- What's the average days-on-market for RENTAL listings here right now (not sales)? A rising rental-DOM trend means longer vacancies and softer asking-rent achievability than the comps imply.
- What's the recent tenant-quality profile in this submarket — average credit score on applications, eviction rate, late-payment / NSF rate, and stable-employment percentage? A property-management company in the area should have these aggregated.
- How much new for-sale + rental construction is in the pipeline within 1–3 miles? Heavy new supply typically softens prices + rents 12–24 months out; constrained supply supports both.
Investment metrics
- 1% rule
- 0.91% ✗
- Cap rate
- 6.62%
- Cash-on-cash
- 1.17%
- DSCR
- 1.05
- GRM
- 9.1
CMA / ARV
No comps found within radius.
Projected returns pro-forma
-1.99% appreciation · 5.46% rent growth · sell at horizon
- IRR
- -6.8%
- Equity multiple
- 0.72×
- Total profit
- $-24,832
- Equity at exit
- $61,617
- IRR
- 3.6%
- Equity multiple
- 1.33×
- Total profit
- $29,413
- Equity at exit
- $52,808
Cash invested: $88,606 (down + closing). Projections, not guarantees.
Landlord ↔ Tenant lean methodology
- Overall (STATE)
- 87 Strongly Landlord-Friendly
- State Florida
- 87 Strongly Landlord-Friendly · R+3
- County
- — inherits STATE
- City
- — inherits STATE
ZIP-level market 32124
- Home prices YoY
- -0.6%
- Rents YoY
- 5.5%
- Active inventory
- 335
- Price-to-rent
- 9.1×
Monthly cashflow live
- Estimated rent
- $2,892 high interval (Pro) →
- Mortgage (P&I)
- −$1,659
- Tax from tax record
- −$333 /mo · $3,994/yr
- Insurance
- −$132
- HOA
- −$74
- Vacancy / Maint / Mgmt
- −$607
- Net cashflow
- $86
Break-even live
Sensitivity live
| Price | -10% $265 | -5% $176 | +0% $86 | +5% $-3 | +10% $-93 |
|---|---|---|---|---|---|
| Rent | -10% $-142 | -5% $-28 | +0% $86 | +5% $201 | +10% $315 |
| Rate | -1.0pp $246 | -0.5pp $167 | base $86 | +0.5pp $4 | +1.0pp $-79 |
UW: 25.0% down · 7.5% · 30yr · 1.5% tax · 5.0% vac · 8.0% maint · 8.0% mgmt
Financing live
Cash to close
- Down payment
- $79,112
- Closing costs
- $9,494
- Reserves months
- —
- Total cash needed
- —
Loan-product check · same deal, 3 products live
Conventional
25% down · 7.5% · 30yr
- Down + closing
- —
- Monthly P&I
- —
- Monthly cashflow
- —
- DSCR
- —
- Eligible?
- —
Personal DTI + credit; lowest rate.
DSCR
20% down · 8.5% · 30yr
- Down + closing
- —
- Monthly P&I
- —
- Monthly cashflow
- —
- DSCR
- —
- Eligible?
- —
No personal income docs; deal must DSCR.
Hard money
10% down · 12.0% · 12mo
- Down + closing
- —
- Monthly P&I
- —
- Monthly cashflow
- —
- DSCR
- —
- Eligible?
- —
Short-term bridge; refi at stabilization.
Rent comps 14 comps
| Address | Beds | Baths | Sqft | Rent | $/sqft | DOM | Units | Dist |
|---|---|---|---|---|---|---|---|---|
| 604 Champion Ridge Dr Daytona Beach, FL | 3.0 | 2.0 | 1761 | $2,299 | $1.31 | 16d | 1 | 0.18mi |
| 2220 Green Valley St Daytona Beach, FL | 3.0 | 2.0 | 1540 | $2,300 | $1.49 | 25d | 1 | 0.69mi |
| 1139 Belle Isle Ln Daytona Beach, FL | 3.0 | 2.0 | 1429 | $2,195 | $1.54 | 16d | 1 | 0.73mi |
| 5135 Magnolia Palm Dr Daytona Beach, FL | 3.0 | 2.0 | 1487 | $2,250 | $1.51 | 12d | 1 | 0.81mi |
| 1231 Belle Isle Ln Daytona Beach, FL | 5.0 | 2.5 | 2112 | $2,650 | $1.25 | 25d | 1 | 0.88mi |
| 1347 Belle Isle Ln Daytona Beach, FL | 4.0 | 2.0 | 1846 | $2,400 | $1.30 | 25d | 1 | 1.01mi |
| 1142 Pacific Dunes Ct Daytona Beach, FL | 4.0 | 3.0 | 2010 | $2,599 | $1.29 | 25d | 1 | 1.02mi |
| 1098 Pacific Dunes Ct Daytona Beach, FL | 4.0 | 2.5 | 2576 | $3,000 | $1.16 | 25d | 1 | 1.04mi |
| 1100 Sand Trap Ct Daytona Beach, FL | 4.0 | 2.0 | 1935 | $2,600 | $1.34 | 25d | 1 | 1.04mi |
| 1122 Cabot Cliffs Dr Daytona Beach, FL | 3.0 | 2.0 | 1432 | $3,200 | $2.23 | 16d | 1 | 1.08mi |
| 1143 Cabot Cliffs Dr Daytona Beach, FL | 5.0 | 2.5 | 2370 | $3,050 | $1.29 | 12d | 1 | 1.11mi |
| 1203 Cabot Cliffs Dr Daytona Beach, FL | 5.0 | 2.5 | 2355 | $2,750 | $1.17 | 22d | 1 | 1.11mi |
| 1153 Sand Trap Ct Daytona Beach, FL | 4.0 | 2.0 | 1936 | $2,395 | $1.24 | 22d | 1 | 1.13mi |
| 132 Lost Ball Dr Daytona Beach, FL | 3.0 | 2.0 | 1484 | $2,300 | $1.55 | 25d | 1 | 1.50mi |
HOA detail
- Monthly dues
- $74 · $888/yr
- Likely covers
- pool
Listing history 6 events
-
2026-06-22days on market $316,450 Active 7 DOM
-
2026-06-18days on market $316,450 Active 4 DOM
-
2026-06-17days on market $316,450 Active 3 DOM
-
2026-06-16days on market $316,450 Active 2 DOM
-
2026-06-15remarks 326-char remark
-
2026-06-15$316,450 Active 1 DOM
ⓘ Source: listings_history table (triggers on properties + properties_extension) + one-shot
backfill from property_details.listing_events for pre-trigger history.
Tax reassessment forecast FL · Resets to sale price
- Current annual tax
- $3,994 · $333/mo
- Projected year-2 tax
- $3,994 · $333/mo
- Expected delta
- $0/yr ($0/mo · 0.0%)
ⓘ Screening estimate from a state-policy table — verify with the county assessor before closing.
Climate risk First Street
- Flood 1/10 Low FEMA zone X (unshaded) · 0% chance over 30 yrs
- Wildfire 6/10 Major
- Heat 9/10 Extreme 7 d/yr ≥106°F today · 21 d/yr by 30 yrs out
- Wind 10/10 Extreme 99% chance of damaging wind over 30 yrs
- Air quality 2/10 Low 1 unhealthy d/yr today · 1 by 30 yrs out
Nearby sold comps map
Loading sold comps map…
Walkable amenities ~0.75 mi
Loading nearby amenities…
Taxation est. · year 1
- Rental income
- $34,701
- − Mortgage interest
- −$17,726
- − Property taxes
- −$3,994
- − Insurance
- −$1,582
- − Repairs & maintenance
- −$2,776
- − Management
- −$2,776
- − HOA
- −$888
- − Depreciation
- −$9,206
- Taxable loss
- −$4,248
- Est. tax savings @ 24.0%
- +$1,019
- After-tax cash flow
- $2,055/yr
For passive investors: Depreciation is non-cash, so a rental often shows a tax loss while cash-flowing — sheltering income. Rental losses are passive: they offset passive income freely, and up to $25,000/yr can offset ordinary (W-2) income if you actively participate and your MAGI is under $100k (phasing out to $0 by $150k); unused losses carry forward. On sale, claimed depreciation is recaptured at up to 25%, and gains may owe capital-gains tax (a 1031 exchange can defer both). Figures are a year-1 estimate at your 24.0% rate — not tax advice; consult a CPA.
Schools (NCES district)
- District
- Volusia
- NCES district ID
- 1201920
- Math proficiency
- 44% ▼ -9.00%
- Reading proficiency
- 49% ▼ -3.00%
- Median HH income
- $42,946
- Composite
- 39.2/100
- National rank
- #4019
- State rank
- #47 of 73 in FL
Livability — Daytona Beach
- Score
- 83/100
- State rank
- #46
- US rank
- #867
Category grades
Schools grade is shown separately in the Schools card above.
Census & demographics
- Census place
- Daytona Beach, FL
- County
- Volusia County · 556,871 people
- City population
- 67,539
- Metro
- Deltona-Daytona Beach-Ormond Beach, FL
- Population (ZIP)
- 11,409
- Household income
- $92,616
- Rent vs Own
- Severe rent burden
- 54.0
Population outlook (Volusia County) Hauer SSP2
- Today (2025)
- 572,749 people
- By 2030
- 598,695 · +4.5%
- By 2040
- 644,880 · +12.6%
- By 2050
- 681,451 · +19.0%
- By 2075
- 759,957 · +32.7%
- By 2100
- 778,902 · +36.0%
Race, ethnicity, and origin ACS 2023
- Neighborhood character
- Predominantly White (71%)
- Race & ethnicity
- White 71% Black 20% Hispanic / Latino 5% Asian 2% Two or more races 1%
- Common ancestry
- Romanian 3% Italian 2% Portuguese 1%
- Foreign-born
- 10% · Canada, Mexico, South Korea
- Languages at home
- 91% English-only · Spanish 4% Other Asian/Pacific 1% Other Indo-European 1%
Political lean MEDSL · Volusia
- 2024 margin
- Strong R (+21.8) · D 38.7% · R 60.5%
- 2008→2024 swing
- -27.4pp toward R · 2008: 5.7pp · 2024: -21.8pp
- All cycles
- 2024: R+21.8 2020: R+14.1 2016: R+13.1 2012: R+1.2 2008: D+5.7
Not yet ingested
- Civics
- —
Market trends
- HPI YoY
- ▼ -1.99%
- Current HPI
- 311.7456
- Rent YoY
- ▲ 5.46%
- Metro
- Deltona-Daytona Beach-Ormond Beach, FL
- State GDP YoY
- ▲ 3.28%
- F500 in state
- 36
Industry mix (Fortune 500 HQ in FL)
| Industry | F500 HQs | Revenue |
|---|---|---|
| Industrial Technology | 2 | $29B |
|
||
| Insurance | 2 | $17B |
|
||
| Retail | 1 | $60B |
|
||
| Technology Distribution | 1 | $58B |
|
||
| Homebuilding | 1 | $35B |
|
||
| Technology Manufacturing | 1 | $35B |
|
||
Price history
-91.7% since first listed33 events — show timeline
- 2026-06-14 Listed $316,450 Daytona MLS
- 2025-04-22 Listing Removed — Daytona MLS
- 2025-04-07 Price Changed $358,000 Daytona MLS
- 2025-02-27 Price Changed $370,000 Daytona MLS
- 2025-02-07 Listed $400,000 Daytona MLS
- 2019-08-01 Sold (Public Records) $256,000 Public Records
- 2019-07-26 Sold (MLS) $256,000 Stellar MLS as Distributed by MLS Grid
- 2019-07-26 Sold (MLS) $256,000 NSBMLS
- 2019-07-26 Sold (MLS) $256,000 Daytona MLS
- 2019-04-29 Contingent — Daytona MLS
- 2019-04-29 Contingent — NSBMLS
- 2019-03-07 Price Changed $265,000 Daytona MLS
- 2019-03-07 Price Changed $265,000 NSBMLS
- 2019-02-13 Price Changed $269,900 Daytona MLS
- 2019-02-13 Price Changed $269,900 NSBMLS
- 2019-02-04 Price Changed $279,900 Daytona MLS
- 2019-02-02 Price Changed $279,900 NSBMLS
- 2019-01-07 Price Changed $284,000 NSBMLS
- 2019-01-07 Price Changed $284,000 Daytona MLS
- 2019-01-07 Price Changed $284,900 NSBMLS
- 2018-11-08 Listed $289,000 Daytona MLS
- 2018-11-06 Listed $265,000 Stellar MLS as Distributed by MLS Grid
- 2018-11-06 Listed $289,000 NSBMLS
- 2015-04-16 Sold (Public Records) $191,000 Public Records
- 2015-04-15 Sold (MLS) $191,000 Daytona MLS
- 2015-04-03 Pending — Daytona MLS
- 2015-04-02 Contingent — Daytona MLS
- 2015-02-23 Price Changed $189,981 Daytona MLS
- 2015-01-21 Price Changed $199,000 Daytona MLS
- 2015-01-10 Listed $207,990 Daytona MLS
- 2011-07-25 Sold (Public Records) $675,000 Public Records
- 2011-07-25 Sold (Public Records) $1,057,000 Public Records
- 2010-02-08 Sold (Public Records) $3,829,100 Public Records
Property tax history
+1.1%/yrLatest (2025): $3,994 · +2.5% YoY. Source: county tax records.
Cash-flow waterfall
monthlySold comps — $/sqft
last 12 mo · ≤1 miLoading sold comps…