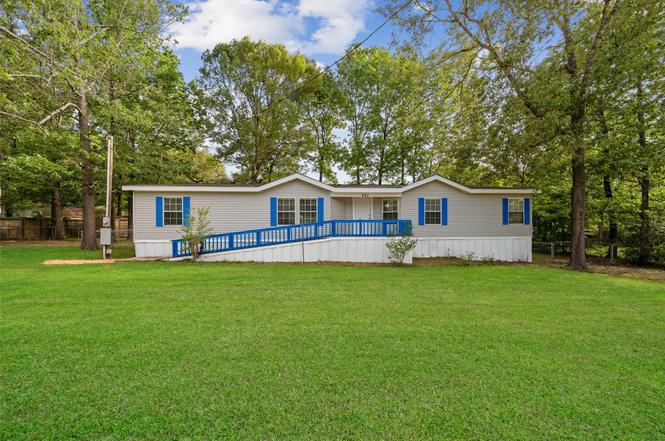
651 Cedar Point Dr · Cedar Point, TX
Flood risk 1/10 · Minimal
- FEMA flood zone
- X (unshaded)
- Chance of flooding over 30 yrs
- 0.0%
- Est. flood insurance / yr
- $507 – $1,088
Fire risk 3/10 · Minor
- Est. fire insurance / yr
- $1,222 – $2,270
Heat risk 8/10 · Major
- Hot days now (above 111°F)
- 7 days/yr
- Hot days in 30 yrs
- 25 days/yr
Wind risk 8/10 · Major
- Chance of severe wind over 30 yrs
- 99.0%
Air-quality risk 1/10 · Minimal
- Unhealthy air days now
- 0 days/yr
- Unhealthy air days in 30 yrs
- 0 days/yr
Risk factors via First Street. Map © Google.
Why this score? — see what drove the C+ grade
The composite is a weighted blend of 9 inputs, each scored 0–100. Each bar is that input's sub-score; the figure is the points it added to the 100-point composite (weight × sub-score).
- Cash flow +23.3/30.0
- ARV discount +15.0/15.0
- DSCR +7.5/10.0
- 1% rule +6.7/10.0
- Schools +4.1/10.0
- Rent growth +2.5/5.0
- Livability +2.5/5.0
- Condition / age +2.5/5.0
- Appreciation +0.0/10.0
$144,000
🖨 Deal sheet 📄 Offer letter ✓ Due diligence
Listing remarks
Fall in love with this beautiful 3-bedroom, 2-bath home nestled in the lovely Cedar Point subdivision. Recent updates include just-installed Mohawk waterproof laminate plank flooring, sheetrock throughout all rooms except the kitchen and baths, an approx 3-year-old roof and an approx 7-year-old HVAC system. The home was leveled in 2022 and sits on 3 lots totaling 15,000 sq ft, offering generous outdoor space. Enjoy relaxing evenings on the covered back deck, with 2 storage sheds providing extra convenience. The spacious kitchen features a new over and dishwasher, abundant counter space and opens seamlessly to a nice-sized family room-perfect for everyday living and entertaining. The private
Key facts
- Play area
- 2 storage sheds
- Covered back deck
Tags
Property features AI
Finance
- Other: Subdivision lot; Asphalt road access
- HOA & community: Member of Cedar Point HOA/Sterling Association; Association amenities include boat ramp, clubhouse and controlled access; Annual association fee
Exterior
- Parking: Controlled access to community (association amenity)
- Security: Controlled access
- Utilities: Public water; Public sewer
- Home design: Residential property; Single-story layout (all main rooms on first floor)
- Construction: Built in 2004; Aluminum siding; Composition roof; Block foundation
- Exterior features: Covered patio; Patio and deck; Fence enclosing back yard; Storage shed
Interior
- Kitchen: Dishwasher; Electric oven; Free‑standing range; Disposal
- Bedrooms: Primary bedroom (First floor); Bedroom (First floor); Bedroom (First floor); Office can function as a bedroom/bonus room (First floor); Total of 4 bedrooms/office spaces; 7 total rooms
- Flooring: Laminate
- Bathrooms: 2 full bathrooms; Primary bath with double vanity, soaking tub and separate shower
- Heating & cooling: Central heating (electric); Central air; Attic fan; Thermostat (programmable energy efficient)
- Interior features: Double vanity; Kitchen/family room combo; Soaking tub; Separate shower; Tub/shower; Ceiling fans; Kitchen/dining combo; Programmable thermostat
- Laundry & utility: Washer hookup; Electric dryer hookup
Neighborhood map
What this means for you Summary
Snapshot
- This is a 3-bed/2.0-bath single-family listed at $144k.
Deal economics
- At list price, monthly cash flow is $264 ($3k/yr) — positive.
- The deal already cash-flows at list — no discount required.
- Meets the 1% rule at list price ($2k rent vs $144k).
- Recommended offer: $131k (9.0% below list) — sets the bar for market timing.
- Cap rate 8.5% vs local median 3.8% in Cedar Point — top-decile yield for the area; either an underpriced asset or a hidden risk that comps aren't pricing in. Stress-test before assuming the spread holds.
Location & tenants
- Location reads 49/100 on livability (#1,509 in TX) — a working-class tenant base; expect higher turnover. Strengths: cost of living A+, housing A+, crime A; Watch: amenities F, commute F, employment F.
- Onalaska ISD (rural): math 50% / reading 48% proficiency, ranked #213 of 826 in TX (top 26%) — families likely to look elsewhere, expect single-tenant / working-renter base with shorter leases.
- Zoned schools: Onalaska Jr/Sr High (math 48% / reading 55%, grade D+, #478 of 1,632 statewide, top 29%, 527 students, 58% FRL) — zoned schools at 58% FRL track the district average.
- Market conditions: 1186 active listings in the ZIP; 2 comparable units currently listed for rent nearby; 769 units permitted in Polk County in 2024 (0 in 5+ unit buildings).
- This rent runs 30% of the median local income ($67k/yr) — at the standard rent-burdened threshold; future hikes will face affordability resistance.
Forward outlook
- Local home prices are declining (-3.0%/yr); year-one equity from $996 of loan paydown is wiped out by about $4k of value loss. Plan a longer hold.
- Polk County population projected at +16% by 2050 — long-run rental-demand tailwind backs the buy-and-hold thesis.
Negotiation context
- It's been on market 98 days — a 9% lower offer ($131k) is reasonable based on typical stale-listing flexibility.
- 2 sale attempts with the ask held roughly flat each time — persistent listings suggest the price (not the market) is what's stuck; bring a comps-based counter.
Risks & watch-outs
- Climate carrying-cost: severe wind risk, 99% chance of damaging wind over 30y; extreme-heat days projected 7→25/yr by 2055 (HVAC capex compounding) — expect insurance premiums to compound above CPI over the hold.
Questions for the listing agent
- It's been on market 98 days. Have you received any prior offers? Is the seller open to a 9% concession, seller financing, or rate buy-down credit?
- What does the HOA fee cover, when was the last increase, and are there any pending special assessments or reserve-fund shortfalls?
- Why hasn't it sold? Are there any deal-killer items the seller is aware of (foundation, flood, title, zoning, code violations)?
- Is there a deadline driving the sale (1031 exchange, divorce, estate, relocation)? That informs how much negotiation room exists.
- Schools are F-rated, which usually means shorter tenancies and higher turnover. Who's the typical renter profile here, and what's been the actual vacancy rate?
- What's the average days-on-market for RENTAL listings here right now (not sales)? A rising rental-DOM trend means longer vacancies and softer asking-rent achievability than the comps imply.
- What's the recent tenant-quality profile in this submarket — average credit score on applications, eviction rate, late-payment / NSF rate, and stable-employment percentage? A property-management company in the area should have these aggregated.
- How much new for-sale + rental construction is in the pipeline within 1–3 miles? Heavy new supply typically softens prices + rents 12–24 months out; constrained supply supports both.
Investment metrics
- 1% rule
- 1.17% ✓
- Cap rate
- 8.50%
- Cash-on-cash
- 7.87%
- DSCR
- 1.35
- GRM
- 7.1
CMA / ARV
- ARV (on-the-fly)
- $204,593
- Comps found
- 3
Show comp detail 3 sales within ~0.75 mi
| Address | Dist | Beds/Ba | Sqft | Sold | Price | $/sf | Match |
|---|---|---|---|---|---|---|---|
| 970 Cedar Point Dr | 0.30mi | 4/2.5 (+1) | 2,096 (+12%) | 3mo | $229,000 | $109 | 57 |
| 489 Sandy Ridge Dr W | 0.71mi | 3/2.0 | 1,790 (-5%) | 23mo | $489,000 | $273 | 40 |
| 197 Pin Oak | 0.29mi | 4/2.0 (+1) | 2,128 (+13%) | 24mo | $70,000 | $33 | 39 |
Match score weights: distance 35% · size 25% · config 20% · recency 20%. Top-matched comps best support the ARV.
Projected returns pro-forma
-3.0% appreciation · 3.0% rent growth · sell at horizon
- IRR
- -4.3%
- Equity multiple
- 0.84×
- Total profit
- $-6,436
- Equity at exit
- $21,471
- IRR
- 5.5%
- Equity multiple
- 1.41×
- Total profit
- $16,342
- Equity at exit
- $12,450
Cash invested: $40,320 (down + closing). Projections, not guarantees.
Landlord ↔ Tenant lean methodology
- Overall (STATE)
- 87 Strongly Landlord-Friendly
- State Texas
- 87 Strongly Landlord-Friendly · R+5
- County
- — inherits STATE
- City
- — inherits STATE
ZIP-level market 77351
- Home prices YoY
- -14.8%
- Active inventory
- 1186
- Price-to-rent
- 7.1×
Monthly cashflow live
- Estimated rent
- $1,680 medium interval (Pro) →
- Mortgage (P&I)
- −$755
- Tax est. 1.5%
- −$180 /mo · $2,160/yr
- Insurance
- −$60
- HOA
- −$68
- Vacancy / Maint / Mgmt
- −$353
- Net cashflow
- $264
Break-even live
UW: 25.0% down · 7.5% · 30yr · 1.5% tax · 5.0% vac · 8.0% maint · 8.0% mgmt
Financing live
Cash to close
- Down payment
- $36,000
- Closing costs
- $4,320
- Reserves months
- —
- Total cash needed
- —
Loan-product check · same deal, 3 products live
Conventional
25% down · 7.5% · 30yr
- Down + closing
- —
- Monthly P&I
- —
- Monthly cashflow
- —
- DSCR
- —
- Eligible?
- —
Personal DTI + credit; lowest rate.
DSCR
20% down · 8.5% · 30yr
- Down + closing
- —
- Monthly P&I
- —
- Monthly cashflow
- —
- DSCR
- —
- Eligible?
- —
No personal income docs; deal must DSCR.
Hard money
10% down · 12.0% · 12mo
- Down + closing
- —
- Monthly P&I
- —
- Monthly cashflow
- —
- DSCR
- —
- Eligible?
- —
Short-term bridge; refi at stabilization.
Rent comps 2 comps
| Address | Beds | Baths | Sqft | Rent | $/sqft | DOM | Units | Dist |
|---|---|---|---|---|---|---|---|---|
| 236 Bluebonnet Livingston, TX | 4.0 | 2.0 | 1603 | $1,795 | $1.12 | 12d | 1 | 0.52mi |
| 164 Red Clover Livingston, TX | 3.0 | 2.0 | 1600 | $1,500 | $0.94 | 10d | 1 | 0.60mi |
HOA detail
- Monthly dues
- $68 · $816/yr
- Likely covers
- water
Listing history 13 events
-
2026-05-13status Pending
-
2026-05-09status Pending
-
2026-05-07status Pending
-
2026-04-30status Pending
-
2026-04-25price $144,000
-
2026-01-31$149,000 Active
-
2026-01-30historical
-
2025-11-29price $154,900
-
2025-09-14price $159,000
-
2025-08-08price $164,000
-
2025-05-22price $169,000
-
2025-04-18$179,900 Active
-
2000-01-19soldstatus
ⓘ Source: listings_history table (triggers on properties + properties_extension) + one-shot
backfill from property_details.listing_events for pre-trigger history.
Climate risk First Street
- Flood 1/10 Low FEMA zone X (unshaded) · 0% chance over 30 yrs
- Wildfire 3/10 Moderate
- Heat 8/10 Severe 7 d/yr ≥111°F today · 25 d/yr by 30 yrs out
- Wind 8/10 Severe 99% chance of damaging wind over 30 yrs
- Air quality 1/10 Low 0 unhealthy d/yr today · 0 by 30 yrs out
Nearby sold comps map
Loading sold comps map…
Walkable amenities ~0.75 mi
Loading nearby amenities…
Taxation est. · year 1
- Rental income
- $20,163
- − Mortgage interest
- −$8,066
- − Property taxes
- −$2,160
- − Insurance
- −$720
- − Repairs & maintenance
- −$1,613
- − Management
- −$1,613
- − HOA
- −$816
- − Depreciation
- −$4,189
- Taxable income
- $986
- Est. tax owed @ 24.0%
- −$237
- After-tax cash flow
- $2,935/yr
For passive investors: Depreciation is non-cash, so a rental often shows a tax loss while cash-flowing — sheltering income. Rental losses are passive: they offset passive income freely, and up to $25,000/yr can offset ordinary (W-2) income if you actively participate and your MAGI is under $100k (phasing out to $0 by $150k); unused losses carry forward. On sale, claimed depreciation is recaptured at up to 25%, and gains may owe capital-gains tax (a 1031 exchange can defer both). Figures are a year-1 estimate at your 24.0% rate — not tax advice; consult a CPA.
Schools (NCES district)
- District
- Onalaska ISD
- NCES district ID
- 4833690
- Math proficiency
- 50% ▼ -10.00%
- Reading proficiency
- 48% ▼ -1.00%
- Median HH income
- $38,882
- Composite
- 40.91/100
- National rank
- #3616
- State rank
- #213 of 826 in TX
Livability — Cedar Point
- Score
- 49/100
- State rank
- #1509
- US rank
- #25794
Category grades
Schools grade is shown separately in the Schools card above.
Census & demographics
- Census place
- Cedar Point, TX
- County
- Polk County · 37,143 people
- Metro
- nan
- Population (ZIP)
- 37,143
- Household income
- $66,834
- Rent vs Own
- Severe rent burden
- 608.0
Population outlook (Polk County) Hauer SSP2
- Today (2025)
- 51,049 people
- By 2030
- 53,243 · +4.3%
- By 2040
- 56,528 · +10.7%
- By 2050
- 59,243 · +16.1%
- By 2075
- 63,528 · +24.4%
- By 2100
- 60,376 · +18.3%
Race, ethnicity, and origin ACS 2023
- Neighborhood character
- Predominantly White (72%)
- Race & ethnicity
- White 72% Hispanic / Latino 14% Two or more races 9% Black 8% Native American 2%
- Hispanic origin (detail)
- Mexican 11%
- Common ancestry
- Lithuanian 2% Italian 2% Portuguese 2%
- Foreign-born
- 5% · Canada
- Languages at home
- 88% English-only · Spanish 10%
Political lean MEDSL · Polk
- 2024 margin
- Solid R (+58.9) · D 20.2% · R 79.1%
- 2008→2024 swing
- -21.7pp toward R · 2008: -37.2pp · 2024: -58.9pp
- All cycles
- 2024: R+58.9 2020: R+54.5 2016: R+56.5 2012: R+48.2 2008: R+37.2
Not yet ingested
- Civics
- —
Market trends
- HPI YoY
- ▼ -31.11%
- Current HPI
- 178.5316
- Rent YoY
- —
- Metro
- nan
- State GDP YoY
- ▲ 3.95%
- F500 in state
- 110
Industry mix (Fortune 500 HQ in TX)
| Industry | F500 HQs | Revenue |
|---|---|---|
| Energy | 16 | $1,198B |
|
||
| Technology | 5 | $198B |
|
||
| Engineering / Construction | 4 | $72B |
|
||
| Energy Services | 3 | $60B |
|
||
| Utilities | 3 | $41B |
|
||
| Healthcare | 2 | $330B |
|
||
Price history
-20.0% since first listed13 events — show timeline
- 2026-05-13 Pending — HARMLS
- 2026-05-09 Pending — HARMLS
- 2026-05-07 Pending — HARMLS
- 2026-04-30 Pending — HARMLS
- 2026-04-25 Price Changed $144,000 HARMLS
- 2026-01-31 Listed $149,000 HARMLS
- 2026-01-30 Listing Removed — HARMLS
- 2025-11-29 Price Changed $154,900 HARMLS
- 2025-09-14 Price Changed $159,000 HARMLS
- 2025-08-08 Price Changed $164,000 HARMLS
- 2025-05-22 Price Changed $169,000 HARMLS
- 2025-04-18 Listed $179,900 HARMLS
- 2000-01-19 Sold (Public Records) — Public Records
Property tax history
+13.1%/yrLatest (2025): $61 · +10.9% YoY. Source: county tax records.
Cash-flow waterfall
monthlySold comps — $/sqft
last 12 mo · ≤1 miLoading sold comps…