 Duplex
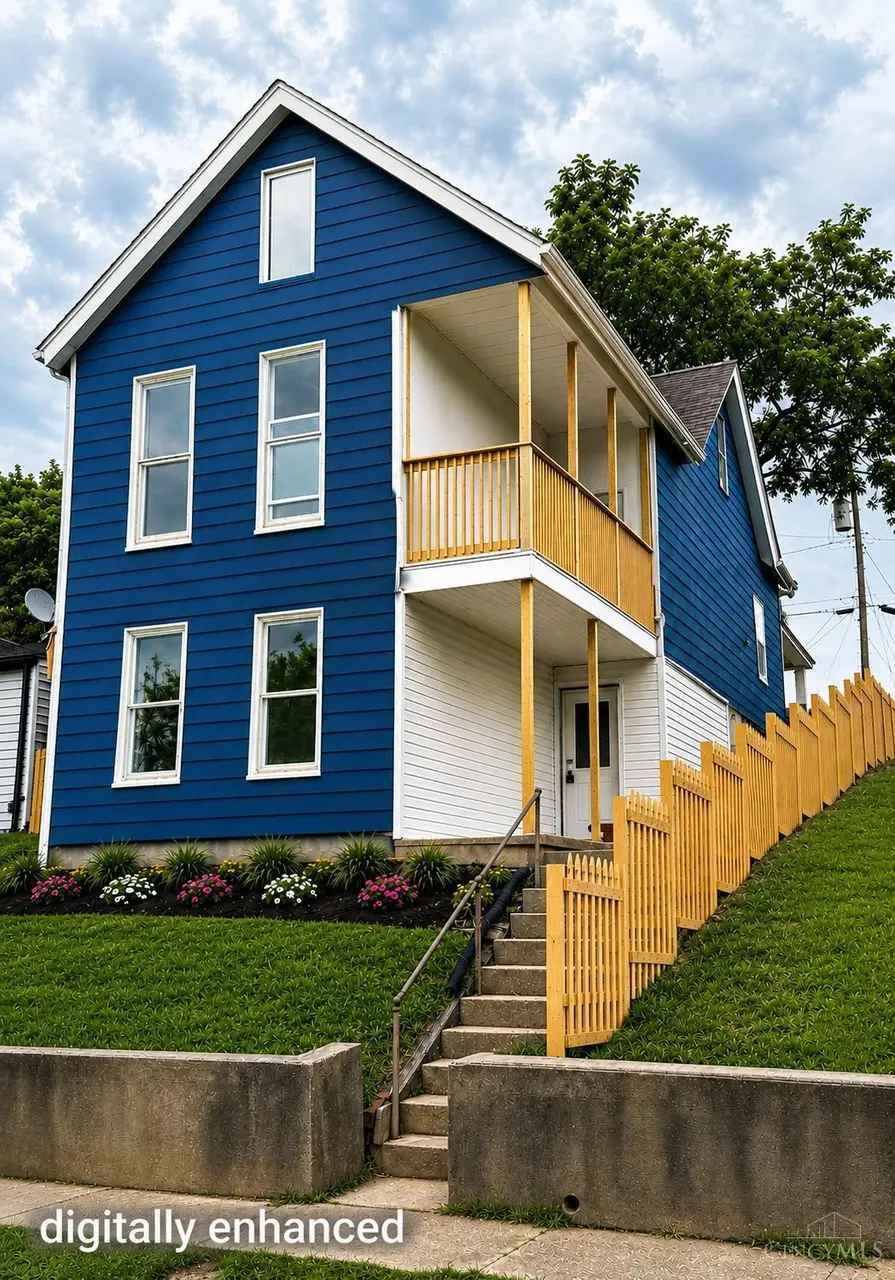
1460 Parrish Ave · Hamilton, OH
Flood risk 1/10 · Minimal
- FEMA flood zone
- X (unshaded)
- Chance of flooding over 30 yrs
- 0.0%
- Est. flood insurance / yr
- $507 – $1,088
Fire risk 1/10 · Minimal
- Est. fire insurance / yr
- $713 – $1,323
Heat risk 4/10 · Minor
- Hot days now (above 104°F)
- 7 days/yr
- Hot days in 30 yrs
- 19 days/yr
Wind risk 2/10 · Minimal
- Chance of severe wind over 30 yrs
- 1.0%
Air-quality risk 3/10 · Minor
- Unhealthy air days now
- 2 days/yr
- Unhealthy air days in 30 yrs
- 3 days/yr
Risk factors via First Street. Map © Google.
Why this score? — see what drove the B- grade
The composite is a weighted blend of 9 inputs, each scored 0–100. Each bar is that input's sub-score; the figure is the points it added to the 100-point composite (weight × sub-score).
- Cash flow +30.0/30.0
- DSCR +10.0/10.0
- 1% rule +7.8/10.0
- ARV discount +7.5/15.0
- Livability +3.7/5.0
- Schools +3.6/10.0
- Rent growth +3.2/5.0
- Condition / age +2.5/5.0
- Appreciation +0.0/10.0
$235,000
🖨 Deal sheet 📄 Offer letter ✓ Due diligence
Multi-family units
County records classify this as Multi-Family (2-4 Unit). Listing-text estimate: 2 units. confirmed
Listing remarks
Fully rehabbed duplex featuring a 2 bed/1 bath upstairs unit and 1 bed/1 bath downstairs unit. Major updates include new roof, new electrical, new water heater and new HVAC systems in each unit. Turnkey investment or perfect owner-occupant opportunity. Fully Renovated Interior. Updated kitchens and bathrooms. Move-in ready with low maintenance for years to come. Perfect opportunity for an investor looking for strong rental potential or an owner wanting to live in one unit while renting the other. Conveniently located near shopping, restaurants, schools, and major highways. Agents, please read Agent remarks
Key facts
- Rehabbed duplex
- New water heater
- New hvac systems
Tags
Property features AI
Finance
- Other: Zoned residential; Lot size approximately 0.09 acres; Located in Hamilton East (cross street: Grand Blvd)
Exterior
- Parking: Two covered garage spaces; Two additional open parking spaces; Driveway and gravel parking
- Utilities: Public water; Public sewer; Natural gas
- Home design: Duplex; Three or more levels
- Construction: Aluminum siding; Poured foundation; Shingle roof
- Exterior features: Balcony; Wood fence
Interior
- Bedrooms: One 1-bedroom unit; One 2-bedroom unit
- Bathrooms: Each unit has one full bathroom
- Heating & cooling: Forced-air heating (gas); Central air conditioning
- Interior features: Duplex property with two separate units; No fireplace
Neighborhood map
What this means for you Summary
Snapshot
- This is a 2 × 3-bed/1.0-bath units multifamily listed at $235k.
Deal economics
- At list price, monthly cash flow is $990 ($12k/yr) — positive. Per door: $495/mo.
- The deal already cash-flows at list — no discount required.
- Meets the 1% rule at list price ($3k rent vs $235k).
- Recommended offer: $231k (1.5% below list) — sets the bar for market timing.
- Cap rate 11.3% vs local median 4.6% in Hamilton — top-decile yield for the area; either an underpriced asset or a hidden risk that comps aren't pricing in. Stress-test before assuming the spread holds.
Location & tenants
- Location reads 73/100 on livability (#332 in OH) — a middle-class / working-renter tenant base. Strengths: cost of living A+, housing A+, schools B; Watch: crime C-, amenities C-, employment D.
- Hamilton City (suburban): math 42% / reading 45% proficiency, ranked #517 of 656 in OH (top 79%) — families likely to look elsewhere, expect single-tenant / working-renter base with shorter leases; 63% free/reduced lunch — lower-income household profile, screen leases tightly.
- Market conditions: Rents rising (+3.0%/yr); 196 active listings in the ZIP; 5 comparable units currently listed for rent nearby; rentals at typical pace (median 24d on market — plan ~3-4 weeks tenant-placement turnaround); 40% of comp listings sitting > 30 days — soft ceiling on asking rent; solid renter incomes; 1,163 units permitted in Butler County in 2024 (356 in 5+ unit buildings).
- This rent runs 39% of the median local income ($92k/yr) — at the standard rent-burdened threshold; future hikes will face affordability resistance.
Forward outlook
- Local home prices are declining (-3.0%/yr); year-one equity from $2k of loan paydown is wiped out by about $7k of value loss. Plan a longer hold.
- At projected returns (-3.0% appreciation + 3.0% rent growth), your $66k cash investment doubles in ~7 years — after that, you're playing with house money.
Negotiation context
- It's been on market 20 days — a 2% lower offer ($231k) is reasonable based on typical stale-listing flexibility.
- Current owner paid $75k; list at $235k implies a 213% gain — meaningful room to come down on a strong offer.
Risks & watch-outs
- Watch-outs: built in 1909 — expect roof / HVAC / electrical / plumbing capex.
Questions for the listing agent
- Can we see the unit-by-unit rent roll, current vacancy, and any below-market leases? What's the average tenancy length?
- What capital expenditures (roof, boiler, parking lot, exteriors) have been made in the last 5 years, and what's planned in the next 2?
- Built in 1909 — when were the roof, HVAC, electrical panel, plumbing, and water heater last replaced?
- Is there a deadline driving the sale (1031 exchange, divorce, estate, relocation)? That informs how much negotiation room exists.
- Schools are B-rated — typically a magnet for longer-tenancy family renters. What's the average tenant stay here, and is there a school-zone premium baked into asking?
- What's the average days-on-market for RENTAL listings here right now (not sales)? A rising rental-DOM trend means longer vacancies and softer asking-rent achievability than the comps imply.
- What's the recent tenant-quality profile in this submarket — average credit score on applications, eviction rate, late-payment / NSF rate, and stable-employment percentage? A property-management company in the area should have these aggregated.
- How much new apartment / multifamily construction is in the pipeline within 1–3 miles? Heavy new supply (>2% of stock underway) typically softens rents 12–24 months out; light construction supports rent growth.
Investment metrics
- 1% rule
- 1.28% ✓
- Cap rate
- 11.35%
- Cash-on-cash
- 18.06%
- DSCR
- 1.80
- GRM
- 6.5
CMA / ARV
No comps found within radius.
Projected returns pro-forma
-3.0% appreciation · 2.95% rent growth · sell at horizon
- IRR
- 9.5%
- Equity multiple
- 1.38×
- Total profit
- $24,727
- Equity at exit
- $35,039
- IRR
- 18.6%
- Equity multiple
- 2.55×
- Total profit
- $101,697
- Equity at exit
- $20,319
Cash invested: $65,800 (down + closing). Projections, not guarantees.
Landlord ↔ Tenant lean methodology
- Overall (STATE)
- 73 Landlord-Friendly
- State Ohio
- 73 Landlord-Friendly · R+6
- County
- — inherits STATE
- City
- — inherits STATE
ZIP-level market 45011
- Rents YoY
- 3.0%
- Active inventory
- 196
- Price-to-rent
- 13.0×
Monthly cashflow live
- Estimated rent
- $3,004 high interval (Pro) →
- Mortgage (P&I)
- −$1,232
- Tax from tax record
- −$53 /mo · $633/yr
- Insurance
- −$98
- HOA
- −$0
- Vacancy / Maint / Mgmt
- −$631
- Net cashflow
- $990
Break-even live
2-unit breakdown (identical units grouped — click to expand)
| Units | Beds | Baths | Est. rent |
|---|---|---|---|
| 2× units | 3 | 1 | $3,004 |
| #1 | 3 | 1 | $1,502 |
| #2 | 3 | 1 | $1,502 |
| Total (2 units) | $3,004 | ||
UW: 25.0% down · 7.5% · 30yr · 1.5% tax · 5.0% vac · 8.0% maint · 8.0% mgmt
Financing live
Cash to close
- Down payment
- $58,750
- Closing costs
- $7,050
- Reserves months
- —
- Total cash needed
- —
Loan-product check · same deal, 3 products live
Conventional
25% down · 7.5% · 30yr
- Down + closing
- —
- Monthly P&I
- —
- Monthly cashflow
- —
- DSCR
- —
- Eligible?
- —
Personal DTI + credit; lowest rate.
DSCR
20% down · 8.5% · 30yr
- Down + closing
- —
- Monthly P&I
- —
- Monthly cashflow
- —
- DSCR
- —
- Eligible?
- —
No personal income docs; deal must DSCR.
Hard money
10% down · 12.0% · 12mo
- Down + closing
- —
- Monthly P&I
- —
- Monthly cashflow
- —
- DSCR
- —
- Eligible?
- —
Short-term bridge; refi at stabilization.
Rent comps 5 comps
| Address | Beds | Baths | Sqft | Rent | $/sqft | DOM | Units | Dist |
|---|---|---|---|---|---|---|---|---|
| 1794 See Ave Hamilton, OH | 3.0 | 1.0 | 1272 | $1,800 | $1.42 | 10d | 1 | 0.14mi |
| 967 Shuler Ave Hamilton, OH | 3.0 | 2.0 | 1466 | $1,795 | $1.22 | 44d | 1 | 0.55mi |
| 969 Harmon Ave Hamilton, OH | 3.0 | 1.0 | 1350 | $1,695 | $1.26 | 44d | 1 | 0.58mi |
| 10 Kirk Ave Hamilton, OH | 4.0 | 2.0 | 1944 | $2,000 | $1.03 | 2d | 1 | 0.86mi |
| 1025 Heaton St Hamilton, OH | 2.0 | 1.0 | 1436 | $1,025 | $0.71 | 24d | 1 | 1.45mi |
Listing history 13 events
-
2026-06-18days on market $235,000 Active 20 DOM
-
2026-06-17days on market $235,000 Active 19 DOM
-
2026-06-16days on market $235,000 Active 18 DOM
-
2026-06-15days on market $235,000 Active 17 DOM
-
2026-06-13days on market $235,000 Active 15 DOM
-
2026-06-13days on market $235,000 Active 14 DOM
-
2026-06-09days on market $235,000 Active 11 DOM
-
2026-06-08days on market $235,000 Active 10 DOM
-
2026-06-07days on market $235,000 Active 9 DOM
-
2026-06-03days on market $235,000 Active 5 DOM
-
2026-06-02days on market $235,000 Active 4 DOM
-
2026-06-01days on market $235,000 Active 3 DOM
-
2026-05-31days on market $235,000 Active 2 DOM
ⓘ Source: listings_history table (triggers on properties + properties_extension) + one-shot
backfill from property_details.listing_events for pre-trigger history.
Tax reassessment forecast OH · Partial reset (capped growth)
- Current annual tax
- $633 · $53/mo
- Projected year-2 tax
- $2,150 · $179/mo
- Expected delta
- +$1,516/yr (+$126/mo · 239.5%)
ⓘ Screening estimate from a state-policy table — verify with the county assessor before closing.
Climate risk First Street
- Flood 1/10 Low FEMA zone X (unshaded) · 0% chance over 30 yrs
- Wildfire 1/10 Low
- Heat 4/10 Moderate 7 d/yr ≥104°F today · 19 d/yr by 30 yrs out
- Wind 2/10 Low 100% chance of damaging wind over 30 yrs
- Air quality 3/10 Moderate 2 unhealthy d/yr today · 3 by 30 yrs out
Nearby sold comps map
Loading sold comps map…
Walkable amenities ~0.75 mi
Loading nearby amenities…
Taxation est. · year 1
- Rental income
- $36,048
- − Mortgage interest
- −$13,164
- − Property taxes
- −$633
- − Insurance
- −$1,175
- − Repairs & maintenance
- −$2,884
- − Management
- −$2,884
- − Depreciation
- −$6,836
- Taxable income
- $8,472
- Est. tax owed @ 24.0%
- −$2,033
- After-tax cash flow
- $9,848/yr
For passive investors: Depreciation is non-cash, so a rental often shows a tax loss while cash-flowing — sheltering income. Rental losses are passive: they offset passive income freely, and up to $25,000/yr can offset ordinary (W-2) income if you actively participate and your MAGI is under $100k (phasing out to $0 by $150k); unused losses carry forward. On sale, claimed depreciation is recaptured at up to 25%, and gains may owe capital-gains tax (a 1031 exchange can defer both). Figures are a year-1 estimate at your 24.0% rate — not tax advice; consult a CPA.
Schools (NCES district)
- District
- Hamilton City
- NCES district ID
- 3904410
- Math proficiency
- 42% ▼ -13.00%
- Reading proficiency
- 45% ▼ -10.00%
- Median HH income
- $40,488
- Composite
- 36.48/100
- National rank
- #4656
- State rank
- #517 of 656 in OH
Livability — Hamilton
- Score
- 73/100
- State rank
- #332
- US rank
- #5467
Category grades
Schools grade is shown separately in the Schools card above.
Census & demographics
- Census place
- Hamilton, OH
- County
- Butler County · 381,674 people
- City population
- 140,900
- Metro
- Cincinnati, OH-KY-IN
- Population (ZIP)
- 75,864
- Household income
- $91,873
- Rent vs Own
- Severe rent burden
- 1795.0
Population outlook (Butler County) Hauer SSP2
- Today (2025)
- 387,706 people
- By 2030
- 392,028 · +1.1%
- By 2040
- 395,307 · +2.0%
- By 2050
- 391,116 · +0.9%
- By 2075
- 378,642 · -2.3%
- By 2100
- 343,248 · -11.5%
Race, ethnicity, and origin ACS 2023
- Neighborhood character
- Predominantly White (68%)
- Race & ethnicity
- White 68% Hispanic / Latino 12% Black 11% Two or more races 9% Asian 4%
- Hispanic origin (detail)
- Mexican 7%
- Common ancestry
- Romanian 2% Italian 2% Slovak 2%
- Foreign-born
- 11% · Canada, Vietnam, China
- Languages at home
- 86% English-only · Spanish 8% Other Indo-European 2% Vietnamese 1%
Political lean MEDSL · Butler
- 2024 margin
- Strong R (+26.3) · D 36.4% · R 62.7%
- 2008→2024 swing
- -3.6pp toward R · 2008: -22.6pp · 2024: -26.3pp
- All cycles
- 2024: R+26.3 2020: R+24.0 2016: R+28.3 2012: R+26.2 2008: R+22.6
Not yet ingested
- Civics
- —
Market trends
- HPI YoY
- ▼ -188.67%
- Current HPI
- 259.7868
- Rent YoY
- ▲ 2.95%
- Metro
- Cincinnati, OH-KY-IN
- State GDP YoY
- ▲ 1.98%
- F500 in state
- 48
Industry mix (Fortune 500 HQ in OH)
| Industry | F500 HQs | Revenue |
|---|---|---|
| Insurance | 3 | $145B |
|
||
| Industrial Machinery | 3 | $49B |
|
||
| Financial Services | 3 | $24B |
|
||
| Consumer Goods | 2 | $93B |
|
||
| Aerospace / Defense | 2 | $47B |
|
||
| Utilities | 2 | $33B |
|
||
Price history
+1466.7% since first listed3 events — show timeline
- 2026-05-29 Listed $235,000 Cincy MLS
- 2026-03-31 Sold (Public Records) $75,000 Public Records
- 2006-09-27 Sold (Public Records) $15,000 Public Records
Property tax history
+3.3%/yrLatest (2025): $633 · +0.5% YoY. Source: county tax records.
Cash-flow waterfall
monthlySold comps — $/sqft
last 12 mo · ≤1 miLoading sold comps…