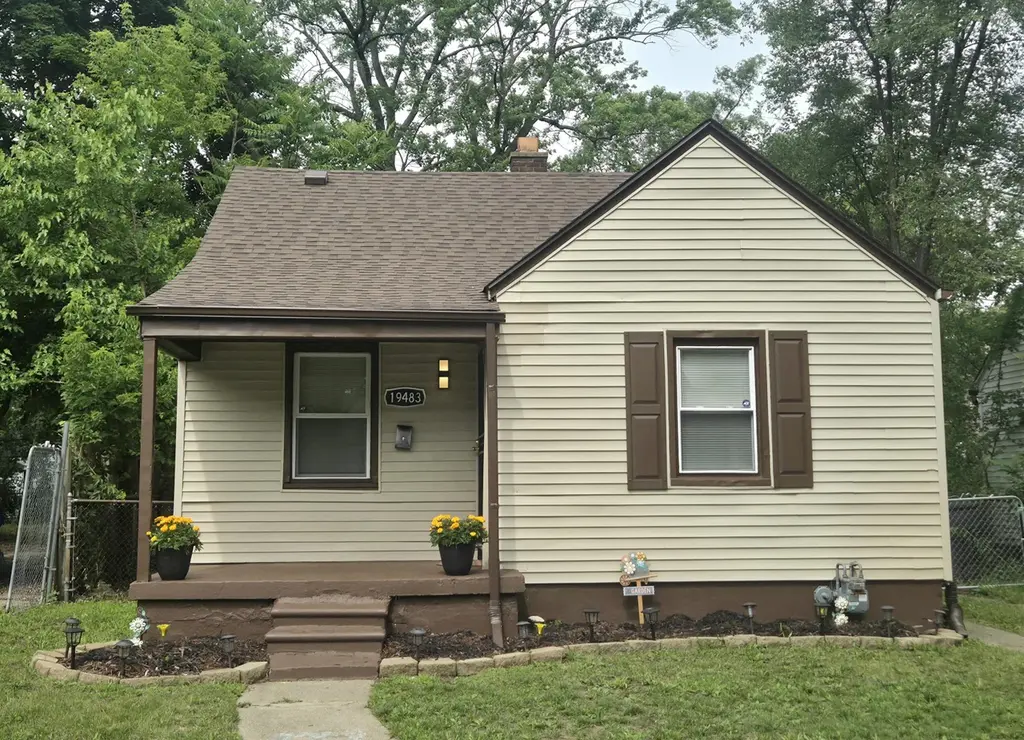
19483 Rosemont Ave · Detroit, MI
Flood risk 1/10 · Minimal
- FEMA flood zone
- X (unshaded)
- Chance of flooding over 30 yrs
- 0.0%
- Est. flood insurance / yr
- $473 – $860
Fire risk 1/10 · Minimal
- Est. fire insurance / yr
- $784 – $1,456
Heat risk 2/10 · Minimal
- Hot days now (above 98°F)
- 7 days/yr
- Hot days in 30 yrs
- 15 days/yr
Wind risk 2/10 · Minimal
- Chance of severe wind over 30 yrs
- —
Air-quality risk 3/10 · Minor
- Unhealthy air days now
- 2 days/yr
- Unhealthy air days in 30 yrs
- 5 days/yr
Risk factors via First Street. Map © Google.
Why this score? — see what drove the C+ grade
The composite is a weighted blend of 9 inputs, each scored 0–100. Each bar is that input's sub-score; the figure is the points it added to the 100-point composite (weight × sub-score).
- Cash flow +27.9/30.0
- DSCR +9.9/10.0
- ARV discount +7.5/15.0
- 1% rule +7.3/10.0
- Rent growth +4.5/5.0
- Livability +3.7/5.0
- Condition / age +2.5/5.0
- Schools +1.3/10.0
- Appreciation +0.0/10.0
$109,900
🖨 Deal sheet (PDF) 📄 Offer letter ✓ Due diligence
Listing remarks MLS
Beautiful, brand new remodeled home is ready and waiting for you to come in and relax because everything is already done. all newly renovated top to bottom inside & out this year with 'must have' important features like 2 full bathrooms, pleasant dining area off of the all new Kitchen, complete with new Samsung refrigerator, Extra bonus room at top of stairs is perfect for home office or. .. you name it. .. Additional room in the clean & freshly painted basement. 2 car garage for all your extra storage, new plumbing & great looking bathroom. new flooring & paint throughout, inc. basement, Vinyl siding, Vinyl windows, Steel doors, New roof, updated electrical, new lighting fixtures etc. etc. Convenient location near Southfield X-way & 8 mile rd just minutes from wherever you want to be: downtown or suburbs, shopping dining worship etc. * do not delay, come see today. ..
Key facts
- Pleasant dining area
- Bonus room
- Clean basement
Tags
Property features AI
Exterior
- Parking: Detached 2-car garage
- Utilities: Public water
- Home design: Single family residence; Residential property; Built in 1941
- Construction: Vinyl siding construction
- Exterior features: Vinyl siding; Lot approximately 0.12 acres; Public water
Interior
- Kitchen: Kitchen
- Bedrooms: Primary bedroom; Bedroom 2; Bedroom 3
- Bathrooms: Two full bathrooms
- Heating & cooling: Forced air heating
- Interior features: Seven total rooms; Full basement; Bonus room
Neighborhood map
What this means for you Summary
Snapshot
- This is a 3-bed/1.0-bath single-family listed at $110k.
Deal economics
- At list price, monthly cash flow is $340 ($4k/yr) — positive.
- The deal already cash-flows at list — no discount required.
- Meets the 1% rule at list price ($1k rent vs $110k).
Location & tenants
- Location reads 73/100 on livability (#218 in MI) — a middle-class / working-renter tenant base. Strengths: amenities A+, commute A+, cost of living A+; Watch: schools F, crime F, employment F.
- Detroit Public Schools Community District (urban): math 10% / reading 24% proficiency, ranked #499 of 540 in MI (top 92%) — low school quality limits family demand, transient renter base, plan for 1-2y turnover; 90% free/reduced lunch — lower-income household profile, screen leases tightly.
- Market conditions: Rents rising fast (+8.0%/yr); 308 active listings in the ZIP; 40 comparable units currently listed for rent nearby; rentals at typical pace (median 18d on market — plan ~3-4 weeks tenant-placement turnaround); lower-income renter base — watch delinquency; 2,639 units permitted in Wayne County in 2024 (1,216 in 5+ unit buildings).
- This rent runs 37% of the median local income ($44k/yr) — at the standard rent-burdened threshold; future hikes will face affordability resistance.
Forward outlook
- Local home prices are declining (-3.0%/yr); year-one equity from $760 of loan paydown is wiped out by about $3k of value loss. Plan a longer hold.
- Wayne County population projected at -17% by 2050 — secular population decline; favor cash flow + early exit over multi-decade hold.
- At projected returns (-3.0% appreciation + 8.0% rent growth), your $31k cash investment doubles in ~7 years — after that, you're playing with house money.
Negotiation context
- Only 3 days on market — expect competitive offers; lowballing is unlikely to land.
- 14 sale attempts since 20y ago with the ask held roughly flat each time — persistent listings suggest the price (not the market) is what's stuck; bring a comps-based counter.
- Current owner paid $10k; list at $110k implies a 977% gain — meaningful room to come down on a strong offer.
Risks & watch-outs
- Watch-outs: built in 1941 — expect roof / HVAC / electrical / plumbing capex.
Questions for the listing agent
- Built in 1941 — when were the roof, HVAC, electrical panel, plumbing, and water heater last replaced?
- Is there a deadline driving the sale (1031 exchange, divorce, estate, relocation)? That informs how much negotiation room exists.
- Schools are F-rated, which usually means shorter tenancies and higher turnover. Who's the typical renter profile here, and what's been the actual vacancy rate?
- Crime grade is F in this area — have there been break-ins, vandalism, or insurance claims at this property in the last 3 years? What carrier currently insures it and at what premium?
- What's the average days-on-market for RENTAL listings here right now (not sales)? A rising rental-DOM trend means longer vacancies and softer asking-rent achievability than the comps imply.
- What's the recent tenant-quality profile in this submarket — average credit score on applications, eviction rate, late-payment / NSF rate, and stable-employment percentage? A property-management company in the area should have these aggregated.
- How much new for-sale + rental construction is in the pipeline within 1–3 miles? Heavy new supply typically softens prices + rents 12–24 months out; constrained supply supports both.
Investment metrics
- 1% rule
- 1.23% ✓
- Cap rate
- 10.01%
- Cash-on-cash
- 13.27%
- DSCR
- 1.59
- GRM
- 6.8
CMA / ARV
- ARV (on-the-fly)
- $54,808
- Comps found
- 12
Show comp detail 12 sales within ~0.75 mi
| Address | Dist | Beds/Ba | Sqft | Sold | Price | $/sf | Match |
|---|---|---|---|---|---|---|---|
| 19365 Fenmore St | 0.21mi | 3/1.0 | 912 (+3%) | 1mo | $94,900 | $104 | 84 |
| 19900 Southfield Rd | 0.24mi | 3/1.0 | 898 (+2%) | 4mo | $110,000 | $122 | 83 |
| 20245 Archdale St | 0.53mi | 3/1.0 | 890 (+1%) | 4mo | $53,000 | $60 | 71 |
| 19975 Ferguson St | 0.61mi | 3/1.0 | 889 (+1%) | 1mo | $50,650 | $57 | 70 |
| 20004 Southfield Fwy | 0.34mi | 2/1.0 (-1) | 929 (+5%) | 1mo | $20,000 | $22 | 70 |
| 18697 Glastonbury Rd | 0.46mi | 2/1.0 (-1) | 895 (+1%) | 4mo | $98,500 | $110 | 68 |
| 19333 Grandville Ave | 0.55mi | 2/1.0 (-1) | 851 (-4%) | 3mo | $45,000 | $53 | 60 |
| 18494 Ashton Ave | 0.60mi | 3/1.0 | 943 (+7%) | 2mo | $95,000 | $101 | 59 |
| 18631 Margareta St | 0.61mi | 3/1.0 | 950 (+8%) | 0mo | $62,000 | $65 | 59 |
| 18937 Lindsay St | 0.58mi | 3/1.0 | 951 (+8%) | 2mo | $59,000 | $62 | 59 |
| 19950 Oakfield St | 0.42mi | 3/1.0 | 1,001 (+13%) | 5mo | $40,000 | $40 | 54 |
| 18950 Biltmore St | 0.67mi | 2/1.0 (-1) | 781 (-12%) | 1mo | $46,000 | $59 | 43 |
Match score weights: distance 35% · size 25% · config 20% · recency 20%. Top-matched comps best support the ARV.
Projected returns pro-forma
-3.0% appreciation · 8.0% rent growth · sell at horizon
- IRR
- 8.6%
- Equity multiple
- 1.36×
- Total profit
- $11,025
- Equity at exit
- $16,386
- IRR
- 21.7%
- Equity multiple
- 3.28×
- Total profit
- $70,124
- Equity at exit
- $9,502
Cash invested: $30,772 (down + closing). Projections, not guarantees.
Landlord ↔ Tenant lean methodology
- Overall (STATE)
- 62 Landlord-Friendly
- State Michigan
- 62 Landlord-Friendly · EVEN
- County
- — inherits STATE
- City
- — inherits STATE
ZIP-level market 48219
- Home prices YoY
- -10.3%
- Rents YoY
- 8.0%
- Active inventory
- 308
- Price-to-rent
- 6.8×
Monthly cashflow live
- Estimated rent
- $1,356 high interval (Pro) →
- Mortgage (P&I)
- −$576
- Tax from tax record
- −$109 /mo · $1,307/yr
- Insurance
- −$46
- HOA
- −$0
- Vacancy / Maint / Mgmt
- −$285
- Net cashflow
- $340
Break-even live
Sensitivity live
| Price | -10% $402 | -5% $371 | +0% $340 | +5% $309 | +10% $278 |
|---|---|---|---|---|---|
| Rent | -10% $233 | -5% $287 | +0% $340 | +5% $394 | +10% $447 |
| Rate | -1.0pp $396 | -0.5pp $368 | base $340 | +0.5pp $312 | +1.0pp $283 |
UW: 25.0% down · 7.5% · 30yr · 1.5% tax · 5.0% vac · 8.0% maint · 8.0% mgmt
Financing live
Cash to close
- Down payment
- $27,475
- Closing costs
- $3,297
- Reserves months
- —
- Total cash needed
- —
Loan-product check · same deal, 3 products live
Conventional
25% down · 7.5% · 30yr
- Down + closing
- —
- Monthly P&I
- —
- Monthly cashflow
- —
- DSCR
- —
- Eligible?
- —
Personal DTI + credit; lowest rate.
DSCR
20% down · 8.5% · 30yr
- Down + closing
- —
- Monthly P&I
- —
- Monthly cashflow
- —
- DSCR
- —
- Eligible?
- —
No personal income docs; deal must DSCR.
Hard money
10% down · 12.0% · 12mo
- Down + closing
- —
- Monthly P&I
- —
- Monthly cashflow
- —
- DSCR
- —
- Eligible?
- —
Short-term bridge; refi at stabilization.
Rent comps 40 comps
| Address | Beds | Baths | Sqft | Rent | $/sqft | DOM | Units | Dist |
|---|---|---|---|---|---|---|---|---|
| 19818 Fenmore St Detroit, MI | 3.0 | 1.0 | 902 | $1,275 | $1.41 | 44d | 1 | 0.24mi |
| 19918 Southfield Fwy Detroit, MI | 3.0 | 1.0 | 915 | $1,375 | $1.50 | 16d | 1 | 0.24mi |
| 19445 Avon Ave Detroit, MI | 3.0 | 1.0 | 1023 | $1,550 | $1.52 | 44d | 1 | 0.26mi |
| 19970 Ashton Ave Detroit, MI | 3.0 | 1.0 | 1000 | $1,000 | $1.00 | 44d | 1 | 0.27mi |
| 20068 Faust Ave Detroit, MI | 2.0 | 1.0 | 750 | $1,100 | $1.47 | 25d | 1 | 0.36mi |
| 19329 Stahelin Ave Unit 1 Detroit, MI | 3.0 | 1.5 | 833 | $1,250 | $1.50 | 44d | 1 | 0.36mi |
| 20043 Fenmore St Detroit, MI | 3.0 | 1.0 | 1030 | $1,453 | $1.41 | 44d | 1 | 0.37mi |
| 20011 Avon Ave Detroit, MI | 3.0 | 1.0 | 1000 | $1,200 | $1.20 | 6d | 1 | 0.39mi |
| 19736 Gilchrist St Detroit, MI | 2.0 | 1.0 | 696 | $995 | $1.43 | 13d | 1 | 0.47mi |
| 19372 Grandville Ave Detroit, MI | 2.0 | 1.5 | 733 | $1,050 | $1.43 | 16d | 1 | 0.53mi |
| 20259 Oakfield St Detroit, MI | 3.0 | 1.0 | 1056 | $1,250 | $1.18 | 17d | 1 | 0.55mi |
| 20527 Rosemont Ave Detroit, MI | 2.0 | 2.0 | 975 | $1,528 | $1.57 | 44d | 1 | 0.55mi |
| 19176 Grandville Ave Detroit, MI | 3.0 | 1.0 | 941 | $1,300 | $1.38 | 6d | 1 | 0.58mi |
| 20203 Gilchrist St Detroit, MI | 3.0 | 1.0 | 1031 | $1,250 | $1.21 | 6d | 1 | 0.59mi |
| 18494 Ashton Ave Detroit, MI | 3.0 | 1.0 | 1000 | $1,600 | $1.60 | 17d | 1 | 0.61mi |
| 20210 Biltmore St Detroit, MI | 3.0 | 1.0 | 1033 | $1,350 | $1.31 | 25d | 1 | 0.66mi |
| 18699 Shaftsbury Ave Detroit, MI | 2.0 | 1.0 | 800 | $1,000 | $1.25 | 44d | 1 | 0.67mi |
| 20314 Gilchrist St Detroit, MI | 3.0 | 1.0 | 1042 | $1,500 | $1.44 | 6d | 1 | 0.69mi |
| 18659 Shaftsbury Ave Detroit, MI | 3.0 | 1.0 | 763 | $1,373 | $1.80 | 13d | 1 | 0.69mi |
| 20271 Grandville Ave Detroit, MI | 3.0 | 1.0 | 1010 | $1,550 | $1.53 | 25d | 1 | 0.74mi |
| 18452 Shaftsbury Ave Detroit, MI | 3.0 | 1.0 | 927 | $1,500 | $1.62 | 17d | 1 | 0.79mi |
| 19467 Rutherford St Detroit, MI | 3.0 | 1.0 | 1002 | $1,200 | $1.20 | 17d | 1 | 0.83mi |
| 18276 Oakfield St Detroit, MI | 2.0 | 1.0 | 726 | $1,175 | $1.62 | 44d | 1 | 0.84mi |
| 19440 Rutherford St Detroit, MI | 3.0 | 1.0 | 1000 | $1,400 | $1.40 | 25d | 1 | 0.86mi |
| 19457 Evergreen Rd Detroit, MI | 2.0 | 1.0 | 1100 | $1,200 | $1.09 | 44d | 1 | 0.89mi |
| 18450 Edinborough Rd Detroit, MI | 3.0 | 1.0 | 1000 | $1,500 | $1.50 | 44d | 1 | 0.91mi |
| 17654 Sunderland Rd Detroit, MI | 3.0 | 1.0 | 1100 | $1,500 | $1.36 | 44d | 1 | 0.99mi |
| 18268 Mansfield St Detroit, MI | 2.0 | 1.0 | 800 | $1,200 | $1.50 | 17d | 1 | 1.12mi |
| 18400 Rutherford St Detroit, MI | 3.0 | 1.0 | 1050 | $1,400 | $1.33 | 4d | 1 | 1.12mi |
| 20555 Motor Dr Detroit, MI | 1.0–2.0 | 1.0 | 750 | $1,222 | $1.63 | 16d | 5 | 1.13mi |
| 18556 Kentfield St Detroit, MI | 3.0 | 1.0 | 952 | $1,250 | $1.31 | 4d | 1 | 1.15mi |
| 19781 Fielding St Detroit, MI | 3.0 | 1.0 | 1000 | $1,294 | $1.29 | 6d | 1 | 1.16mi |
| 18461 Heyden St Detroit, MI | 2.0 | 1.0 | 1000 | $1,050 | $1.05 | 6d | 1 | 1.17mi |
| 18134 Vaughan St Detroit, MI | 3.0 | 1.0 | 1060 | $1,150 | $1.08 | 17d | 1 | 1.25mi |
| 18191 Heyden St Detroit, MI | 2.0 | 1.0 | 917 | $1,100 | $1.20 | 25d | 1 | 1.27mi |
| 18427 Greenfield Rd Detroit, MI | 2.0 | 1.0 | 952 | $980 | $1.03 | 6d | 1 | 1.30mi |
| 18481 Prest St Detroit, MI | 3.0 | 1.5 | 1100 | $1,300 | $1.18 | 20d | 1 | 1.33mi |
| 18274 Fielding St Detroit, MI | 2.0 | 1.0 | 700 | $1,200 | $1.71 | 17d | 1 | 1.35mi |
| 18205 Stout St Detroit, MI | 3.0 | 1.0 | 901 | $1,078 | $1.20 | 25d | 1 | 1.36mi |
| 16500 N Park Dr Southfield, MI | 1.0–3.0 | 1.0–2.5 | 1500 | $2,289 | $1.53 | 0d | 1 | 1.44mi |
Listing history 3 events
-
2026-06-21days on market $109,900 Active 3 DOM
-
2026-06-18remarks 683-char remark
Show marketing remark (911 chars)
Beautiful, brand new remodeled home is ready and waiting for you to come in and relax because everything is already done. all newly renovated top to bottom inside & out this year with 'must have' important features like 2 full bathrooms, pleasant dining area off of the all new Kitchen, complete with new Samsung refrigerator, Extra bonus room at top of stairs is perfect for home office or. .. you name it. .. Additional room in the clean & freshly painted basement. 2 car garage for all your extra storage, new plumbing & great looking bathroom. new flooring & paint throughout, inc. basement, Vinyl siding, Vinyl windows, Steel doors, New roof, updated electrical, new lighting fixtures etc. etc. Convenient location near Southfield X-way & 8 mile rd just minutes from wherever you want to be: downtown or suburbs, shopping dining worship etc. * do not delay, come see today. ..
-
2026-06-18$109,900 Active 1 DOM
Show marketing remark (911 chars)
Beautiful, brand new remodeled home is ready and waiting for you to come in and relax because everything is already done. all newly renovated top to bottom inside & out this year with 'must have' important features like 2 full bathrooms, pleasant dining area off of the all new Kitchen, complete with new Samsung refrigerator, Extra bonus room at top of stairs is perfect for home office or. .. you name it. .. Additional room in the clean & freshly painted basement. 2 car garage for all your extra storage, new plumbing & great looking bathroom. new flooring & paint throughout, inc. basement, Vinyl siding, Vinyl windows, Steel doors, New roof, updated electrical, new lighting fixtures etc. etc. Convenient location near Southfield X-way & 8 mile rd just minutes from wherever you want to be: downtown or suburbs, shopping dining worship etc. * do not delay, come see today. ..
ⓘ Source: listings_history table (triggers on properties + properties_extension) + one-shot
backfill from property_details.listing_events for pre-trigger history.
Tax reassessment forecast MI · Partial reset (capped growth)
- Current annual tax
- $1,307 · $109/mo
- Projected year-2 tax
- $1,500 · $125/mo
- Expected delta
- +$193/yr (+$16/mo · 14.7%)
ⓘ Screening estimate from a state-policy table — verify with the county assessor before closing.
Climate risk First Street
- Flood 1/10 Low FEMA zone X (unshaded) · 0% chance over 30 yrs
- Wildfire 1/10 Low
- Heat 2/10 Low 7 d/yr ≥98°F today · 15 d/yr by 30 yrs out
- Wind 2/10 Low
- Air quality 3/10 Moderate 2 unhealthy d/yr today · 5 by 30 yrs out
Nearby sold comps map
Loading sold comps map…
Walkable amenities ~0.75 mi
Loading nearby amenities…
Taxation est. · year 1
- Rental income
- $16,271
- − Mortgage interest
- −$6,156
- − Property taxes
- −$1,307
- − Insurance
- −$550
- − Repairs & maintenance
- −$1,302
- − Management
- −$1,302
- − Depreciation
- −$3,197
- Taxable income
- $2,458
- Est. tax owed @ 24.0%
- −$590
- After-tax cash flow
- $3,492/yr
For passive investors: Depreciation is non-cash, so a rental often shows a tax loss while cash-flowing — sheltering income. Rental losses are passive: they offset passive income freely, and up to $25,000/yr can offset ordinary (W-2) income if you actively participate and your MAGI is under $100k (phasing out to $0 by $150k); unused losses carry forward. On sale, claimed depreciation is recaptured at up to 25%, and gains may owe capital-gains tax (a 1031 exchange can defer both). Figures are a year-1 estimate at your 24.0% rate — not tax advice; consult a CPA.
Schools (NCES district)
- District
- Detroit Public Schools Community District
- NCES district ID
- 2601103
- Math proficiency
- 10% ▼ -2.00%
- Reading proficiency
- 24% ▲ 6.00%
- Median HH income
- $25,815
- Composite
- 13.06/100
- National rank
- #9564
- State rank
- #499 of 540 in MI
Livability — Detroit
- Score
- 73/100
- State rank
- #218
- US rank
- #5427
Category grades
Schools grade is shown separately in the Schools card above.
Census & demographics
- Census place
- Detroit, MI
- County
- Wayne County · 1,562,939 people
- City population
- 572,865
- Metro
- Detroit-Warren-Dearborn, MI
- Population (ZIP)
- 47,208
- Household income
- $43,655
- Rent vs Own
- Severe rent burden
- 3584.0
Population outlook (Wayne County) Hauer SSP2
- Today (2025)
- 1,675,273 people
- By 2030
- 1,620,300 · -3.3%
- By 2040
- 1,502,341 · -10.3%
- By 2050
- 1,384,039 · -17.4%
- By 2075
- 1,124,592 · -32.9%
- By 2100
- 881,193 · -47.4%
Race, ethnicity, and origin ACS 2023
- Neighborhood character
- Predominantly Black (88%)
- Race & ethnicity
- Black 88% White 5% Two or more races 4% Hispanic / Latino 1%
- Common ancestry
- Romanian 1% Lithuanian 1%
- Foreign-born
- 2% · Canada
- Languages at home
- 96% English-only · Spanish 1% French/Haitian/Cajun 1%
Political lean MEDSL · Wayne
- 2024 margin
- Strong D (+29.0) · D 62.7% · R 33.7% · Other 3.6%
- 2008→2024 swing
- -20.5pp toward R · 2008: 49.5pp · 2024: 29.0pp
- All cycles
- 2024: D+29.0 2020: D+38.1 2016: D+37.3 2012: D+46.9 2008: D+49.5
Not yet ingested
- Civics
- —
Market trends
- HPI YoY
- ▼ -65.06%
- Current HPI
- 563.3263
- Rent YoY
- ▲ 8.04%
- Metro
- Detroit-Warren-Dearborn, MI
- State GDP YoY
- ▲ 1.37%
- F500 in state
- 28
Industry mix (Fortune 500 HQ in MI)
| Industry | F500 HQs | Revenue |
|---|---|---|
| Automotive Parts | 3 | $48B |
|
||
| Automotive | 2 | $372B |
|
||
| Chemicals | 1 | $45B |
|
||
| Automotive Retail | 1 | $29B |
|
||
| Healthcare / Medical Devices | 1 | $23B |
|
||
| Automotive Technology | 1 | $20B |
|
||
Price history
+449.5% since first listed38 events — show timeline
- 2026-06-18 Price Changed $109,900 MiRealSource-MiMLS
- 2026-06-18 Price Changed $109,900 REALCOMP
- 2026-06-18 Price Changed $109,900 SW Michigan MLS
- 2026-06-17 Listed $114,900 SW Michigan MLS
- 2026-06-17 Listed $114,900 REALCOMP
- 2026-06-17 Listed $114,900 MiRealSource-MiMLS
- 2025-09-24 Sold (MLS) $10,201 REALCOMP
- 2025-09-24 Sold (MLS) $10,201 SW Michigan MLS
- 2025-09-24 Sold (MLS) $10,201 MiRealSource-MiMLS
- 2025-08-26 Pending — REALCOMP
- 2025-08-26 Pending — MiRealSource-MiMLS
- 2025-08-26 Pending — SW Michigan MLS
- 2025-08-11 Listed $5,000 REALCOMP
- 2025-08-11 Listed $5,000 SW Michigan MLS
- 2025-08-11 Listed $5,000 MiRealSource-MiMLS
- 2018-10-31 Sold (MLS) $9,000 MiRealSource-MiMLS
- 2018-10-31 Sold (MLS) $9,000 REALCOMP
- 2018-10-01 Pending — MiRealSource-MiMLS
- 2018-10-01 Pending — REALCOMP
- 2018-08-30 Listed $19,900 MiRealSource-MiMLS
- 2018-08-30 Listed $19,900 REALCOMP
- 2010-12-22 Sold (MLS) $1,000 MiRealSource-MiMLS
- 2010-12-22 Sold (MLS) $1,000 REALCOMP
- 2010-12-16 Listing Removed — MiRealSource-MiMLS
- 2010-09-15 Listed $2,000 MiRealSource-MiMLS
- 2010-09-15 Listed $1,500 REALCOMP
- 2010-09-14 Listing Removed — MiRealSource-MiMLS
- 2010-09-14 Listing Removed — REALCOMP
- 2010-06-10 Listed $3,900 MiRealSource-MiMLS
- 2010-06-10 Listed $3,900 REALCOMP
- 2007-11-29 Sold (Public Records) $84,000 Public Records
- 2006-11-16 Sold (MLS) $21,000 REALCOMP
- 2006-08-09 Listed $29,900 REALCOMP
- 2006-08-07 Listing Removed — REALCOMP
- 2006-04-28 Listed $44,900 REALCOMP
- 2001-07-11 Sold (Public Records) $34,000 Public Records
- 2001-07-02 Sold (Public Records) $71,000 Public Records
- 1998-01-08 Sold (Public Records) $20,000 Public Records
Property tax history
-2.2%/yrLatest (2025): $1,307 · -49.3% YoY. Source: county tax records.
Cash-flow waterfall
monthlySold comps — $/sqft
last 12 mo · ≤1 miLoading sold comps…