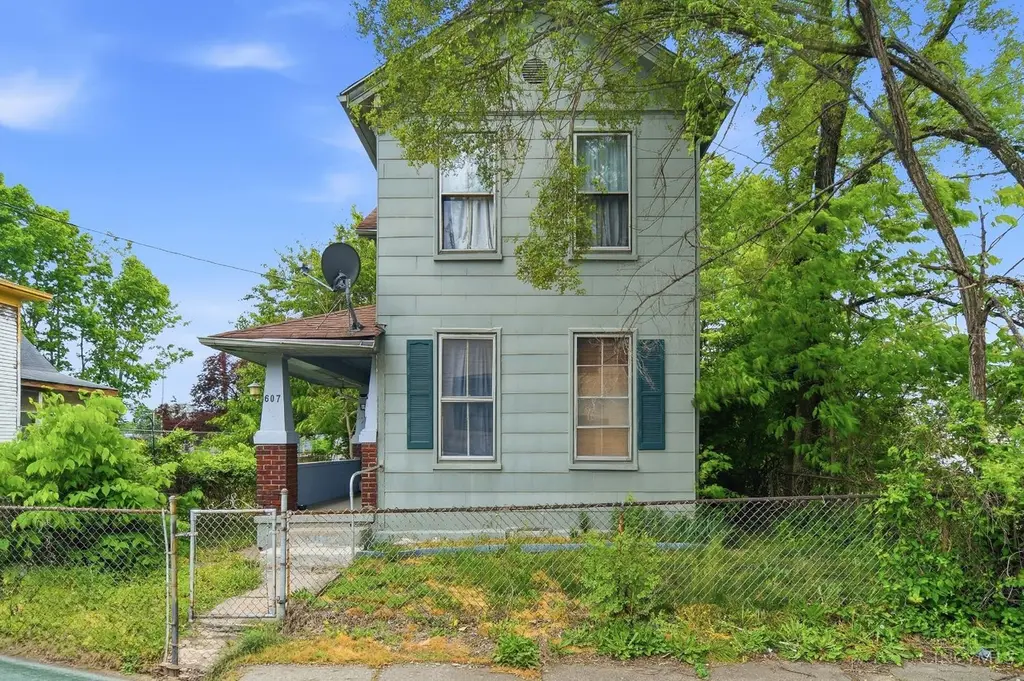
607 S Eighth St · Hamilton, OH
Flood risk 3/10 · Minor
- FEMA flood zone
- X (unshaded)
- Chance of flooding over 30 yrs
- 0.2%
- Est. flood insurance / yr
- $473 – $860
Fire risk 1/10 · Minimal
- Est. fire insurance / yr
- $713 – $1,323
Heat risk 5/10 · Moderate
- Hot days now (above 104°F)
- 7 days/yr
- Hot days in 30 yrs
- 20 days/yr
Wind risk 2/10 · Minimal
- Chance of severe wind over 30 yrs
- 1.0%
Air-quality risk 3/10 · Minor
- Unhealthy air days now
- 2 days/yr
- Unhealthy air days in 30 yrs
- 3 days/yr
Risk factors via First Street. Map © Google.
Why this score? — see what drove the B grade
The composite is a weighted blend of 9 inputs, each scored 0–100. Each bar is that input's sub-score; the figure is the points it added to the 100-point composite (weight × sub-score).
- Cash flow +30.0/30.0
- ARV discount +11.7/15.0
- DSCR +10.0/10.0
- 1% rule +9.7/10.0
- Livability +3.7/5.0
- Schools +3.6/10.0
- Rent growth +3.2/5.0
- Condition / age +2.5/5.0
- Appreciation +0.0/10.0
$99,900
🖨 Deal sheet 📄 Offer letter ✓ Due diligence
Listing remarks
Come check out this 3 bed / 1 bath home! TLC is needed, but the potential is there. The property is currently tenant-occupied on a month-to-month lease. Come check it out before it's gone!
Key facts
- 3,920 sq ft lot
- Built 1920
- Listed 49 days
Property features AI
Finance
- HOA & community: No HOA
Exterior
- Parking: Off-street and on-street parking
- Utilities: Public water; Public sewer; Natural gas
- Home design: Traditional single-family home; Two levels
- Construction: Block foundation; Other construction materials
- Exterior features: Shingle roof; Wood windows; Lot less than 0.5 acre (approximately 0.09 acres)
Interior
- Kitchen: Kitchen (12 x 10)
- Bedrooms: Three bedrooms total; Primary bedroom on level 1 (18 x 15); Bedroom 2 on level 2 (12 x 12); Bedroom 3 on level 2 (14 x 13)
- Bathrooms: One full bathroom on level 1
- Heating & cooling: Forced air heating (gas); Gas water heater; Window cooling unit
- Interior features: Six total rooms; Full unfinished basement
Neighborhood map
What this means for you Summary
Snapshot
- This is a 2-bed/1.0-bath single-family listed at $100k.
Deal economics
- At list price, monthly cash flow is $547 ($7k/yr) — positive.
- The deal already cash-flows at list — no discount required.
- Meets the 1% rule at list price ($1k rent vs $100k).
- Recommended offer: $97k (3.0% below list) — sets the bar for market timing.
- Cap rate 12.9% vs local median 4.6% in Hamilton — top-decile yield for the area; either an underpriced asset or a hidden risk that comps aren't pricing in. Stress-test before assuming the spread holds.
Location & tenants
- Location reads 73/100 on livability (#332 in OH) — a middle-class / working-renter tenant base. Strengths: cost of living A+, housing A+, schools B; Watch: crime C-, amenities C-, employment D.
- Hamilton City (suburban): math 42% / reading 45% proficiency, ranked #517 of 656 in OH (top 79%) — families likely to look elsewhere, expect single-tenant / working-renter base with shorter leases; 63% free/reduced lunch — lower-income household profile, screen leases tightly.
- Market conditions: Rents rising (+3.0%/yr); 196 active listings in the ZIP; 16 comparable units currently listed for rent nearby; rentals at typical pace (median 19d on market — plan ~3-4 weeks tenant-placement turnaround); solid renter incomes; 1,163 units permitted in Butler County in 2024 (356 in 5+ unit buildings).
Forward outlook
- Local home prices are declining (-3.0%/yr); year-one equity from $691 of loan paydown is wiped out by about $3k of value loss. Plan a longer hold.
- At projected returns (-3.0% appreciation + 3.0% rent growth), your $28k cash investment doubles in ~6 years — after that, you're playing with house money.
Negotiation context
- It's been on market 49 days — a 3% lower offer ($97k) is reasonable based on typical stale-listing flexibility.
Risks & watch-outs
- Watch-outs: built in 1920 — expect roof / HVAC / electrical / plumbing capex.
- Climate carrying-cost: extreme-heat days projected 7→20/yr by 2055 (HVAC capex compounding) — expect insurance premiums to compound above CPI over the hold.
Questions for the listing agent
- It's been on market 49 days. Have you received any prior offers? Is the seller open to a 3% concession, seller financing, or rate buy-down credit?
- Built in 1920 — when were the roof, HVAC, electrical panel, plumbing, and water heater last replaced?
- Is there a deadline driving the sale (1031 exchange, divorce, estate, relocation)? That informs how much negotiation room exists.
- Schools are B-rated — typically a magnet for longer-tenancy family renters. What's the average tenant stay here, and is there a school-zone premium baked into asking?
- What's the average days-on-market for RENTAL listings here right now (not sales)? A rising rental-DOM trend means longer vacancies and softer asking-rent achievability than the comps imply.
- What's the recent tenant-quality profile in this submarket — average credit score on applications, eviction rate, late-payment / NSF rate, and stable-employment percentage? A property-management company in the area should have these aggregated.
- How much new for-sale + rental construction is in the pipeline within 1–3 miles? Heavy new supply typically softens prices + rents 12–24 months out; constrained supply supports both.
Investment metrics
- 1% rule
- 1.47% ✓
- Cap rate
- 12.86%
- Cash-on-cash
- 23.45%
- DSCR
- 2.04
- GRM
- 5.7
CMA / ARV
- ARV (median comp)
- $110,195
- List price
- $99,900
- Delta
- -9.34%
- Verdict
- FAIR
- Comps
- 20 within 1.0 mi
Show comp detail 12 sales within ~0.75 mi
| Address | Dist | Beds/Ba | Sqft | Sold | Price | $/sf | Match |
|---|---|---|---|---|---|---|---|
| 334 Hanover St | 0.35mi | 3/1.5 (+1) | 1,484 (+1%) | 2mo | $174,000 | $117 | 73 |
| 1022 Campbell Ave | 0.52mi | 3/1.5 (+1) | 1,524 (+3%) | 0mo | $202,000 | $133 | 63 |
| 234 N Eleventh St | 0.65mi | 3/1.5 (+1) | 1,456 (-1%) | 1mo | $105,000 | $72 | 60 |
| 154 Beckett St | 0.63mi | 3/1.0 (+1) | 1,520 (+3%) | 2mo | $155,000 | $102 | 59 |
| 712 S Fourth St | 0.29mi | 3/2.0 (+1) | 1,320 (-10%) | 2mo | $167,000 | $127 | 58 |
| 1121 Grand Blvd | 0.73mi | 2/2.0 | 1,516 (+3%) | 4mo | $185,000 | $122 | 54 |
| 927 Harmon Ave | 0.61mi | 3/1.0 (+1) | 1,402 (-5%) | 7mo | $70,000 | $50 | 52 |
| 268 Hanover St | 0.41mi | 3/1.0 (+1) | 1,672 (+13%) | 5mo | $133,500 | $80 | 49 |
| 602 S Thirteenth St | 0.34mi | 3/1.5 (+1) | 1,270 (-14%) | 6mo | $68,000 | $54 | 49 |
| 842 Heaton St | 0.73mi | 3/1.5 (+1) | 1,400 (-5%) | 4mo | $108,750 | $78 | 47 |
| 130 Lulu | 0.55mi | 3/1.0 (+1) | 1,290 (-12%) | 2mo | $175,000 | $136 | 47 |
| 327 N Eighth St | 0.69mi | 3/2.5 (+1) | 1,653 (+12%) | 6mo | $228,000 | $138 | 32 |
Match score weights: distance 35% · size 25% · config 20% · recency 20%. Top-matched comps best support the ARV.
Projected returns pro-forma
-3.0% appreciation · 2.95% rent growth · sell at horizon
- IRR
- 16.5%
- Equity multiple
- 1.66×
- Total profit
- $18,532
- Equity at exit
- $14,895
- IRR
- 25.0%
- Equity multiple
- 3.17×
- Total profit
- $60,562
- Equity at exit
- $8,638
Cash invested: $27,972 (down + closing). Projections, not guarantees.
Landlord ↔ Tenant lean methodology
- Overall (STATE)
- 73 Landlord-Friendly
- State Ohio
- 73 Landlord-Friendly · R+6
- County
- — inherits STATE
- City
- — inherits STATE
ZIP-level market 45011
- Rents YoY
- 3.0%
- Active inventory
- 196
- Price-to-rent
- 5.7×
Monthly cashflow live
- Estimated rent
- $1,465 high interval (Pro) →
- Mortgage (P&I)
- −$524
- Tax from tax record
- −$45 /mo · $539/yr
- Insurance
- −$42
- HOA
- −$0
- Vacancy / Maint / Mgmt
- −$308
- Net cashflow
- $547
Break-even live
UW: 25.0% down · 7.5% · 30yr · 1.5% tax · 5.0% vac · 8.0% maint · 8.0% mgmt
Financing live
Cash to close
- Down payment
- $24,975
- Closing costs
- $2,997
- Reserves months
- —
- Total cash needed
- —
Loan-product check · same deal, 3 products live
Conventional
25% down · 7.5% · 30yr
- Down + closing
- —
- Monthly P&I
- —
- Monthly cashflow
- —
- DSCR
- —
- Eligible?
- —
Personal DTI + credit; lowest rate.
DSCR
20% down · 8.5% · 30yr
- Down + closing
- —
- Monthly P&I
- —
- Monthly cashflow
- —
- DSCR
- —
- Eligible?
- —
No personal income docs; deal must DSCR.
Hard money
10% down · 12.0% · 12mo
- Down + closing
- —
- Monthly P&I
- —
- Monthly cashflow
- —
- DSCR
- —
- Eligible?
- —
Short-term bridge; refi at stabilization.
Rent comps 16 comps
| Address | Beds | Baths | Sqft | Rent | $/sqft | DOM | Units | Dist |
|---|---|---|---|---|---|---|---|---|
| 829 Maple Ave Unit 3 Hamilton, OH | 3.0 | 1.0 | 1097 | $945 | $0.86 | 43d | 1 | 0.28mi |
| 513 S 3rd St Unit 513 Hamilton, OH | 1.0 | 1.0 | 1000 | $850 | $0.85 | 10d | 1 | 0.42mi |
| 969 Harmon Ave Hamilton, OH | 3.0 | 1.0 | 1350 | $1,695 | $1.26 | 43d | 1 | 0.63mi |
| 306 N 6th St Hamilton, OH | 3.0 | 1.5 | 1776 | $1,975 | $1.11 | 43d | 1 | 0.66mi |
| 967 Shuler Ave Hamilton, OH | 3.0 | 2.0 | 1466 | $1,795 | $1.22 | 43d | 1 | 0.69mi |
| 115 Dayton St Unit MAR-201 Hamilton, OH | 2.0 | 2.0 | 1040 | $1,775 | $1.71 | 4d | 1 | 0.74mi |
| 1025 Heaton St Hamilton, OH | 2.0 | 1.0 | 1436 | $1,025 | $0.71 | 23d | 1 | 0.75mi |
| 1118 Bonacker Ave Unit 1116 Hamilton, OH | 2.0 | 1.0 | 1000 | $1,195 | $1.20 | 43d | 1 | 0.76mi |
| 1310 Shuler Ave Unit 2 Hamilton, OH | 2.0 | 1.0 | 976 | $895 | $0.92 | 23d | 1 | 0.89mi |
| 906 Vine St Hamilton, OH | 3.0 | 2.0 | 1152 | $1,250 | $1.09 | 19d | 1 | 0.90mi |
| 417 Franklin St Hamilton, OH | 3.0 | 1.0 | 1256 | $1,150 | $0.92 | 1d | 1 | 1.20mi |
| 1794 See Ave Hamilton, OH | 3.0 | 1.0 | 1272 | $1,800 | $1.42 | 10d | 1 | 1.24mi |
| 432 Park Ave Hamilton, OH | 3.0 | 1.0 | 1276 | $1,300 | $1.02 | 2d | 1 | 1.25mi |
| 501 Prytania Ave Hamilton, OH | 3.0 | 1.5 | 1874 | $2,275 | $1.21 | 1d | 1 | 1.31mi |
| 1008 Fairview Ave Hamilton, OH | 3.0 | 1.0 | 1080 | $1,600 | $1.48 | 1d | 1 | 1.47mi |
| 1719 Shirley Ave Hamilton, OH | 3.0 | 1.0 | 1135 | $1,525 | $1.34 | 1d | 1 | 1.50mi |
Listing history 14 events
-
2026-06-18days on market $99,900 Active 49 DOM
-
2026-06-17days on market $99,900 Active 48 DOM
-
2026-06-16days on market $99,900 Active 47 DOM
-
2026-06-15days on market $99,900 Active 46 DOM
-
2026-06-13days on market $99,900 Active 44 DOM
-
2026-06-13days on market $99,900 Active 43 DOM
-
2026-06-09days on market $99,900 Active 40 DOM
-
2026-06-08days on market $99,900 Active 39 DOM
-
2026-06-07days on market $99,900 Active 38 DOM
-
2026-06-03days on market $99,900 Active 34 DOM
-
2026-06-02days on market $99,900 Active 33 DOM
-
2026-06-01days on market $99,900 Active 32 DOM
-
2026-05-31days on market $99,900 Active 31 DOM
-
2026-04-30$99,900 Active 188-char remark
ⓘ Source: listings_history table (triggers on properties + properties_extension) + one-shot
backfill from property_details.listing_events for pre-trigger history.
Tax reassessment forecast OH · Partial reset (capped growth)
- Current annual tax
- $539 · $45/mo
- Projected year-2 tax
- $1,049 · $87/mo
- Expected delta
- +$510/yr (+$42/mo · 94.5%)
ⓘ Screening estimate from a state-policy table — verify with the county assessor before closing.
Climate risk First Street
- Flood 3/10 Moderate FEMA zone X (unshaded) · 20% chance over 30 yrs
- Wildfire 1/10 Low
- Heat 5/10 Major 7 d/yr ≥104°F today · 20 d/yr by 30 yrs out
- Wind 2/10 Low 100% chance of damaging wind over 30 yrs
- Air quality 3/10 Moderate 2 unhealthy d/yr today · 3 by 30 yrs out
Nearby sold comps map
Loading sold comps map…
Walkable amenities ~0.75 mi
Loading nearby amenities…
Taxation est. · year 1
- Rental income
- $17,577
- − Mortgage interest
- −$5,596
- − Property taxes
- −$539
- − Insurance
- −$500
- − Repairs & maintenance
- −$1,406
- − Management
- −$1,406
- − Depreciation
- −$2,906
- Taxable income
- $5,224
- Est. tax owed @ 24.0%
- −$1,254
- After-tax cash flow
- $5,307/yr
For passive investors: Depreciation is non-cash, so a rental often shows a tax loss while cash-flowing — sheltering income. Rental losses are passive: they offset passive income freely, and up to $25,000/yr can offset ordinary (W-2) income if you actively participate and your MAGI is under $100k (phasing out to $0 by $150k); unused losses carry forward. On sale, claimed depreciation is recaptured at up to 25%, and gains may owe capital-gains tax (a 1031 exchange can defer both). Figures are a year-1 estimate at your 24.0% rate — not tax advice; consult a CPA.
Schools (NCES district)
- District
- Hamilton City
- NCES district ID
- 3904410
- Math proficiency
- 42% ▼ -13.00%
- Reading proficiency
- 45% ▼ -10.00%
- Median HH income
- $40,488
- Composite
- 36.48/100
- National rank
- #4656
- State rank
- #517 of 656 in OH
Livability — Hamilton
- Score
- 73/100
- State rank
- #332
- US rank
- #5467
Category grades
Schools grade is shown separately in the Schools card above.
Census & demographics
- Census place
- Hamilton, OH
- County
- Butler County · 381,674 people
- City population
- 140,900
- Metro
- Cincinnati, OH-KY-IN
- Population (ZIP)
- 75,864
- Household income
- $91,873
- Rent vs Own
- Severe rent burden
- 1795.0
Population outlook (Butler County) Hauer SSP2
- Today (2025)
- 387,706 people
- By 2030
- 392,028 · +1.1%
- By 2040
- 395,307 · +2.0%
- By 2050
- 391,116 · +0.9%
- By 2075
- 378,642 · -2.3%
- By 2100
- 343,248 · -11.5%
Race, ethnicity, and origin ACS 2023
- Neighborhood character
- Predominantly White (68%)
- Race & ethnicity
- White 68% Hispanic / Latino 12% Black 11% Two or more races 9% Asian 4%
- Hispanic origin (detail)
- Mexican 7%
- Common ancestry
- Romanian 2% Italian 2% Slovak 2%
- Foreign-born
- 11% · Canada, Vietnam, China
- Languages at home
- 86% English-only · Spanish 8% Other Indo-European 2% Vietnamese 1%
Political lean MEDSL · Butler
- 2024 margin
- Strong R (+26.3) · D 36.4% · R 62.7%
- 2008→2024 swing
- -3.6pp toward R · 2008: -22.6pp · 2024: -26.3pp
- All cycles
- 2024: R+26.3 2020: R+24.0 2016: R+28.3 2012: R+26.2 2008: R+22.6
Not yet ingested
- Civics
- —
Market trends
- HPI YoY
- ▼ -188.67%
- Current HPI
- 259.7868
- Rent YoY
- ▲ 2.95%
- Metro
- Cincinnati, OH-KY-IN
- State GDP YoY
- ▲ 1.98%
- F500 in state
- 48
Industry mix (Fortune 500 HQ in OH)
| Industry | F500 HQs | Revenue |
|---|---|---|
| Insurance | 3 | $145B |
|
||
| Industrial Machinery | 3 | $49B |
|
||
| Financial Services | 3 | $24B |
|
||
| Consumer Goods | 2 | $93B |
|
||
| Aerospace / Defense | 2 | $47B |
|
||
| Utilities | 2 | $33B |
|
||
Price history
1 event — show timeline
- 2026-04-30 Listed $99,900 Cincy MLS
Property tax history
+0.5%/yrLatest (2025): $539 · +0.4% YoY. Source: county tax records.
Cash-flow waterfall
monthlySold comps — $/sqft
last 12 mo · ≤1 miLoading sold comps…