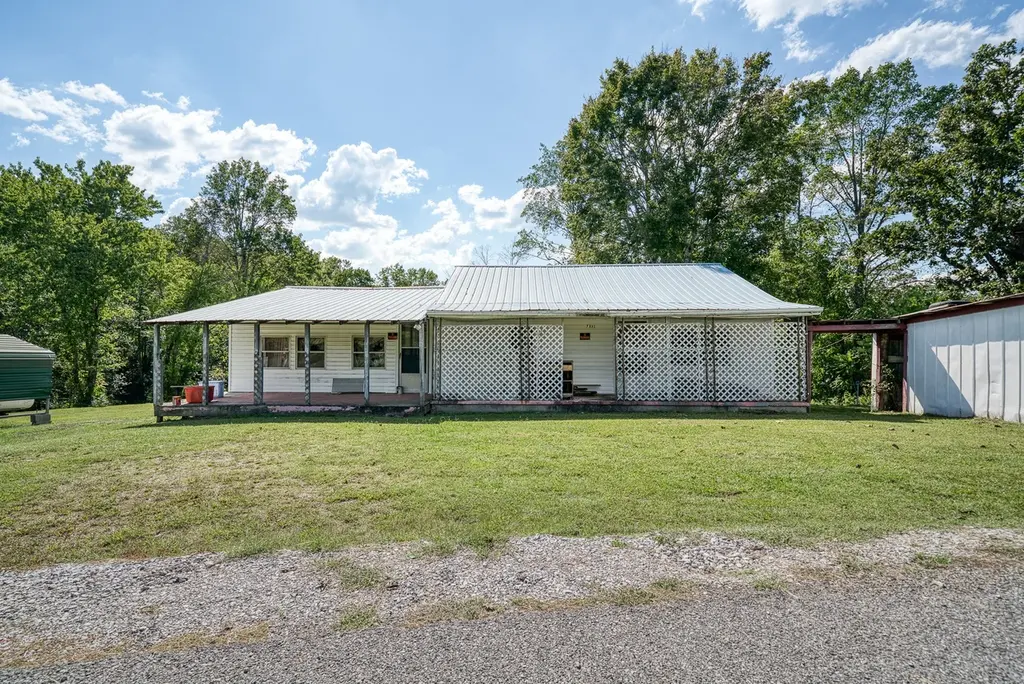
7331 Ashburn Rd · Baxter, TN
Flood risk 1/10 · Minimal
- FEMA flood zone
- X (unshaded)
- Chance of flooding over 30 yrs
- 0.0%
- Est. flood insurance / yr
- $507 – $1,088
Fire risk 5/10 · Moderate
- Est. fire insurance / yr
- $949 – $1,763
Heat risk 4/10 · Minor
- Hot days now (above 104°F)
- 7 days/yr
- Hot days in 30 yrs
- 20 days/yr
Wind risk 3/10 · Minor
- Chance of severe wind over 30 yrs
- 8.0%
Air-quality risk 2/10 · Minimal
- Unhealthy air days now
- 0 days/yr
- Unhealthy air days in 30 yrs
- 1 days/yr
Risk factors via First Street. Map © Google.
Why this score? — see what drove the D grade
The composite is a weighted blend of 9 inputs, each scored 0–100. Each bar is that input's sub-score; the figure is the points it added to the 100-point composite (weight × sub-score).
- ARV discount +15.0/15.0
- Appreciation +10.0/10.0
- Cash flow +5.1/30.0
- Livability +3.3/5.0
- Schools +2.6/10.0
- Rent growth +2.5/5.0
- Condition / age +2.5/5.0
- 1% rule +0.0/10.0
- DSCR +0.0/10.0
$229,900
🖨 Deal sheet 📄 Offer letter ✓ Due diligence
Listing remarks MLS
Investor Dream Opportunity, This is a very unique property with 4 acres and 3 houses on this property. 3 addresses under one deed. The measurements listed is for the main house only. Great opportunity for 3 rentals. Main home is 1512 sq ft, second home is a mobile home 3 bedrooms, 2 baths with an addition added space, 3rd home is a 1 bedroom, 1 bath home. All homes are in need repair and being sold AS IS. Mobile home is Rented other 2 homes are vacant.
Key facts
- 4 acres
- 3 addresses
- 3 houses
Tags
Neighborhood map
What this means for you Summary
Snapshot
- This is a 2-bed/1.0-bath single-family listed at $230k.
Deal economics
- At list price, monthly cash flow is $-527 ($-6k/yr) — negative.
- To cash-flow at today's rent, offer at most $137k (40.5% below list).
- To meet the 1% rule (rent ≥ 1% of price), the offer needs to be $105k (54.4% below list).
- Recommended offer: $105k (54.4% below list) — sets the bar for 1% rule.
- Cap rate 3.5% vs local median 1.8% in Baxter — top-decile yield for the area; either an underpriced asset or a hidden risk that comps aren't pricing in. Stress-test before assuming the spread holds.
Location & tenants
- Location reads 66/100 on livability (#131 in TN) — a middle-class / working-renter tenant base. Strengths: cost of living A+, housing A+, crime B+; Watch: health & safety C-, employment D, schools F.
- Putnam County (town): math 32% / reading 31% proficiency, ranked #49 of 139 in TN (top 35%) — families likely to look elsewhere, expect single-tenant / working-renter base with shorter leases.
- Market conditions: 200 active listings in the ZIP; 700 units permitted in Putnam County in 2024 (48 in 5+ unit buildings).
Forward outlook
- In year one you build about $25k of equity ($2k loan paydown + $23k appreciation (10.0% local appreciation)).
- Putnam County population projected at +16% by 2050 — long-run rental-demand tailwind backs the buy-and-hold thesis.
- By year 2, paydown + projected appreciation supports a ~$40k cash-out refi (75% LTV) — recoverable capital for the next deal without selling this one.
Negotiation context
- It's been on market 262 days — a 12% lower offer ($202k) is reasonable based on typical stale-listing flexibility.
- 2 sale attempts; this cycle's ask has dropped $20k (8%) from the opening price — seller is motivated, your offer sets the floor, not the list.
Risks & watch-outs
- Climate carrying-cost: moderate wildfire risk — expect insurance premiums to compound above CPI over the hold.
Questions for the listing agent
- What do current leases actually rent for vs. the listed asking? Can we see a recent rent roll and the last 12 months of T-12 income?
- It's been on market 262 days. Have you received any prior offers? Is the seller open to a 54% concession, seller financing, or rate buy-down credit?
- Built in 1962 — when were the roof, HVAC, electrical panel, plumbing, and water heater last replaced?
- Why hasn't it sold? Are there any deal-killer items the seller is aware of (foundation, flood, title, zoning, code violations)?
- Is there a deadline driving the sale (1031 exchange, divorce, estate, relocation)? That informs how much negotiation room exists.
- Schools are F-rated, which usually means shorter tenancies and higher turnover. Who's the typical renter profile here, and what's been the actual vacancy rate?
- The area grade is low — what's the realistic commute time and amenity access for the typical tenant pool here? Any planned neighborhood developments (good or bad) we should know about?
- What's the average days-on-market for RENTAL listings here right now (not sales)? A rising rental-DOM trend means longer vacancies and softer asking-rent achievability than the comps imply.
- What's the recent tenant-quality profile in this submarket — average credit score on applications, eviction rate, late-payment / NSF rate, and stable-employment percentage? A property-management company in the area should have these aggregated.
- How much new for-sale + rental construction is in the pipeline within 1–3 miles? Heavy new supply typically softens prices + rents 12–24 months out; constrained supply supports both.
Investment metrics
- 1% rule
- 0.46% ✗
- Cap rate
- 3.54%
- Cash-on-cash
- -9.83%
- DSCR
- 0.56
- GRM
- 18.3
CMA / ARV
- ARV (median comp)
- $297,450
- List price
- $229,900
- Delta
- -22.71%
- Verdict
- UNDERPRICED
- Comps
- 2 within 1.0 mi
Projected returns pro-forma
10.0% appreciation · 3.0% rent growth · sell at horizon
- IRR
- 17.4%
- Equity multiple
- 2.42×
- Total profit
- $91,492
- Equity at exit
- $207,112
- IRR
- 16.4%
- Equity multiple
- 5.59×
- Total profit
- $295,589
- Equity at exit
- $446,645
Cash invested: $64,372 (down + closing). Projections, not guarantees.
Landlord ↔ Tenant lean methodology
- Overall (STATE)
- 87 Strongly Landlord-Friendly
- State Tennessee
- 87 Strongly Landlord-Friendly · R+13
- County
- — inherits STATE
- City
- — inherits STATE
ZIP-level market 38544
- Home prices YoY
- 5.0%
- Active inventory
- 200
- Price-to-rent
- 18.3×
Monthly cashflow live
- Estimated rent
- $1,048 medium interval (Pro) →
- Mortgage (P&I)
- −$1,206
- Tax from tax record
- −$54 /mo · $646/yr
- Insurance
- −$96
- HOA
- −$0
- Vacancy / Maint / Mgmt
- −$220
- Net cashflow
- $-527
Break-even live
UW: 25.0% down · 7.5% · 30yr · 1.5% tax · 5.0% vac · 8.0% maint · 8.0% mgmt
Financing live
Cash to close
- Down payment
- $57,475
- Closing costs
- $6,897
- Reserves months
- —
- Total cash needed
- —
Loan-product check · same deal, 3 products live
Conventional
25% down · 7.5% · 30yr
- Down + closing
- —
- Monthly P&I
- —
- Monthly cashflow
- —
- DSCR
- —
- Eligible?
- —
Personal DTI + credit; lowest rate.
DSCR
20% down · 8.5% · 30yr
- Down + closing
- —
- Monthly P&I
- —
- Monthly cashflow
- —
- DSCR
- —
- Eligible?
- —
No personal income docs; deal must DSCR.
Hard money
10% down · 12.0% · 12mo
- Down + closing
- —
- Monthly P&I
- —
- Monthly cashflow
- —
- DSCR
- —
- Eligible?
- —
Short-term bridge; refi at stabilization.
Listing history 20 events
-
2026-06-19days on market $229,900 Active 262 DOM
-
2026-06-18days on market $229,900 Active 261 DOM
-
2026-06-17days on market $229,900 Active 260 DOM
-
2026-06-16days on market $229,900 Active 259 DOM
-
2026-06-15days on market $229,900 Active 258 DOM
-
2026-06-14days on market $229,900 Active 256 DOM
-
2026-06-13days on market $229,900 Active 255 DOM
-
2026-06-10days on market $229,900 Active 253 DOM
-
2026-06-09days on market $229,900 Active 252 DOM
-
2026-06-08days on market $229,900 Active 251 DOM
-
2026-06-07days on market $229,900 Active 250 DOM
-
2026-06-05days on market $229,900 Active 247 DOM
-
2026-06-02days on market $229,900 Active 245 DOM
-
2026-06-01days on market $229,900 Active 244 DOM
-
2026-05-31days on market $229,900 Active 243 DOM
-
2026-05-30days on market $229,900 Active 242 DOM
-
2026-01-12price $229,900 456-char remark
Show marketing remark (456 chars)
Investor Dream Opportunity, This is a very unique property with 4 acres and 3 houses on this property. 3 addresses under one deed. The measurements listed is for the main house only. Great opportunity for 3 rentals. Main home is 1512 sq ft, second home is a mobile home 3 bedrooms, 2 baths with an addition added space, 3rd home is a 1 bedroom, 1 bath home. All homes are in need repair and being sold AS IS. Mobile home is Rented other 2 homes are vacant.
-
2025-10-01$249,900 Active 456-char remark
Show marketing remark (456 chars)
Investor Dream Opportunity, This is a very unique property with 4 acres and 3 houses on this property. 3 addresses under one deed. The measurements listed is for the main house only. Great opportunity for 3 rentals. Main home is 1512 sq ft, second home is a mobile home 3 bedrooms, 2 baths with an addition added space, 3rd home is a 1 bedroom, 1 bath home. All homes are in need repair and being sold AS IS. Mobile home is Rented other 2 homes are vacant.
-
2025-09-30$249,900 Active 456-char remark
Show marketing remark (456 chars)
Investor Dream Opportunity, This is a very unique property with 4 acres and 3 houses on this property. 3 addresses under one deed. The measurements listed is for the main house only. Great opportunity for 3 rentals. Main home is 1512 sq ft, second home is a mobile home 3 bedrooms, 2 baths with an addition added space, 3rd home is a 1 bedroom, 1 bath home. All homes are in need repair and being sold AS IS. Mobile home is Rented other 2 homes are vacant.
ⓘ Source: listings_history table (triggers on properties + properties_extension) + one-shot
backfill from property_details.listing_events for pre-trigger history.
Tax reassessment forecast TN · Resets to sale price
- Current annual tax
- $646 · $54/mo
- Projected year-2 tax
- $1,632 · $136/mo
- Expected delta
- +$986/yr (+$82/mo · 152.7%)
ⓘ Screening estimate from a state-policy table — verify with the county assessor before closing.
Climate risk First Street
- Flood 1/10 Low FEMA zone X (unshaded) · 0% chance over 30 yrs
- Wildfire 5/10 Major
- Heat 4/10 Moderate 7 d/yr ≥104°F today · 20 d/yr by 30 yrs out
- Wind 3/10 Moderate 8% chance of damaging wind over 30 yrs
- Air quality 2/10 Low 0 unhealthy d/yr today · 1 by 30 yrs out
Nearby sold comps map
Loading sold comps map…
Walkable amenities ~0.75 mi
Loading nearby amenities…
Taxation est. · year 1
- Rental income
- $12,575
- − Mortgage interest
- −$12,878
- − Property taxes
- −$646
- − Insurance
- −$1,150
- − Repairs & maintenance
- −$1,006
- − Management
- −$1,006
- − Depreciation
- −$6,688
- Taxable loss
- −$10,799
- Est. tax savings @ 24.0%
- +$2,592
- After-tax cash flow
- $-3,737/yr
For passive investors: Depreciation is non-cash, so a rental often shows a tax loss while cash-flowing — sheltering income. Rental losses are passive: they offset passive income freely, and up to $25,000/yr can offset ordinary (W-2) income if you actively participate and your MAGI is under $100k (phasing out to $0 by $150k); unused losses carry forward. On sale, claimed depreciation is recaptured at up to 25%, and gains may owe capital-gains tax (a 1031 exchange can defer both). Figures are a year-1 estimate at your 24.0% rate — not tax advice; consult a CPA.
Schools (NCES district)
- District
- Putnam County
- NCES district ID
- 4703480
- Math proficiency
- 32% ▼ -6.00%
- Reading proficiency
- 31% ▼ -5.00%
- Median HH income
- $35,738
- Composite
- 26.09/100
- National rank
- #7291
- State rank
- #49 of 139 in TN
Livability — Baxter
- Score
- 66/100
- State rank
- #131
- US rank
- #12008
Category grades
Schools grade is shown separately in the Schools card above.
Census & demographics
- Population (ZIP)
- 7,413
Population outlook (Putnam County) Hauer SSP2
- Today (2025)
- 80,122 people
- By 2030
- 82,798 · +3.3%
- By 2040
- 87,913 · +9.7%
- By 2050
- 92,659 · +15.6%
- By 2075
- 104,965 · +31.0%
- By 2100
- 113,256 · +41.4%
Race, ethnicity, and origin ACS 2023
- Neighborhood character
- Predominantly White (88%)
- Race & ethnicity
- White 88% Hispanic / Latino 8% Two or more races 3%
- Hispanic origin (detail)
- Common ancestry
- Iranian 2% Slovak 2% Lithuanian 2%
- Foreign-born
- 4% · Canada, South Korea, Jamaica
- Languages at home
- 93% English-only · Spanish 7%
Political lean MEDSL · Putnam
- 2024 margin
- Solid R (+47.4) · D 25.7% · R 73.1% · Other 1.1%
- 2008→2024 swing
- -20.5pp toward R · 2008: -26.9pp · 2024: -47.4pp
- All cycles
- 2024: R+47.4 2020: R+43.4 2016: R+45.0 2012: R+37.1 2008: R+26.9
Not yet ingested
- Civics
- —
Market trends
- HPI YoY
- ▲ 15.12%
- Current HPI
- 320.6255
- Rent YoY
- —
- Metro
- —
- State GDP YoY
- ▲ 2.78%
- F500 in state
- 22
Industry mix (Fortune 500 HQ in TN)
| Industry | F500 HQs | Revenue |
|---|---|---|
| Healthcare | 3 | $91B |
|
||
| Retail | 3 | $72B |
|
||
| Transportation / Logistics | 1 | $88B |
|
||
| Paper / Packaging | 1 | $19B |
|
||
| Insurance | 1 | $13B |
|
||
| Energy | 1 | $12B |
|
||
Price history
-8.0% since first listed4 events — show timeline
- 2026-01-12 Price Changed $229,900 UCMLS
- 2026-01-12 Price Changed $229,900 REALTRACS as Distributed by MLS Grid
- 2025-10-01 Listed $249,900 UCMLS
- 2025-09-30 Listed $249,900 REALTRACS as Distributed by MLS Grid
Property tax history
+3.9%/yrLatest (2025): $646 · +0.0% YoY. Source: county tax records.
Cash-flow waterfall
monthlySold comps — $/sqft
last 12 mo · ≤1 miLoading sold comps…