 Multi-family
1648 New Sharon Rd · Starks, ME
Flood risk 6/10 · Moderate
- FEMA flood zone
- X
- Chance of flooding over 30 yrs
- 0.72%
- Est. flood insurance / yr
- $507 – $1,088
Fire risk 1/10 · Minimal
- Est. fire insurance / yr
- $669 – $1,243
Heat risk 2/10 · Minimal
- Hot days now (above 90°F)
- 7 days/yr
- Hot days in 30 yrs
- 15 days/yr
Wind risk 3/10 · Minor
- Chance of severe wind over 30 yrs
- 8.0%
Air-quality risk 1/10 · Minimal
- Unhealthy air days now
- 0 days/yr
- Unhealthy air days in 30 yrs
- 0 days/yr
Risk factors via First Street. Map © Google.
Why this score? — see what drove the B grade
The composite is a weighted blend of 9 inputs, each scored 0–100. Each bar is that input's sub-score; the figure is the points it added to the 100-point composite (weight × sub-score).
- Cash flow +30.0/30.0
- 1% rule +10.0/10.0
- DSCR +10.0/10.0
- ARV discount +7.5/15.0
- Appreciation +6.2/10.0
- Schools +5.0/10.0
- Rent growth +2.5/5.0
- Livability +2.5/5.0
- Condition / age +1.0/5.0
$75,000
🖨 Deal sheet 📄 Offer letter ✓ Due diligence
Multi-family units
County records classify this as Multi-Family (2-4 Unit). Listing-text estimate: 1 unit. estimate disagrees with records
Listing remarks MLS
This 3 bedroom 1 bathroom home sits well off the road on a 1.004 acre surveyed lot. An unnamed stream borders one side of the property and Lemon Stream is just across the road.
Key facts
- Unnamed stream
- 1 acre surveyed lot
- 1 acre lot
Tags
Neighborhood map
What this means for you Summary
Snapshot
- This is a 3-bed/1.0-bath multifamily listed at $75k. Condition is rated poor.
Deal economics
- At list price, monthly cash flow is $505 ($6k/yr) — positive.
- The deal already cash-flows at list — no discount required.
- Meets the 1% rule at list price ($1k rent vs $75k).
- Recommended offer: $66k (12.0% below list) — sets the bar for market timing.
Location & tenants
- Location reads: area grade B — affects rentability + tenant quality, not the cash-flow math above.
- Market conditions: 129 units permitted in Somerset County in 2024 (0 in 5+ unit buildings).
Forward outlook
- In year one you build about $2k of equity ($519 loan paydown + $2k appreciation (2.4% local appreciation)).
- Somerset County population projected at -25% by 2050 — secular population decline; favor cash flow + early exit over multi-decade hold.
- At projected returns (2.4% appreciation + 3.0% rent growth), your $21k cash investment doubles in ~3 years — after that, you're playing with house money.
Negotiation context
- It's been on market 150 days — a 12% lower offer ($66k) is reasonable based on typical stale-listing flexibility.
Risks & watch-outs
- Climate carrying-cost: major flood risk — expect insurance premiums to compound above CPI over the hold.
Questions for the listing agent
- It's been on market 150 days. Have you received any prior offers? Is the seller open to a 12% concession, seller financing, or rate buy-down credit?
- Have any recent inspections been done? Can we get a copy of the seller's disclosures and any deferred-maintenance estimates?
- Why hasn't it sold? Are there any deal-killer items the seller is aware of (foundation, flood, title, zoning, code violations)?
- Is there a deadline driving the sale (1031 exchange, divorce, estate, relocation)? That informs how much negotiation room exists.
- What's the average days-on-market for RENTAL listings here right now (not sales)? A rising rental-DOM trend means longer vacancies and softer asking-rent achievability than the comps imply.
- What's the recent tenant-quality profile in this submarket — average credit score on applications, eviction rate, late-payment / NSF rate, and stable-employment percentage? A property-management company in the area should have these aggregated.
- How much new apartment / multifamily construction is in the pipeline within 1–3 miles? Heavy new supply (>2% of stock underway) typically softens rents 12–24 months out; light construction supports rent growth.
Investment metrics
- 1% rule
- 1.65% ✓
- Cap rate
- 14.38%
- Cash-on-cash
- 28.89%
- DSCR
- 2.29
- GRM
- 5.0
CMA / ARV
- ARV (median comp)
- $166,848
- List price
- $75,000
- Delta
- -55.05%
- Verdict
- UNDERPRICED
- Comps
- 3 within 1.0 mi
Projected returns pro-forma
2.44% appreciation · 3.0% rent growth · sell at horizon
- IRR
- 33.8%
- Equity multiple
- 2.86×
- Total profit
- $39,007
- Equity at exit
- $31,368
- IRR
- 34.6%
- Equity multiple
- 5.60×
- Total profit
- $96,558
- Equity at exit
- $46,585
Cash invested: $21,000 (down + closing). Projections, not guarantees.
Landlord ↔ Tenant lean methodology
- Overall (STATE)
- 41 Moderately Tenant-Leaning
- State Maine
- 41 Moderately Tenant-Leaning · D+2
- County
- — inherits STATE
- City
- — inherits STATE
ZIP-level market 04911
- Home prices YoY
- 1.1%
- Price-to-rent
- 5.0×
Monthly cashflow live
- Estimated rent
- $1,238 medium interval (Pro) →
- Mortgage (P&I)
- −$393
- Tax from tax record
- −$48 /mo · $580/yr
- Insurance
- −$31
- HOA
- −$0
- Vacancy / Maint / Mgmt
- −$260
- Net cashflow
- $505
Break-even live
UW: 25.0% down · 7.5% · 30yr · 1.5% tax · 5.0% vac · 8.0% maint · 8.0% mgmt
Financing live
Cash to close
- Down payment
- $18,750
- Closing costs
- $2,250
- Reserves months
- —
- Total cash needed
- —
Loan-product check · same deal, 3 products live
Conventional
25% down · 7.5% · 30yr
- Down + closing
- —
- Monthly P&I
- —
- Monthly cashflow
- —
- DSCR
- —
- Eligible?
- —
Personal DTI + credit; lowest rate.
DSCR
20% down · 8.5% · 30yr
- Down + closing
- —
- Monthly P&I
- —
- Monthly cashflow
- —
- DSCR
- —
- Eligible?
- —
No personal income docs; deal must DSCR.
Hard money
10% down · 12.0% · 12mo
- Down + closing
- —
- Monthly P&I
- —
- Monthly cashflow
- —
- DSCR
- —
- Eligible?
- —
Short-term bridge; refi at stabilization.
Listing history 17 events
-
2026-06-18days on market $75,000 Active 150 DOM
-
2026-06-17days on market $75,000 Active 149 DOM
-
2026-06-16days on market $75,000 Active 148 DOM
-
2026-06-15days on market $75,000 Active 147 DOM
-
2026-06-13days on market $75,000 Active 145 DOM
-
2026-06-12days on market $75,000 Active 144 DOM
-
2026-06-09days on market $75,000 Active 141 DOM
-
2026-06-08days on market $75,000 Active 140 DOM
-
2026-06-07days on market $75,000 Active 139 DOM
-
2026-06-07days on market $75,000 Active 138 DOM
-
2026-06-04days on market $75,000 Active 135 DOM
-
2026-06-02days on market $75,000 Active 134 DOM
-
2026-06-01days on market $75,000 Active 133 DOM
-
2026-05-31days on market $75,000 Active 132 DOM
-
2026-05-31days on market $75,000 Active 131 DOM
-
2026-04-14price $75,000 176-char remark
Show marketing remark (176 chars)
This 3 bedroom 1 bathroom home sits well off the road on a 1.004 acre surveyed lot. An unnamed stream borders one side of the property and Lemon Stream is just across the road.
-
2026-01-19$79,000 Active 176-char remark
Show marketing remark (176 chars)
This 3 bedroom 1 bathroom home sits well off the road on a 1.004 acre surveyed lot. An unnamed stream borders one side of the property and Lemon Stream is just across the road.
ⓘ Source: listings_history table (triggers on properties + properties_extension) + one-shot
backfill from property_details.listing_events for pre-trigger history.
Tax reassessment forecast ME · Partial reset (capped growth)
- Current annual tax
- $580 · $48/mo
- Projected year-2 tax
- $800 · $67/mo
- Expected delta
- +$220/yr (+$18/mo · 37.9%)
ⓘ Screening estimate from a state-policy table — verify with the county assessor before closing.
Climate risk First Street
- Flood 6/10 Major FEMA zone X · 72% chance over 30 yrs
- Wildfire 1/10 Low
- Heat 2/10 Low 7 d/yr ≥90°F today · 15 d/yr by 30 yrs out
- Wind 3/10 Moderate 8% chance of damaging wind over 30 yrs
- Air quality 1/10 Low 0 unhealthy d/yr today · 0 by 30 yrs out
Nearby sold comps map
Loading sold comps map…
Walkable amenities ~0.75 mi
Loading nearby amenities…
Taxation est. · year 1
- Rental income
- $14,862
- − Mortgage interest
- −$4,201
- − Property taxes
- −$580
- − Insurance
- −$375
- − Repairs & maintenance
- −$1,189
- − Management
- −$1,189
- − Depreciation
- −$2,182
- Taxable income
- $5,146
- Est. tax owed @ 24.0%
- −$1,235
- After-tax cash flow
- $4,831/yr
For passive investors: Depreciation is non-cash, so a rental often shows a tax loss while cash-flowing — sheltering income. Rental losses are passive: they offset passive income freely, and up to $25,000/yr can offset ordinary (W-2) income if you actively participate and your MAGI is under $100k (phasing out to $0 by $150k); unused losses carry forward. On sale, claimed depreciation is recaptured at up to 25%, and gains may owe capital-gains tax (a 1031 exchange can defer both). Figures are a year-1 estimate at your 24.0% rate — not tax advice; consult a CPA.
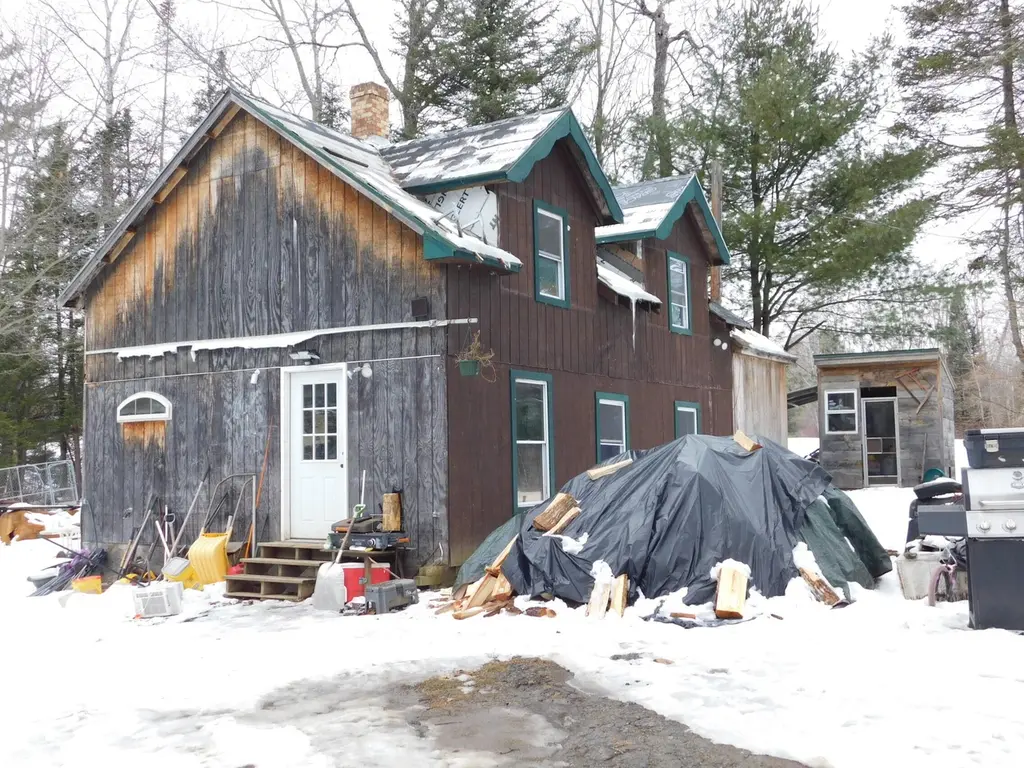
Condition & rehab AI · 12 photos
This multi-family home requires extensive repairs and maintenance to improve its condition and increase its value.
Repairs flagged
- Major roof — Missing shingles and debris
- Major exterior siding — Weathered and damaged
- Major HVAC/mechanicals — Cluttered and possibly inoperable
Value-add opportunities
- Both Clean and declutter the interior — Improves aesthetics and functionality
- Both Replace worn flooring — Enhances comfort and value
- Both Repair and replace damaged roof — Ensures structural integrity and safety
- Both Replace damaged exterior siding — Enhances curb appeal and value
- Both Replace HVAC/mechanicals — Improves comfort and energy efficiency
Renovation cost estimate screening
| Repair item | Severity | Est. cost |
|---|---|---|
| roof · Missing shingles and debris | Major | $15,000–50,000 |
| exterior siding · Weathered and damaged | Major | $15,000–50,000 |
| HVAC/mechanicals · Cluttered and possibly inoperable | Major | $15,000–50,000 |
| Total estimated repair cost · 3 items | $45,000–150,000 |
Value-add ROI direction
- Both Clean and declutter the interior — Improves aesthetics and functionality ↑
- Both Replace worn flooring — Enhances comfort and value ↑
- Both Repair and replace damaged roof — Ensures structural integrity and safety ↑
- Both Replace damaged exterior siding — Enhances curb appeal and value ↑
- Both Replace HVAC/mechanicals — Improves comfort and energy efficiency ↑
ⓘ Cost ranges are severity-bucket heuristics (US national rule-of-thumb). Get contractor quotes + a written scope before underwriting a rehab budget.
Schools (NCES district)
No district data.
Livability — Starks
No livability data for this city. (Only ~50 U.S. cities are tracked.)
Census & demographics
- Population (ZIP)
- 1,787
Population outlook (Somerset County) Hauer SSP2
- Today (2025)
- 48,335 people
- By 2030
- 46,268 · -4.3%
- By 2040
- 41,276 · -14.6%
- By 2050
- 36,137 · -25.2%
- By 2075
- 26,408 · -45.4%
- By 2100
- 18,836 · -61.0%
Race, ethnicity, and origin ACS 2023
- Neighborhood character
- Predominantly White (97%)
- Race & ethnicity
- White 97% Hispanic / Latino 1%
- Common ancestry
- Lithuanian 10% Slovak 6% Romanian 3%
- Foreign-born
- 1% · China
Political lean MEDSL · Somerset
- 2024 margin
- Strong R (+27.1) · D 35.6% · R 62.7% · Other 1.7%
- 2008→2024 swing
- -32.8pp toward R · 2008: 5.7pp · 2024: -27.1pp
- All cycles
- 2024: R+27.1 2020: R+23.4 2016: R+22.8 2012: D+1.7 2008: D+5.7
Not yet ingested
- Civics
- —
Market trends
- HPI YoY
- ▲ 2.44%
- Current HPI
- 227.5178
- Rent YoY
- —
- Metro
- —
- State GDP YoY
- —
- F500 in state
- 0
Price history
-5.1% since first listed2 events — show timeline
- 2026-04-14 Price Changed $75,000 MREIS
- 2026-01-19 Listed $79,000 MREIS
Property tax history
+1.4%/yrLatest (2024): $580 · +3.2% YoY. Source: county tax records.
Cash-flow waterfall
monthlySold comps — $/sqft
last 12 mo · ≤1 miLoading sold comps…