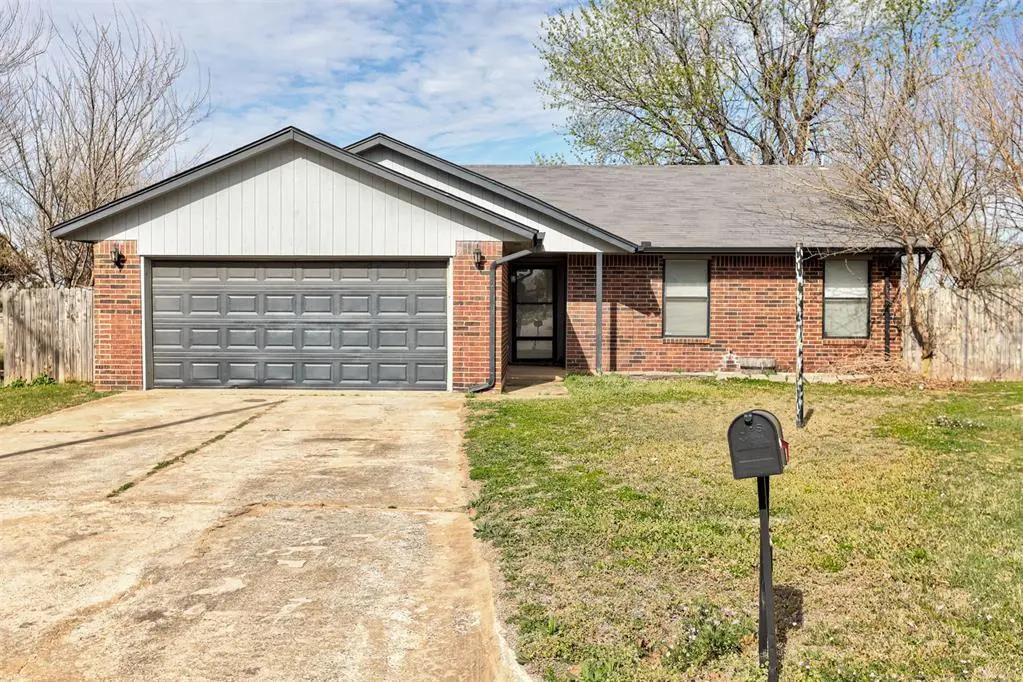
405 W Twisted Branch Way · Mustang, OK
Flood risk 1/10 · Minimal
- FEMA flood zone
- X (unshaded)
- Chance of flooding over 30 yrs
- 0.0%
- Est. flood insurance / yr
- $507 – $1,088
Fire risk 4/10 · Minor
- Est. fire insurance / yr
- $2,463 – $4,575
Heat risk 6/10 · Moderate
- Hot days now (above 107°F)
- 7 days/yr
- Hot days in 30 yrs
- 19 days/yr
Wind risk 3/10 · Minor
- Chance of severe wind over 30 yrs
- 4.0%
Air-quality risk 1/10 · Minimal
- Unhealthy air days now
- 0 days/yr
- Unhealthy air days in 30 yrs
- 0 days/yr
Risk factors via First Street. Map © Google.
Why this score? — see what drove the D- grade
The composite is a weighted blend of 9 inputs, each scored 0–100. Each bar is that input's sub-score; the figure is the points it added to the 100-point composite (weight × sub-score).
- Cash flow +13.3/30.0
- ARV discount +6.3/15.0
- DSCR +4.0/10.0
- 1% rule +3.5/10.0
- Livability +3.5/5.0
- Schools +3.1/10.0
- Condition / age +2.5/5.0
- Rent growth +2.4/5.0
- Appreciation +0.0/10.0
$200,000
🖨 Deal sheet 📄 Offer letter ✓ Due diligence
Listing remarks MLS
HOME IS SITTING ON A BEAUTIFUL CUL-DE-SAC LOT FACING THE EAST. BEAUTIFUL BACK YARD WITH STORAGE SHED AND A NEW FENCE.
Key facts
- Scenic views
- 8,956 sq ft lot
- 2 garage spots
Tags
Neighborhood map
What this means for you Summary
Snapshot
- This is a 3-bed/2.0-bath single-family listed at $200k.
Deal economics
- At list price, monthly cash flow is $0 ($2/yr) — positive.
- The deal already cash-flows at list — no discount required.
- To meet the 1% rule (rent ≥ 1% of price), the offer needs to be $170k (15.2% below list).
- Recommended offer: $170k (15.2% below list) — sets the bar for 1% rule.
- Cap rate 6.3% vs local median 4.5% in Mustang — top-decile yield for the area; either an underpriced asset or a hidden risk that comps aren't pricing in. Stress-test before assuming the spread holds.
Location & tenants
- Location reads 69/100 on livability (#52 in OK) — a middle-class / working-renter tenant base. Strengths: crime A+, cost of living A+, housing A+; Watch: amenities F, commute F, health & safety F.
- Mustang (suburban): math 35% / reading 33% proficiency, ranked #28 of 270 in OK (top 10%) — families likely to look elsewhere, expect single-tenant / working-renter base with shorter leases.
- Zoned schools: Mustang Centennial Es (math 46% / reading 42%, grade F, #73 of 845 statewide, top 9%, 643 students, 0% FRL); Mustang Hs (math 28% / reading 39%, grade F, #65 of 447 statewide, top 14%, 3,756 students, 0% FRL) — zoned schools average 0% FRL vs 28% district-wide (28 pts lower); this property's tenant base skews higher-income than the district average.
- Market conditions: Rents soft (-0.3%/yr); 512 active listings in the ZIP; 18 comparable units currently listed for rent nearby; rentals at typical pace (median 20d on market — plan ~3-4 weeks tenant-placement turnaround); solid renter incomes; 260 units permitted in Canadian County in 2024 (0 in 5+ unit buildings).
Forward outlook
- Local home prices are declining (-3.0%/yr); year-one equity from $1k of loan paydown is wiped out by about $6k of value loss. Plan a longer hold.
- Canadian County population projected at +64% by 2050 — long-run rental-demand tailwind backs the buy-and-hold thesis.
Negotiation context
- It's been on market 27 days — a 2% lower offer ($197k) is reasonable based on typical stale-listing flexibility.
- 5 sale attempts since 27y ago; this cycle's ask has dropped $15k (7%) from the opening price — seller is motivated, your offer sets the floor, not the list.
- Current owner paid $142k; 41% above their basis — modest negotiation headroom, anchor on the comps not their cost.
Risks & watch-outs
- Climate carrying-cost: extreme-heat days projected 7→19/yr by 2055 (HVAC capex compounding) — expect insurance premiums to compound above CPI over the hold.
Questions for the listing agent
- Is there a deadline driving the sale (1031 exchange, divorce, estate, relocation)? That informs how much negotiation room exists.
- The area grade is low — what's the realistic commute time and amenity access for the typical tenant pool here? Any planned neighborhood developments (good or bad) we should know about?
- What's the average days-on-market for RENTAL listings here right now (not sales)? A rising rental-DOM trend means longer vacancies and softer asking-rent achievability than the comps imply.
- What's the recent tenant-quality profile in this submarket — average credit score on applications, eviction rate, late-payment / NSF rate, and stable-employment percentage? A property-management company in the area should have these aggregated.
- How much new for-sale + rental construction is in the pipeline within 1–3 miles? Heavy new supply typically softens prices + rents 12–24 months out; constrained supply supports both.
Investment metrics
- 1% rule
- 0.85% ✗
- Cap rate
- 6.29%
- Cash-on-cash
- 0.00%
- DSCR
- 1.00
- GRM
- 9.8
CMA / ARV
- ARV (on-the-fly)
- $194,990
- Comps found
- 12
Show comp detail 12 sales within ~0.75 mi
| Address | Dist | Beds/Ba | Sqft | Sold | Price | $/sf | Match |
|---|---|---|---|---|---|---|---|
| 405 W Twisted Branch Way | 0.00mi | 3/2.0 | 1,258 (0%) | 0mo | $200,000 | $159 | 100 |
| 302 W Branches Way | 0.18mi | 3/2.0 | 1,256 (-0%) | 10mo | $190,000 | $151 | 83 |
| 335 W Cedar Dr | 0.63mi | 3/2.0 | 1,318 (+5%) | 0mo | $204,000 | $155 | 62 |
| 438 W Strasburg Way | 0.35mi | 3/2.0 | 1,371 (+9%) | 10mo | $220,000 | $160 | 61 |
| 1013 N Crystal Way | 0.69mi | 3/2.0 | 1,330 (+6%) | 1mo | $130,000 | $98 | 58 |
| 442 W Apple Branch Way | 0.19mi | 3/3.0 | 1,069 (-15%) | 9mo | $185,000 | $173 | 54 |
| 917 N Crystal Way | 0.67mi | 3/2.0 | 1,395 (+11%) | 4mo | $215,000 | $154 | 47 |
| 309 E Twelve Oaks Ter | 0.69mi | 3/2.0 | 1,368 (+9%) | 8mo | $205,000 | $150 | 47 |
| 938 W Ridgecrest Way | 0.72mi | 3/2.0 | 1,366 (+9%) | 6mo | $195,000 | $143 | 47 |
| 913 N Kirk Way | 0.73mi | 3/2.0 | 1,374 (+9%) | 5mo | $205,000 | $149 | 46 |
| 246 W Chantilly Way | 0.31mi | 2/1.0 (-1) | 1,070 (-15%) | 7mo | $171,500 | $160 | 46 |
| 433 W Forest Dr | 0.73mi | 3/1.5 | 1,135 (-10%) | 6mo | $188,000 | $166 | 43 |
Match score weights: distance 35% · size 25% · config 20% · recency 20%. Top-matched comps best support the ARV.
Projected returns pro-forma
-3.0% appreciation · 0.0% rent growth · sell at horizon
- IRR
- -19.6%
- Equity multiple
- 0.33×
- Total profit
- $-37,371
- Equity at exit
- $29,821
- IRR
- -20.2%
- Equity multiple
- 0.08×
- Total profit
- $-51,746
- Equity at exit
- $17,292
Cash invested: $56,000 (down + closing). Projections, not guarantees.
Landlord ↔ Tenant lean methodology
- Overall (STATE)
- 83 Strongly Landlord-Friendly
- State Oklahoma
- 83 Strongly Landlord-Friendly · R+20
- County
- — inherits STATE
- City
- — inherits STATE
ZIP-level market 73064
- Home prices YoY
- -17.9%
- Rents YoY
- -0.3%
- Active inventory
- 512
- Price-to-rent
- 9.8×
Monthly cashflow live
- Estimated rent
- $1,697 high interval (Pro) →
- Mortgage (P&I)
- −$1,049
- Tax from tax record
- −$208 /mo · $2,496/yr
- Insurance
- −$83
- HOA
- −$0
- Vacancy / Maint / Mgmt
- −$356
- Net cashflow
- $0
Break-even live
UW: 25.0% down · 7.5% · 30yr · 1.5% tax · 5.0% vac · 8.0% maint · 8.0% mgmt
Financing live
Cash to close
- Down payment
- $50,000
- Closing costs
- $6,000
- Reserves months
- —
- Total cash needed
- —
Loan-product check · same deal, 3 products live
Conventional
25% down · 7.5% · 30yr
- Down + closing
- —
- Monthly P&I
- —
- Monthly cashflow
- —
- DSCR
- —
- Eligible?
- —
Personal DTI + credit; lowest rate.
DSCR
20% down · 8.5% · 30yr
- Down + closing
- —
- Monthly P&I
- —
- Monthly cashflow
- —
- DSCR
- —
- Eligible?
- —
No personal income docs; deal must DSCR.
Hard money
10% down · 12.0% · 12mo
- Down + closing
- —
- Monthly P&I
- —
- Monthly cashflow
- —
- DSCR
- —
- Eligible?
- —
Short-term bridge; refi at stabilization.
Rent comps 18 comps
| Address | Beds | Baths | Sqft | Rent | $/sqft | DOM | Units | Dist |
|---|---|---|---|---|---|---|---|---|
| 605 N Ponderosa Way Mustang, OK | 3.0 | 2.0 | 1686 | $2,000 | $1.19 | 23d | 1 | 0.28mi |
| 548 W Shadow Ridge Way Mustang, OK | 4.0 | 2.0 | 1734 | $1,945 | $1.12 | 20d | 1 | 0.47mi |
| 736 W Celestial Way Mustang, OK | 1.0–2.0 | 1.0 | 838 | $1,695 | $2.02 | 1d | 8 | 0.66mi |
| 1013 W Gladys Way Mustang, OK | 3.0 | 2.0 | 1116 | $1,450 | $1.30 | 21d | 1 | 0.75mi |
| 936 W Tesio Way Mustang, OK | 3.0 | 1.5 | 1255 | $1,425 | $1.14 | 23d | 1 | 0.79mi |
| 360 N Pebble Creek Ter Mustang, OK | 2.0 | 2.0 | 1200 | $1,272 | $1.06 | 23d | 1 | 0.91mi |
| 360 N Pebble Creek Ter Mustang, OK | 2.0 | 2.0 | 1200 | $1,271 | $1.06 | 16d | 1 | 0.91mi |
| 360 N Pebble Creek Ter Mustang, OK | 3.0 | 2.0 | 1350 | $1,530 | $1.13 | 2d | 1 | 0.91mi |
| 360 N Pebble Creek Ter Mustang, OK | 2.0 | 2.0 | 1200 | $1,271 | $1.06 | 20d | 1 | 0.91mi |
| 360 N Pebble Creek Ter Mustang, OK | 3.0 | 2.0 | 1350 | $1,540 | $1.14 | 14d | 1 | 0.91mi |
| 1136 W Johnathan Way Mustang, OK | 3.0 | 2.0 | 1415 | $1,450 | $1.02 | 23d | 1 | 0.94mi |
| 742 W Juniper Dr Mustang, OK | 3.0 | 1.5 | 1100 | $1,475 | $1.34 | 1d | 1 | 1.02mi |
| 1247 W Huntington Way Unit a Mustang, OK | 2.0 | 1.5 | 1024 | $1,200 | $1.17 | 3d | 1 | 1.07mi |
| Greens at Mustang Creek Mustang, OK | 1.0–2.0 | 1.0–2.0 | 818 | $1,275 | $1.56 | 1d | 1 | 1.10mi |
| 313 N Shannon Way Mustang, OK | 3.0 | 2.0 | 1706 | $1,750 | $1.03 | 16d | 1 | 1.12mi |
| 733 W Perry Dr Mustang, OK | 3.0 | 1.5 | 999 | $1,345 | $1.35 | 1d | 1 | 1.16mi |
| 4904 Vine Cliff Rd Mustang, OK | 3.0 | 2.0 | 1838 | $2,295 | $1.25 | 23d | 1 | 1.23mi |
| 609 E Linden Ln Mustang, OK | 3.0 | 2.0 | 1242 | $1,700 | $1.37 | 23d | 1 | 1.44mi |
Listing history 19 events
-
2026-04-22status Pending
-
2026-04-15price $200,000
-
2026-04-08price $210,000
-
2026-03-25$215,000 Active
-
2023-05-25soldstatus $142,000
-
2016-05-13soldstatus $115,000
Show marketing remark (117 chars)
HOME IS SITTING ON A BEAUTIFUL CUL-DE-SAC LOT FACING THE EAST. BEAUTIFUL BACK YARD WITH STORAGE SHED AND A NEW FENCE.
-
2016-05-13soldstatus $115,000 Sold 117-char remark
Show marketing remark (117 chars)
HOME IS SITTING ON A BEAUTIFUL CUL-DE-SAC LOT FACING THE EAST. BEAUTIFUL BACK YARD WITH STORAGE SHED AND A NEW FENCE.
-
2016-04-07status Pending 117-char remark
Show marketing remark (117 chars)
HOME IS SITTING ON A BEAUTIFUL CUL-DE-SAC LOT FACING THE EAST. BEAUTIFUL BACK YARD WITH STORAGE SHED AND A NEW FENCE.
-
2016-04-06$114,900 Active 117-char remark
Show marketing remark (117 chars)
HOME IS SITTING ON A BEAUTIFUL CUL-DE-SAC LOT FACING THE EAST. BEAUTIFUL BACK YARD WITH STORAGE SHED AND A NEW FENCE.
-
2009-12-11soldstatus $86,001 189-char remark
Show marketing remark (189 chars)
HUD PROPERTY SUBJECT TO HUD REGULATIONS AND BIDDING PROCEDURES. OFFERED AS INSURABLE W/$2448 IN ESCROWS. BID OPENING DATE 10/26/09. 421-378946 BUYER TO VERIFY ALL INFO INCLUDING LOT SIZE!!
-
2009-09-04$83,000 189-char remark
Show marketing remark (189 chars)
HUD PROPERTY SUBJECT TO HUD REGULATIONS AND BIDDING PROCEDURES. OFFERED AS INSURABLE W/$2448 IN ESCROWS. BID OPENING DATE 10/26/09. 421-378946 BUYER TO VERIFY ALL INFO INCLUDING LOT SIZE!!
-
2002-01-02soldstatus $76,000
-
2001-12-28soldstatus $76,000
-
2001-09-28$79,900
-
1999-05-20soldstatus $68,000
-
1999-05-14soldstatus $68,000
-
1999-03-29$70,000
-
1998-06-19soldstatus $67,500
-
1997-07-02soldstatus $62,500
ⓘ Source: listings_history table (triggers on properties + properties_extension) + one-shot
backfill from property_details.listing_events for pre-trigger history.
Tax reassessment forecast OK · Resets to sale price
- Current annual tax
- $2,496 · $208/mo
- Projected year-2 tax
- $2,496 · $208/mo
- Expected delta
- $0/yr ($0/mo · 0.0%)
ⓘ Screening estimate from a state-policy table — verify with the county assessor before closing.
Climate risk First Street
- Flood 1/10 Low FEMA zone X (unshaded) · 0% chance over 30 yrs
- Wildfire 4/10 Moderate
- Heat 6/10 Major 7 d/yr ≥107°F today · 19 d/yr by 30 yrs out
- Wind 3/10 Moderate 4% chance of damaging wind over 30 yrs
- Air quality 1/10 Low 0 unhealthy d/yr today · 0 by 30 yrs out
Nearby sold comps map
Loading sold comps map…
Walkable amenities ~0.75 mi
Loading nearby amenities…
Taxation est. · year 1
- Rental income
- $20,359
- − Mortgage interest
- −$11,203
- − Property taxes
- −$2,496
- − Insurance
- −$1,000
- − Repairs & maintenance
- −$1,629
- − Management
- −$1,629
- − Depreciation
- −$5,818
- Taxable loss
- −$3,416
- Est. tax savings @ 24.0%
- +$820
- After-tax cash flow
- $822/yr
For passive investors: Depreciation is non-cash, so a rental often shows a tax loss while cash-flowing — sheltering income. Rental losses are passive: they offset passive income freely, and up to $25,000/yr can offset ordinary (W-2) income if you actively participate and your MAGI is under $100k (phasing out to $0 by $150k); unused losses carry forward. On sale, claimed depreciation is recaptured at up to 25%, and gains may owe capital-gains tax (a 1031 exchange can defer both). Figures are a year-1 estimate at your 24.0% rate — not tax advice; consult a CPA.
Schools (NCES district)
- District
- Mustang
- NCES district ID
- 4021000
- Math proficiency
- 35% ▼ -10.00%
- Reading proficiency
- 33% ▼ -7.00%
- Median HH income
- $67,559
- Composite
- 31.21/100
- National rank
- #6038
- State rank
- #28 of 270 in OK
Livability — Mustang
- Score
- 69/100
- State rank
- #52
- US rank
- #8746
Category grades
Schools grade is shown separately in the Schools card above.
Census & demographics
- Census place
- Mustang, OK
- County
- Canadian County · 154,341 people
- City population
- 28,919
- Metro
- Oklahoma City, OK
- Population (ZIP)
- 28,919
- Household income
- $94,402
- Rent vs Own
- Severe rent burden
- 384.0
Population outlook (Canadian County) Hauer SSP2
- Today (2025)
- 174,062 people
- By 2030
- 195,170 · +12.1%
- By 2040
- 239,293 · +37.5%
- By 2050
- 285,457 · +64.0%
- By 2075
- 403,766 · +132.0%
- By 2100
- 498,766 · +186.5%
Race, ethnicity, and origin ACS 2023
- Neighborhood character
- Predominantly White (74%)
- Race & ethnicity
- White 74% Two or more races 11% Hispanic / Latino 10% Native American 3% Black 3% Asian 2%
- Hispanic origin (detail)
- Mexican 8%
- Common ancestry
- Italian 2% Scottish 2% Slovak 2%
- Foreign-born
- 4% · Canada, Vietnam
- Languages at home
- 93% English-only · Spanish 5% Other Indo-European 1% Tagalog/Filipino 1%
Political lean MEDSL · Canadian
- 2024 margin
- Solid R (+40.4) · D 28.8% · R 69.2% · Other 2.0%
- 2008→2024 swing
- +11.9pp toward D · 2008: -52.2pp · 2024: -40.4pp
- All cycles
- 2024: R+40.4 2020: R+43.3 2016: R+51.2 2012: R+54.4 2008: R+52.2
Not yet ingested
- Civics
- —
Market trends
- HPI YoY
- ▼ -56.66%
- Current HPI
- 260.2863
- Rent YoY
- ▼ -0.33%
- Metro
- Oklahoma City, OK
- State GDP YoY
- ▲ 1.55%
- F500 in state
- 6
Industry mix (Fortune 500 HQ in OK)
| Industry | F500 HQs | Revenue |
|---|---|---|
| Energy | 3 | $48B |
|
||
Price history
+220.0% since first listed19 events — show timeline
- 2026-04-22 Pending — MLSOK
- 2026-04-15 Price Changed $200,000 MLSOK
- 2026-04-08 Price Changed $210,000 MLSOK
- 2026-03-25 Listed $215,000 MLSOK
- 2023-05-25 Sold (Public Records) $142,000 Public Records
- 2016-05-13 Sold (Public Records) $115,000 Public Records
- 2016-05-13 Sold (MLS) $115,000 MLSOK
- 2016-04-07 Pending — MLSOK
- 2016-04-06 Listed $114,900 MLSOK
- 2009-12-11 Sold (MLS) $86,001 MLSOK
- 2009-09-04 Listed $83,000 MLSOK
- 2002-01-02 Sold (Public Records) $76,000 Public Records
- 2001-12-28 Sold (MLS) $76,000 MLSOK
- 2001-09-28 Listed $79,900 MLSOK
- 1999-05-20 Sold (Public Records) $68,000 Public Records
- 1999-05-14 Sold (MLS) $68,000 MLSOK
- 1999-03-29 Listed $70,000 MLSOK
- 1998-06-19 Sold (Public Records) $67,500 Public Records
- 1997-07-02 Sold (Public Records) $62,500 Public Records
Property tax history
+7.2%/yrLatest (2025): $2,496 · +27.3% YoY. Source: county tax records.
Cash-flow waterfall
monthlySold comps — $/sqft
last 12 mo · ≤1 miLoading sold comps…