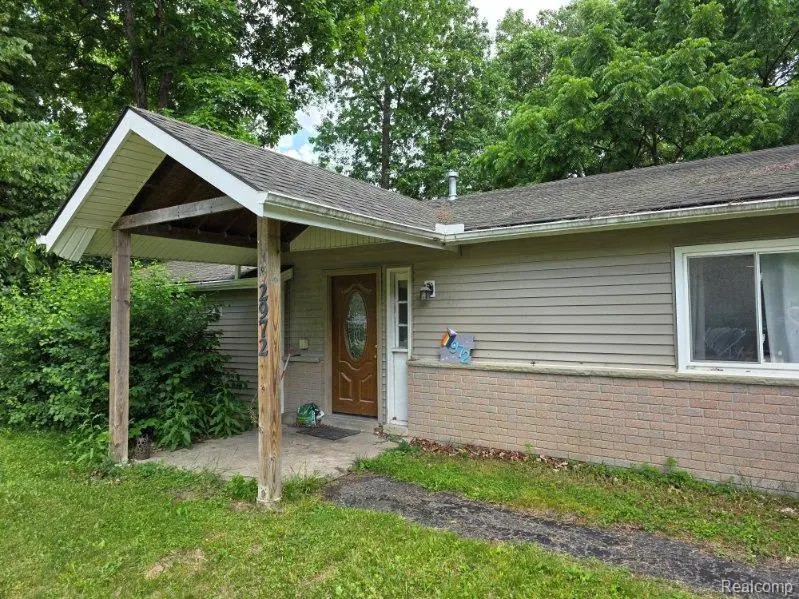
2972 E Textile Rd · Pittsfield, MI
Flood risk 7/10 · Major
- FEMA flood zone
- A
- Chance of flooding over 30 yrs
- 0.95%
- Est. flood insurance / yr
- $1,009 – $1,996
Fire risk 2/10 · Minimal
- Est. fire insurance / yr
- $784 – $1,456
Heat risk 3/10 · Minor
- Hot days now (above 99°F)
- 7 days/yr
- Hot days in 30 yrs
- 15 days/yr
Wind risk 2/10 · Minimal
- Chance of severe wind over 30 yrs
- —
Air-quality risk 2/10 · Minimal
- Unhealthy air days now
- 1 days/yr
- Unhealthy air days in 30 yrs
- 3 days/yr
Risk factors via First Street. Map © Google.
Why this score? — see what drove the B- grade
The composite is a weighted blend of 9 inputs, each scored 0–100. Each bar is that input's sub-score; the figure is the points it added to the 100-point composite (weight × sub-score).
- Cash flow +21.8/30.0
- ARV discount +15.0/15.0
- DSCR +6.9/10.0
- 1% rule +6.7/10.0
- Schools +6.5/10.0
- Rent growth +3.9/5.0
- Livability +2.5/5.0
- Condition / age +2.5/5.0
- Appreciation +0.0/10.0
$175,000
🖨 Deal sheet (PDF) 📄 Offer letter ✓ Due diligence
Listing remarks MLS
Very private yard. Home needs complete makeover! Investors, Good location! Needs roof, floors for sure! All room sizes estimated.
Key facts
- 0.4 acre lot
- Built 1945
- Listed 7 days
Property features AI
Exterior
- Utilities: Private well water; Septic system; Natural gas
- Home design: Residential property; One-story structure; Built in 1945
- Construction: Slab foundation; Aluminum exterior; Built in 1945
- Exterior features: Aluminum exterior construction; Gravel road access; Frontage approx. 92 feet; Approximately 0.4 acre lot
Interior
- Kitchen: Kitchen on entry level (approx. 14 x 15)
- Bedrooms: Bedroom 1 on entry level, approximately 12 x 12; Bedroom 2 on entry level, approximately 10 x 10
- Bathrooms: One full bathroom on entry level (approx. 8 x 7); Two total lavatories (one lavatory approx. 5 x 4)
- Heating & cooling: Natural gas fuel; Heating: Other (see remarks); Cooling: Other
- Interior features: 6 total rooms; Living room located on entry level, approximately 15 x 15; Kitchen located on entry level, approximately 14 x 15
Neighborhood map
What this means for you Summary
Snapshot
- This is a 2-bed/1.5-bath single-family listed at $175k.
Deal economics
- At list price, monthly cash flow is $146 ($2k/yr) — positive.
- The deal already cash-flows at list — no discount required.
- Meets the 1% rule at list price ($2k rent vs $175k).
Location & tenants
- Location reads: area grade B — affects rentability + tenant quality, not the cash-flow math above.
- Ann Arbor Public Schools (urban): math 71% / reading 81% proficiency, ranked #6 of 540 in MI (top 1%) — strong family-tenant draw, lease renewals of 3-5y typical.
- Zoned schools: Ann Arbor Open At Mack School (math 74% / reading 84%, grade A, #21 of 1,397 statewide, top 2%, 517 students, 11% FRL); Scarlett Middle School (math 37% / reading 57%, grade D+, #143 of 493 statewide, top 30%, 615 students, 53% FRL); Huron High School (math 66% / reading 79%, grade B+, #25 of 713 statewide, top 4%, 1,635 students, 31% FRL).
- Market conditions: Rents rising fast (+5.7%/yr); 148 active listings in the ZIP; 2 comparable units currently listed for rent nearby; solid renter incomes; 996 units permitted in Washtenaw County in 2024 (492 in 5+ unit buildings).
Forward outlook
- Local home prices are declining (-3.0%/yr); year-one equity from $1k of loan paydown is wiped out by about $5k of value loss. Plan a longer hold.
- Washtenaw County population projected at +25% by 2050 — long-run rental-demand tailwind backs the buy-and-hold thesis.
Negotiation context
- Only 7 days on market — expect competitive offers; lowballing is unlikely to land.
- 3 sale attempts since 12y ago with the ask held roughly flat each time — persistent listings suggest the price (not the market) is what's stuck; bring a comps-based counter.
- Current owner paid $25k; list at $175k implies a 600% gain — meaningful room to come down on a strong offer.
Risks & watch-outs
- Watch-outs: flood insurance adds $125/mo; built in 1945 — expect roof / HVAC / electrical / plumbing capex.
- Climate carrying-cost: in FEMA flood zone A (mandatory federal flood insurance) — expect insurance premiums to compound above CPI over the hold.
Questions for the listing agent
- Built in 1945 — when were the roof, HVAC, electrical panel, plumbing, and water heater last replaced?
- What's the actual annual flood-insurance premium (NFIP or private), and is the property in a SFHA with mandatory coverage?
- Is there a deadline driving the sale (1031 exchange, divorce, estate, relocation)? That informs how much negotiation room exists.
- What's the average days-on-market for RENTAL listings here right now (not sales)? A rising rental-DOM trend means longer vacancies and softer asking-rent achievability than the comps imply.
- What's the recent tenant-quality profile in this submarket — average credit score on applications, eviction rate, late-payment / NSF rate, and stable-employment percentage? A property-management company in the area should have these aggregated.
- How much new for-sale + rental construction is in the pipeline within 1–3 miles? Heavy new supply typically softens prices + rents 12–24 months out; constrained supply supports both.
Investment metrics
- 1% rule
- 1.17% ✓
- Cap rate
- 8.15%
- Cash-on-cash
- 6.63%
- DSCR
- 1.29
- GRM
- 7.1
CMA / ARV
- ARV (on-the-fly)
- $248,832
- Comps found
- 1
Show comp detail 1 sale within ~0.75 mi
| Address | Dist | Beds/Ba | Sqft | Sold | Price | $/sf | Match |
|---|---|---|---|---|---|---|---|
| 5662 Hampshire Ln | 0.58mi | 2/2.5 | 1,487 (+15%) | 1mo | $285,000 | $192 | 43 |
Match score weights: distance 35% · size 25% · config 20% · recency 20%. Top-matched comps best support the ARV.
Projected returns pro-forma
-3.0% appreciation · 5.72% rent growth · sell at horizon
- IRR
- -7.0%
- Equity multiple
- 0.73×
- Total profit
- $-13,166
- Equity at exit
- $26,093
- IRR
- 6.2%
- Equity multiple
- 1.53×
- Total profit
- $26,123
- Equity at exit
- $15,131
Cash invested: $49,000 (down + closing). Projections, not guarantees.
Landlord ↔ Tenant lean methodology
- Overall (STATE)
- 62 Landlord-Friendly
- State Michigan
- 62 Landlord-Friendly · EVEN
- County
- — inherits STATE
- City
- — inherits STATE
ZIP-level market 48108
- Rents YoY
- 5.7%
- Active inventory
- 148
- Price-to-rent
- 7.1×
Monthly cashflow live
- Estimated rent
- $2,040 medium interval (Pro) →
- Mortgage (P&I)
- −$918
- Tax from tax record
- −$350 /mo · $4,206/yr
- Insurance
- −$73
- Flood insurance flood zone
- −$125 /mo · $1,502/yr
- HOA
- −$0
- Vacancy / Maint / Mgmt
- −$428
- Net cashflow
- $146
Break-even live
Sensitivity live
| Price | -10% $245 | -5% $195 | +0% $146 | +5% $96 | +10% $46 |
|---|---|---|---|---|---|
| Rent | -10% $-16 | -5% $65 | +0% $146 | +5% $226 | +10% $307 |
| Rate | -1.0pp $234 | -0.5pp $190 | base $146 | +0.5pp $100 | +1.0pp $54 |
UW: 25.0% down · 7.5% · 30yr · 1.5% tax · 5.0% vac · 8.0% maint · 8.0% mgmt
Financing live
Cash to close
- Down payment
- $43,750
- Closing costs
- $5,250
- Reserves months
- —
- Total cash needed
- —
Loan-product check · same deal, 3 products live
Conventional
25% down · 7.5% · 30yr
- Down + closing
- —
- Monthly P&I
- —
- Monthly cashflow
- —
- DSCR
- —
- Eligible?
- —
Personal DTI + credit; lowest rate.
DSCR
20% down · 8.5% · 30yr
- Down + closing
- —
- Monthly P&I
- —
- Monthly cashflow
- —
- DSCR
- —
- Eligible?
- —
No personal income docs; deal must DSCR.
Hard money
10% down · 12.0% · 12mo
- Down + closing
- —
- Monthly P&I
- —
- Monthly cashflow
- —
- DSCR
- —
- Eligible?
- —
Short-term bridge; refi at stabilization.
Rent comps 2 comps
| Address | Beds | Baths | Sqft | Rent | $/sqft | DOM | Units | Dist |
|---|---|---|---|---|---|---|---|---|
| 5825 Plum Hollow Dr Ypsilanti, MI | 1.0–2.0 | 1.0–2.0 | 880 | $1,909 | $2.17 | 15d | 1 | 0.52mi |
| 5675 Hampshire Ln Unit 1 Ypsilanti, MI | 2.0 | 2.0 | 1395 | $2,000 | $1.43 | 45d | 1 | 0.62mi |
Listing history 9 events
-
2026-06-22days on market $175,000 Active 7 DOM
-
2026-06-18days on market $175,000 Active 4 DOM
-
2026-06-17days on market $175,000 Active 3 DOM
-
2026-06-16days on market $175,000 Active 2 DOM
-
2026-06-15remarks 358-char remark
-
2026-06-15days on market $175,000 Active 1 DOM
-
2026-06-15days on market $175,000 Active 3 DOM
-
2026-06-14remarks 22-char remark
-
2026-06-14$175,000 Active 1 DOM
ⓘ Source: listings_history table (triggers on properties + properties_extension) + one-shot
backfill from property_details.listing_events for pre-trigger history.
Tax reassessment forecast MI · Partial reset (capped growth)
- Current annual tax
- $4,206 · $350/mo
- Projected year-2 tax
- $4,206 · $350/mo
- Expected delta
- $0/yr ($0/mo · 0.0%)
ⓘ Screening estimate from a state-policy table — verify with the county assessor before closing.
Climate risk First Street
- Flood 7/10 Severe FEMA zone A · 95% chance over 30 yrs
- Wildfire 2/10 Low
- Heat 3/10 Moderate 7 d/yr ≥99°F today · 15 d/yr by 30 yrs out
- Wind 2/10 Low
- Air quality 2/10 Low 1 unhealthy d/yr today · 3 by 30 yrs out
Nearby sold comps map
Loading sold comps map…
Walkable amenities ~0.75 mi
Loading nearby amenities…
Taxation est. · year 1
- Rental income
- $24,483
- − Mortgage interest
- −$9,803
- − Property taxes
- −$4,206
- − Insurance
- −$2,378
- − Repairs & maintenance
- −$1,959
- − Management
- −$1,959
- − Depreciation
- −$5,091
- Taxable loss
- −$911
- Est. tax savings @ 24.0%
- +$219
- After-tax cash flow
- $1,965/yr
For passive investors: Depreciation is non-cash, so a rental often shows a tax loss while cash-flowing — sheltering income. Rental losses are passive: they offset passive income freely, and up to $25,000/yr can offset ordinary (W-2) income if you actively participate and your MAGI is under $100k (phasing out to $0 by $150k); unused losses carry forward. On sale, claimed depreciation is recaptured at up to 25%, and gains may owe capital-gains tax (a 1031 exchange can defer both). Figures are a year-1 estimate at your 24.0% rate — not tax advice; consult a CPA.
Schools (NCES district)
- District
- Ann Arbor Public Schools
- NCES district ID
- 2602820
- Math proficiency
- 71% ▲ 5.00%
- Reading proficiency
- 81% ▲ 11.00%
- Median HH income
- $60,768
- Composite
- 65.34/100
- National rank
- #487
- State rank
- #6 of 540 in MI
Livability — Pittsfield
No livability data for this city. (Only ~50 U.S. cities are tracked.)
Census & demographics
- County
- Washtenaw County · 306,860 people
- Metro
- Ann Arbor, MI
- Population (ZIP)
- 27,666
- Household income
- $89,355
- Rent vs Own
- Severe rent burden
- 1390.0
Population outlook (Washtenaw County) Hauer SSP2
- Today (2025)
- 402,878 people
- By 2030
- 424,104 · +5.3%
- By 2040
- 464,633 · +15.3%
- By 2050
- 504,728 · +25.3%
- By 2075
- 614,463 · +52.5%
- By 2100
- 676,181 · +67.8%
Race, ethnicity, and origin ACS 2023
- Neighborhood character
- Diverse neighborhood (Simpson 0.62)
- Race & ethnicity
- White 58% Black 16% Asian 14% Two or more races 8% Hispanic / Latino 6%
- Hispanic origin (detail)
- Mexican 4%
- Common ancestry
- Romanian 5% Italian 2% Slovak 2%
- Foreign-born
- 23% · China, Canada, South Korea
- Languages at home
- 72% English-only · Arabic 5% Other Indo-European 5% Chinese 5%
Political lean MEDSL · Washtenaw
- 2024 margin
- Solid D (+44.4) · D 71.0% · R 26.6% · Other 2.4%
- 2008→2024 swing
- +3.5pp toward D · 2008: 41.0pp · 2024: 44.4pp
- All cycles
- 2024: D+44.4 2020: D+46.6 2016: D+41.5 2012: D+36.0 2008: D+41.0
Not yet ingested
- Civics
- —
Market trends
- HPI YoY
- ▼ -221.96%
- Current HPI
- 216.8067
- Rent YoY
- ▲ 5.72%
- Metro
- Ann Arbor, MI
- State GDP YoY
- ▲ 1.37%
- F500 in state
- 28
Industry mix (Fortune 500 HQ in MI)
| Industry | F500 HQs | Revenue |
|---|---|---|
| Automotive Parts | 3 | $48B |
|
||
| Automotive | 2 | $372B |
|
||
| Chemicals | 1 | $45B |
|
||
| Automotive Retail | 1 | $29B |
|
||
| Healthcare / Medical Devices | 1 | $23B |
|
||
| Automotive Technology | 1 | $20B |
|
||
Price history
+338.6% since first listed7 events — show timeline
- 2026-06-12 Listed $175,000 MiRealSource-MiMLS
- 2014-12-29 Sold (MLS) $25,000 MiRealSource-MiMLS
- 2014-12-29 Sold (MLS) $25,000 REALCOMP
- 2014-12-22 Listing Removed — REALCOMP
- 2014-12-22 Pending — MiRealSource-MiMLS
- 2014-12-12 Listed $39,900 MiRealSource-MiMLS
- 2014-11-14 Listed $39,900 REALCOMP
Property tax history
+7.8%/yrLatest (2025): $4,206 · +2.8% YoY. Source: county tax records.
Cash-flow waterfall
monthlySold comps — $/sqft
last 12 mo · ≤1 miLoading sold comps…