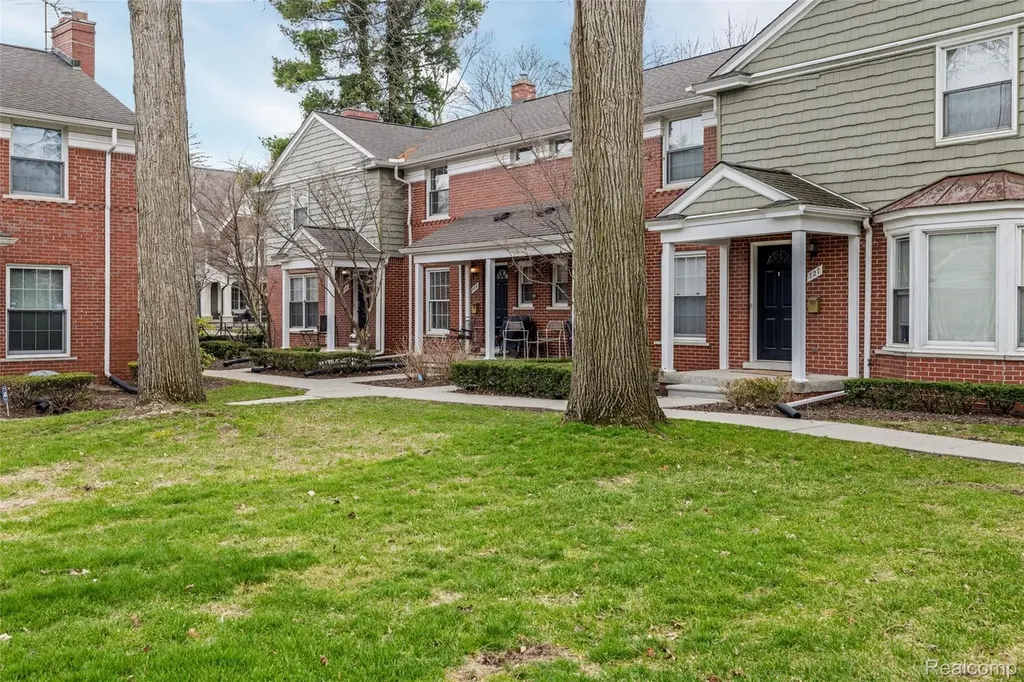
723 N Old Woodward Ave #5 · Birmingham, MI
Flood risk 1/10 · Minimal
- FEMA flood zone
- X (unshaded)
- Chance of flooding over 30 yrs
- 0.0%
- Est. flood insurance / yr
- $473 – $860
Fire risk 1/10 · Minimal
- Est. fire insurance / yr
- $784 – $1,456
Heat risk 3/10 · Minor
- Hot days now (above 97°F)
- 7 days/yr
- Hot days in 30 yrs
- 15 days/yr
Wind risk 2/10 · Minimal
- Chance of severe wind over 30 yrs
- —
Air-quality risk 3/10 · Minor
- Unhealthy air days now
- 2 days/yr
- Unhealthy air days in 30 yrs
- 5 days/yr
Risk factors via First Street. Map © Google.
Why this score? — see what drove the D grade
The composite is a weighted blend of 9 inputs, each scored 0–100. Each bar is that input's sub-score; the figure is the points it added to the 100-point composite (weight × sub-score).
- Cash flow +10.8/30.0
- ARV discount +7.5/15.0
- Schools +6.1/10.0
- 1% rule +5.0/10.0
- Livability +4.4/5.0
- Rent growth +3.4/5.0
- DSCR +3.1/10.0
- Condition / age +2.5/5.0
- Appreciation +0.0/10.0
$374,999
🖨 Deal sheet (PDF) 📄 Offer letter ✓ Due diligence
Listing remarks
Sought after location in Downtown Birmingham. Beautiful move in ready updated condo. Elegant custom updated kitchen with marble countertops, Bosch dishwasher, SubZero refrigerator, Kitchen Aid oven and microwave. Updated full bathroom and updated half bath. Hardwood floors and custom millwork throughout. Large basement with laundry. 2 parking spaces. Parking lot and driveways will be resurfaced soon.
Key facts
- Bosch dishwasher
- Kitchen aid oven
- Marble countertops
Tags
Property features AI
Finance
- Other: Above-grade finished area approximately 1,130 square feet
- HOA & community: Homeowners association with a monthly fee of $517
Exterior
- Parking: Assigned parking in a parking lot; No garage
- Utilities: Public water; Public sewer
- Home design: Condominium; Residential property; Two levels; Ground-level entry with steps
- Construction: Brick, other, and wood siding construction; Asphalt roof
- Exterior features: Paved road access; Pets allowed (with number limit)
Interior
- Kitchen: Dishwasher; Free-standing electric oven; Free-standing refrigerator; Microwave
- Bedrooms: Total rooms: 5
- Bathrooms: 1 full bathroom; 1 half bathroom
- Heating & cooling: Central air conditioning; Forced air heating; Natural gas heating
- Interior features: Gas water heater; Disposal; Unfinished basement
- Laundry & utility: Washer; Dryer
Neighborhood map
What this means for you Summary
Snapshot
- This is a 2-bed/1.5-bath condo listed at $375k.
Deal economics
- At list price, monthly cash flow is $-169 ($-2k/yr) — negative.
- To cash-flow at today's rent, offer at most $345k (8.0% below list).
- To meet the 1% rule (rent ≥ 1% of price), the offer needs to be $374k (0.2% below list).
- Recommended offer: $345k (8.0% below list) — sets the bar for cash-flow.
- Cap rate 5.8% vs local median 1.5% in Birmingham — top-decile yield for the area; either an underpriced asset or a hidden risk that comps aren't pricing in. Stress-test before assuming the spread holds.
Location & tenants
- Location reads 88/100 on livability (#12 in MI, #200 nationally) — a professional / high-income tenant draw. Strengths: schools A+, crime A+, amenities A+; Watch: cost of living F.
- Birmingham Public Schools (suburban): math 58% / reading 71% proficiency, ranked #18 of 540 in MI (top 3%) — acceptable for families but not a draw, mixed tenant base, ~2y average lease; only 6% free/reduced lunch — higher-income household profile.
- Market conditions: Rents rising (+3.8%/yr); 212 active listings in the ZIP; 30 comparable units currently listed for rent nearby; rentals at typical pace (median 26d on market — plan ~3-4 weeks tenant-placement turnaround); high-income renter base; 2,614 units permitted in Oakland County in 2024 (721 in 5+ unit buildings).
Forward outlook
- Local home prices are declining (-3.0%/yr); year-one equity from $3k of loan paydown is wiped out by about $11k of value loss. Plan a longer hold.
- Oakland County population projected at +10% by 2050 — modest demand growth; plan on rents tracking national, not racing it.
Negotiation context
- It's been on market 19 days — a 2% lower offer ($369k) is reasonable based on typical stale-listing flexibility.
- 4 sale attempts; this cycle's ask has dropped $25k (6%) from the opening price — seller is motivated, your offer sets the floor, not the list.
Risks & watch-outs
- Watch-outs: built in 1955 — expect roof / HVAC / electrical / plumbing capex.
Questions for the listing agent
- What do current leases actually rent for vs. the listed asking? Can we see a recent rent roll and the last 12 months of T-12 income?
- Built in 1955 — when were the roof, HVAC, electrical panel, plumbing, and water heater last replaced?
- What does the HOA fee cover, when was the last increase, and are there any pending special assessments or reserve-fund shortfalls?
- Any open or pending special assessments — roof, HVAC, plumbing, elevator, façade? What's the per-unit balance and payoff schedule, and is the seller paying it off at close or rolling it to the buyer?
- Is there a deadline driving the sale (1031 exchange, divorce, estate, relocation)? That informs how much negotiation room exists.
- Schools are A-rated — typically a magnet for longer-tenancy family renters. What's the average tenant stay here, and is there a school-zone premium baked into asking?
- The area grade is low — what's the realistic commute time and amenity access for the typical tenant pool here? Any planned neighborhood developments (good or bad) we should know about?
- What's the average days-on-market for RENTAL listings here right now (not sales)? A rising rental-DOM trend means longer vacancies and softer asking-rent achievability than the comps imply.
- What's the recent tenant-quality profile in this submarket — average credit score on applications, eviction rate, late-payment / NSF rate, and stable-employment percentage? A property-management company in the area should have these aggregated.
- How much new apartment / multifamily construction is in the pipeline within 1–3 miles? Heavy new supply (>2% of stock underway) typically softens rents 12–24 months out; light construction supports rent growth.
Investment metrics
- 1% rule
- 1.00% ✗
- Cap rate
- 5.75%
- Cash-on-cash
- -1.93%
- DSCR
- 0.91
- GRM
- 8.4
CMA / ARV
No comps found within radius.
Projected returns pro-forma
-3.0% appreciation · 3.75% rent growth · sell at horizon
- IRR
- -18.3%
- Equity multiple
- 0.35×
- Total profit
- $-68,308
- Equity at exit
- $55,914
- IRR
- -8.8%
- Equity multiple
- 0.43×
- Total profit
- $-59,939
- Equity at exit
- $32,423
Cash invested: $105,000 (down + closing). Projections, not guarantees.
Landlord ↔ Tenant lean methodology
- Overall (STATE)
- 62 Landlord-Friendly
- State Michigan
- 62 Landlord-Friendly · EVEN
- County
- — inherits STATE
- City
- — inherits STATE
ZIP-level market 48009
- Rents YoY
- 3.8%
- Active inventory
- 212
- Price-to-rent
- 8.4×
Monthly cashflow live
- Estimated rent
- $3,741 high interval (Pro) →
- Mortgage (P&I)
- −$1,967
- Tax from tax record
- −$485 /mo · $5,817/yr
- Insurance
- −$156
- HOA
- −$517
- Vacancy / Maint / Mgmt
- −$786
- Net cashflow
- $-169
Break-even live
Sensitivity live
| Price | -10% $43 | -5% $-63 | +0% $-169 | +5% $-275 | +10% $-381 |
|---|---|---|---|---|---|
| Rent | -10% $-465 | -5% $-317 | +0% $-169 | +5% $-21 | +10% $126 |
| Rate | -1.0pp $20 | -0.5pp $-74 | base $-169 | +0.5pp $-266 | +1.0pp $-365 |
UW: 25.0% down · 7.5% · 30yr · 1.5% tax · 5.0% vac · 8.0% maint · 8.0% mgmt
Financing live
Cash to close
- Down payment
- $93,750
- Closing costs
- $11,250
- Reserves months
- —
- Total cash needed
- —
Loan-product check · same deal, 3 products live
Conventional
25% down · 7.5% · 30yr
- Down + closing
- —
- Monthly P&I
- —
- Monthly cashflow
- —
- DSCR
- —
- Eligible?
- —
Personal DTI + credit; lowest rate.
DSCR
20% down · 8.5% · 30yr
- Down + closing
- —
- Monthly P&I
- —
- Monthly cashflow
- —
- DSCR
- —
- Eligible?
- —
No personal income docs; deal must DSCR.
Hard money
10% down · 12.0% · 12mo
- Down + closing
- —
- Monthly P&I
- —
- Monthly cashflow
- —
- DSCR
- —
- Eligible?
- —
Short-term bridge; refi at stabilization.
Rent comps 30 comps
| Address | Beds | Baths | Sqft | Rent | $/sqft | DOM | Units | Dist |
|---|---|---|---|---|---|---|---|---|
| 633 N Old Woodward Ave Birmingham, MI | 2.0 | 2.5 | 1392 | $4,300 | $3.09 | 26d | 1 | 0.01mi |
| 856 N Old Woodward Ave Unit 208 Birmingham, MI | 2.0 | 2.0 | 1400 | $4,975 | $3.55 | 26d | 1 | 0.07mi |
| 856 N Old Woodward Ave Birmingham, MI | 1.0–3.0 | 1.5–3.0 | 1697 | $6,425 | $3.78 | 26d | 6 | 0.08mi |
| 1113 N Old Woodward Ave #37 Birmingham, MI | 2.0 | 2.0 | 1191 | $2,900 | $2.43 | 26d | 1 | 0.32mi |
| 1115 N Old Woodward Ave #58 Birmingham, MI | 2.0 | 2.0 | 1239 | $2,900 | $2.34 | 0d | 1 | 0.35mi |
| 35300 Woodward Ave #507 Birmingham, MI | 1.0 | 1.0 | 730 | $2,000 | $2.74 | 26d | 1 | 0.36mi |
| 202 N Old Woodward Ave Unit 202 Birmingham, MI | 2.0 | 2.0 | 1475 | $5,900 | $4.00 | 26d | 1 | 0.39mi |
| 211 E Merrill St Birmingham, MI | 1.0–3.0 | 1.0–2.0 | 1059 | $4,078 | $3.85 | 0d | 7 | 0.51mi |
| 411 S Old Woodward Ave Birmingham, MI | 1.0–2.0 | 1.0–2.0 | 743 | $3,850 | $5.18 | 5d | 6 | 0.67mi |
| 343 S Elm St Unit A Birmingham, MI | 2.0 | 1.5 | 1100 | $3,000 | $2.73 | 18d | 1 | 0.71mi |
| 1109 Derby Rd Birmingham, MI | 1.0 | 1.0 | 780 | $1,400 | $1.79 | 16d | 1 | 0.74mi |
| 771 Henrietta St Unit 773 Birmingham, MI | 1.0 | 1.0 | 1054 | $1,925 | $1.83 | 26d | 1 | 0.76mi |
| 1245 Derby Rd #4 Birmingham, MI | 2.0 | 1.5 | 1400 | $1,500 | $1.07 | 26d | 1 | 0.77mi |
| 555 S Old Woodward Ave Birmingham, MI | 1.0–2.0 | 1.0–2.0 | 1036 | $4,161 | $4.02 | 0d | 4 | 0.77mi |
| 650 Ann St Birmingham, MI | 1.0 | 1.0 | 700 | $1,462 | $2.09 | 26d | 1 | 0.77mi |
| 707 S Worth St Birmingham, MI | 1.0–2.0 | 1.0–2.0 | 1290 | $6,900 | $5.35 | 0d | 21 | 0.95mi |
| 1802 E Maple Rd Birmingham, MI | 1.0–2.0 | 1.0 | 775 | $1,565 | $2.02 | 16d | 3 | 1.15mi |
| 991 Humphrey Ave Birmingham, MI | 3.0 | 1.0 | 1115 | $2,200 | $1.97 | 0d | 1 | 1.17mi |
| 1188 Ruffner Ave Birmingham, MI | 2.0 | 1.0 | 849 | $2,300 | $2.71 | 6d | 1 | 1.22mi |
| 1997 Villa Rd Birmingham, MI | 1.0–3.0 | 1.0–2.5 | 1050 | $1,975 | $1.88 | 1d | 10 | 1.24mi |
| 755 Emmons Ave Birmingham, MI | 3.0 | 1.0 | 1160 | $1,900 | $1.64 | 26d | 1 | 1.28mi |
| 2101 E Maple Rd Birmingham, MI | 2.0 | 1.0 | 1000 | $1,695 | $1.70 | 16d | 1 | 1.28mi |
| 2233 E Maple Rd Unit A104 Birmingham, MI | 1.0 | 1.0 | 725 | $1,300 | $1.79 | 26d | 1 | 1.34mi |
| 2233 E Maple Rd Unit D104 Birmingham, MI | 1.0 | 1.0 | 725 | $1,275 | $1.76 | 26d | 1 | 1.34mi |
| 2233 E Maple Rd Unit B301 Birmingham, MI | 1.0 | 1.0 | 725 | $1,395 | $1.92 | 26d | 1 | 1.34mi |
| 487 Smith Ave Birmingham, MI | 3.0 | 2.0 | 1326 | $3,950 | $2.98 | 6d | 1 | 1.34mi |
| 1948 Henrietta St Birmingham, MI | 3.0 | 1.0 | 1057 | $2,500 | $2.37 | 26d | 1 | 1.38mi |
| 2453 Windemere Rd Birmingham, MI | 3.0 | 2.5 | 1486 | $3,200 | $2.15 | 0d | 1 | 1.42mi |
| 2457 E Maple Rd Birmingham, MI | 1.0–2.0 | 1.0 | 760 | $1,525 | $2.01 | 26d | 1 | 1.44mi |
| 16244 Kirkshire Ave Beverly Hills, MI | 3.0 | 2.0 | 1331 | $3,500 | $2.63 | 0d | 1 | 1.49mi |
HOA detail condo
- Monthly dues
- $517 · $6,204/yr
- Assessments
- None detected in remarks — confirm with the listing agent.
Listing history 19 events
-
2026-06-21days on market $374,999 Active 19 DOM
-
2026-06-18days on market $374,999 Active 16 DOM
-
2026-06-17days on market $374,999 Active 15 DOM
-
2026-06-16days on market $374,999 Active 14 DOM
-
2026-06-15days on market $374,999 Active 13 DOM
-
2026-06-13days on market $374,999 Active 11 DOM
-
2026-06-09days on market $374,999 Active 7 DOM
-
2026-06-08days on market $374,999 Active 6 DOM
-
2026-06-07days on market $374,999 Active 5 DOM
-
2026-06-04days on market $374,999 Active 2 DOM
-
2026-06-02pricedays on market $374,999 Active 1 DOM
-
2026-06-01days on market $399,900 Active 34 DOM
-
2026-05-31days on market $399,900 Active 33 DOM
-
2026-04-28historical
-
2026-04-28historical
-
2026-04-28$399,900 Active
-
2026-04-28$399,900 Active
-
2026-04-14$410,000 Active
-
2026-04-14$410,000 Active
ⓘ Source: listings_history table (triggers on properties + properties_extension) + one-shot
backfill from property_details.listing_events for pre-trigger history.
Tax reassessment forecast MI · Partial reset (capped growth)
- Current annual tax
- $5,817 · $485/mo
- Projected year-2 tax
- $5,817 · $485/mo
- Expected delta
- $0/yr ($0/mo · 0.0%)
ⓘ Screening estimate from a state-policy table — verify with the county assessor before closing.
Climate risk First Street
- Flood 1/10 Low FEMA zone X (unshaded) · 0% chance over 30 yrs
- Wildfire 1/10 Low
- Heat 3/10 Moderate 7 d/yr ≥97°F today · 15 d/yr by 30 yrs out
- Wind 2/10 Low
- Air quality 3/10 Moderate 2 unhealthy d/yr today · 5 by 30 yrs out
Nearby sold comps map
Loading sold comps map…
Walkable amenities ~0.75 mi
Loading nearby amenities…
Taxation est. · year 1
- Rental income
- $44,893
- − Mortgage interest
- −$21,006
- − Property taxes
- −$5,817
- − Insurance
- −$1,875
- − Repairs & maintenance
- −$3,591
- − Management
- −$3,591
- − HOA
- −$6,204
- − Depreciation
- −$10,909
- Taxable loss
- −$8,101
- Est. tax savings @ 24.0%
- +$1,944
- After-tax cash flow
- $-85/yr
For passive investors: Depreciation is non-cash, so a rental often shows a tax loss while cash-flowing — sheltering income. Rental losses are passive: they offset passive income freely, and up to $25,000/yr can offset ordinary (W-2) income if you actively participate and your MAGI is under $100k (phasing out to $0 by $150k); unused losses carry forward. On sale, claimed depreciation is recaptured at up to 25%, and gains may owe capital-gains tax (a 1031 exchange can defer both). Figures are a year-1 estimate at your 24.0% rate — not tax advice; consult a CPA.
Schools (NCES district)
- District
- Birmingham Public Schools
- NCES district ID
- 2605850
- Math proficiency
- 58% ▼ -8.00%
- Reading proficiency
- 71% ▼ -3.00%
- Median HH income
- $110,445
- Composite
- 60.54/100
- National rank
- #839
- State rank
- #18 of 540 in MI
Livability — Birmingham
- Score
- 88/100
- State rank
- #12
- US rank
- #200
Category grades
Schools grade is shown separately in the Schools card above.
Census & demographics
- Census place
- Birmingham, MI
- County
- Oakland County · 1,009,092 people
- City population
- 21,772
- Metro
- Detroit-Warren-Dearborn, MI
- Population (ZIP)
- 21,772
- Household income
- $153,401
- Rent vs Own
- Severe rent burden
- 476.0
Population outlook (Oakland County) Hauer SSP2
- Today (2025)
- 1,335,747 people
- By 2030
- 1,375,100 · +2.9%
- By 2040
- 1,435,385 · +7.5%
- By 2050
- 1,469,250 · +10.0%
- By 2075
- 1,531,946 · +14.7%
- By 2100
- 1,450,485 · +8.6%
Race, ethnicity, and origin ACS 2023
- Neighborhood character
- Predominantly White (84%)
- Race & ethnicity
- White 84% Two or more races 6% Asian 5% Hispanic / Latino 4% Black 4%
- Common ancestry
- Romanian 8% Lithuanian 3% Scotch-Irish 3%
- Foreign-born
- 10% · Canada, South Korea
- Languages at home
- 90% English-only · Other Indo-European 3% Arabic 1% Spanish 1%
Political lean MEDSL · Oakland
- 2024 margin
- D (+10.6) · D 54.4% · R 43.8% · Other 1.9%
- 2008→2024 swing
- -3.9pp toward R · 2008: 14.5pp · 2024: 10.6pp
- All cycles
- 2024: D+10.6 2020: D+14.1 2016: D+8.1 2012: D+8.1 2008: D+14.5
Not yet ingested
- Civics
- —
Market trends
- HPI YoY
- ▼ -644.58%
- Current HPI
- 201.3418
- Rent YoY
- ▲ 3.75%
- Metro
- Detroit-Warren-Dearborn, MI
- State GDP YoY
- ▲ 1.37%
- F500 in state
- 28
Industry mix (Fortune 500 HQ in MI)
| Industry | F500 HQs | Revenue |
|---|---|---|
| Automotive Parts | 3 | $48B |
|
||
| Automotive | 2 | $372B |
|
||
| Chemicals | 1 | $45B |
|
||
| Automotive Retail | 1 | $29B |
|
||
| Healthcare / Medical Devices | 1 | $23B |
|
||
| Automotive Technology | 1 | $20B |
|
||
Price history
-2.5% since first listed6 events — show timeline
- 2026-04-28 Listed $399,900 MiRealSource-MiMLS
- 2026-04-28 Listed $399,900 REALCOMP
- 2026-04-28 Listing Removed — MiRealSource-MiMLS
- 2026-04-28 Listing Removed — REALCOMP
- 2026-04-14 Listed $410,000 MiRealSource-MiMLS
- 2026-04-14 Listed $410,000 REALCOMP
Property tax history
+0.2%/yrLatest (2025): $5,817 · +1.9% YoY. Source: county tax records.
Cash-flow waterfall
monthlySold comps — $/sqft
last 12 mo · ≤1 miLoading sold comps…