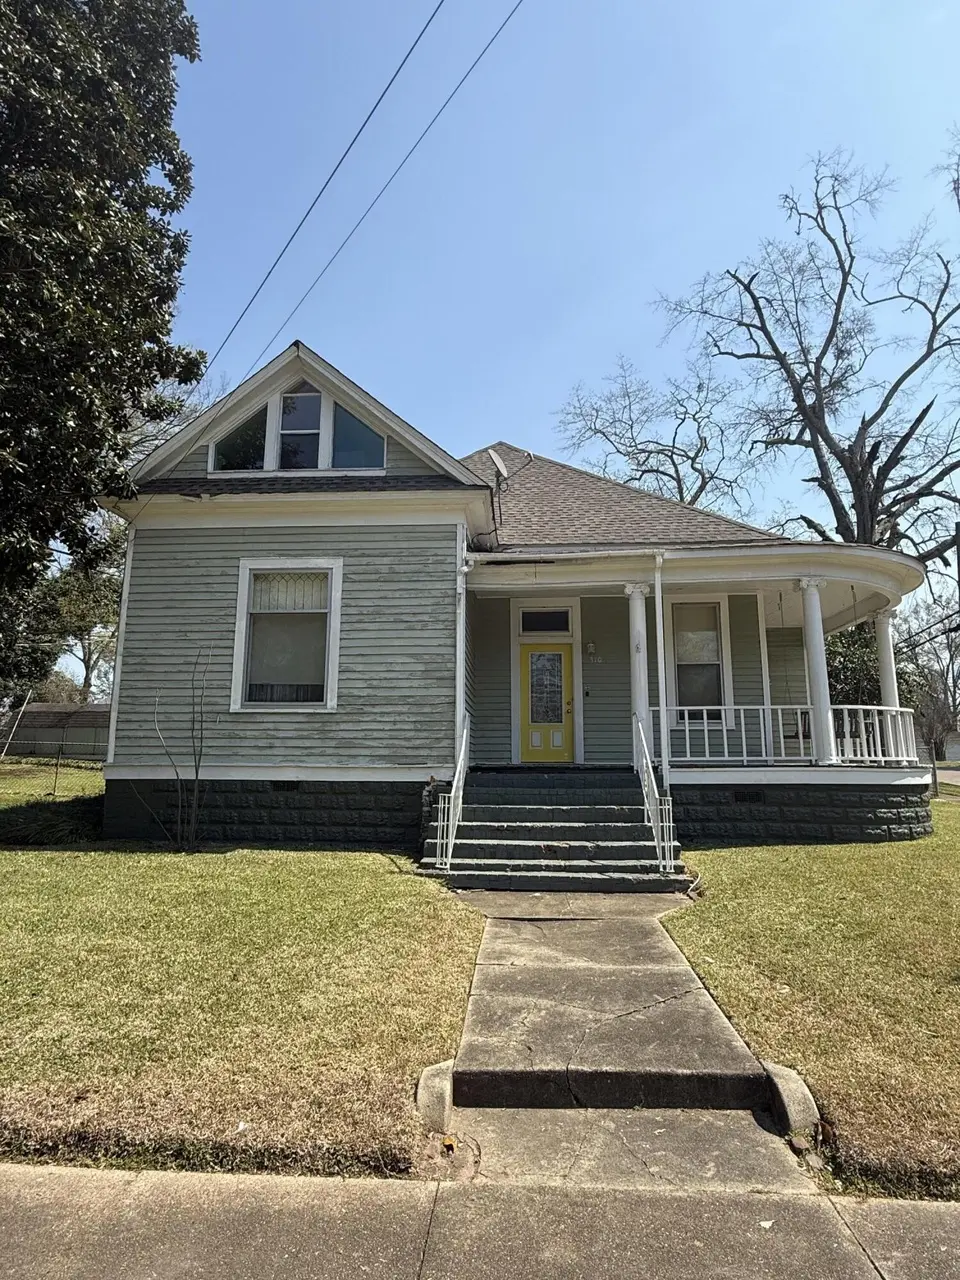
310 S Maple St · Aberdeen, MS
Flood risk 1/10 · Minimal
- FEMA flood zone
- X (unshaded)
- Chance of flooding over 30 yrs
- 0.0%
- Est. flood insurance / yr
- $507 – $1,088
Fire risk 3/10 · Minor
- Est. fire insurance / yr
- $1,241 – $2,305
Heat risk 7/10 · Major
- Hot days now (above 110°F)
- 7 days/yr
- Hot days in 30 yrs
- 21 days/yr
Wind risk 6/10 · Moderate
- Chance of severe wind over 30 yrs
- 27.0%
Air-quality risk 1/10 · Minimal
- Unhealthy air days now
- 0 days/yr
- Unhealthy air days in 30 yrs
- 0 days/yr
Risk factors via First Street. Map © Google.
Why this score? — see what drove the C- grade
The composite is a weighted blend of 9 inputs, each scored 0–100. Each bar is that input's sub-score; the figure is the points it added to the 100-point composite (weight × sub-score).
- Cash flow +24.5/30.0
- DSCR +7.9/10.0
- 1% rule +6.1/10.0
- Livability +3.2/5.0
- ARV discount +2.8/15.0
- Rent growth +2.5/5.0
- Condition / age +2.5/5.0
- Schools +1.4/10.0
- Appreciation +0.0/10.0
$89,000
🖨 Deal sheet 📄 Offer letter ✓ Due diligence
Listing remarks MLS
Circa 1895, 3BR/2BA home. Home features lovely wood floors, original fireplace, beautiful mantels, all with the character that you would expect from this Era. Roof and HVAC less than 5 years old.
Key facts
- 8,712 sq ft lot
- Built 1895
- Listed 83 days
Neighborhood map
What this means for you Summary
Snapshot
- This is a 3-bed/1.0-bath single-family listed at $89k.
Deal economics
- At list price, monthly cash flow is $183 ($2k/yr) — positive.
- The deal already cash-flows at list — no discount required.
- Meets the 1% rule at list price ($991 rent vs $89k).
- Recommended offer: $84k (6.0% below list) — sets the bar for market timing.
Location & tenants
- Location reads 63/100 on livability (#164 in MS) — a middle-class / working-renter tenant base. Strengths: cost of living A+, housing A+, crime A-; Watch: schools D-, amenities F, commute F.
- Aberdeen School District (town): math 15% / reading 19% proficiency, ranked #99 of 130 in MS (top 76%) — low school quality limits family demand, transient renter base, plan for 1-2y turnover; 93% free/reduced lunch — lower-income household profile, screen leases tightly.
- Market conditions: 47 active listings in the ZIP; 18 units permitted in Monroe County in 2024 (0 in 5+ unit buildings).
Forward outlook
- Local home prices are declining (-3.0%/yr); year-one equity from $615 of loan paydown is wiped out by about $3k of value loss. Plan a longer hold.
- Monroe County population projected at -21% by 2050 — secular population decline; favor cash flow + early exit over multi-decade hold.
Negotiation context
- It's been on market 84 days — a 6% lower offer ($84k) is reasonable based on typical stale-listing flexibility.
- Current owner paid $70k; 27% above their basis — modest negotiation headroom, anchor on the comps not their cost.
Risks & watch-outs
- Watch-outs: built in 1895 — expect roof / HVAC / electrical / plumbing capex.
- Climate carrying-cost: major wind risk, 27% chance of damaging wind over 30y; extreme-heat days projected 7→21/yr by 2055 (HVAC capex compounding) — expect insurance premiums to compound above CPI over the hold.
Questions for the listing agent
- It's been on market 84 days. Have you received any prior offers? Is the seller open to a 6% concession, seller financing, or rate buy-down credit?
- Built in 1895 — when were the roof, HVAC, electrical panel, plumbing, and water heater last replaced?
- Why hasn't it sold? Are there any deal-killer items the seller is aware of (foundation, flood, title, zoning, code violations)?
- Is there a deadline driving the sale (1031 exchange, divorce, estate, relocation)? That informs how much negotiation room exists.
- Schools are D-rated, which usually means shorter tenancies and higher turnover. Who's the typical renter profile here, and what's been the actual vacancy rate?
- What's the average days-on-market for RENTAL listings here right now (not sales)? A rising rental-DOM trend means longer vacancies and softer asking-rent achievability than the comps imply.
- What's the recent tenant-quality profile in this submarket — average credit score on applications, eviction rate, late-payment / NSF rate, and stable-employment percentage? A property-management company in the area should have these aggregated.
- How much new for-sale + rental construction is in the pipeline within 1–3 miles? Heavy new supply typically softens prices + rents 12–24 months out; constrained supply supports both.
Investment metrics
- 1% rule
- 1.11% ✓
- Cap rate
- 8.76%
- Cash-on-cash
- 8.81%
- DSCR
- 1.39
- GRM
- 7.5
CMA / ARV
- ARV (median comp)
- $80,602
- List price
- $89,000
- Delta
- 10.42%
- Verdict
- OVERPRICED
- Comps
- 6 within 1.0 mi
Projected returns pro-forma
-3.0% appreciation · 3.0% rent growth · sell at horizon
- IRR
- -2.9%
- Equity multiple
- 0.89×
- Total profit
- $-2,757
- Equity at exit
- $13,270
- IRR
- 6.8%
- Equity multiple
- 1.51×
- Total profit
- $12,636
- Equity at exit
- $7,695
Cash invested: $24,920 (down + closing). Projections, not guarantees.
Landlord ↔ Tenant lean methodology
- Overall (STATE)
- 90 Strongly Landlord-Friendly
- State Mississippi
- 90 Strongly Landlord-Friendly · R+11
- County
- — inherits STATE
- City
- — inherits STATE
ZIP-level market 39730
- Home prices YoY
- -12.2%
- Active inventory
- 47
- Price-to-rent
- 7.5×
Monthly cashflow live
- Estimated rent
- $991 medium interval (Pro) →
- Mortgage (P&I)
- −$467
- Tax from tax record
- −$96 /mo · $1,157/yr
- Insurance
- −$37
- HOA
- −$0
- Vacancy / Maint / Mgmt
- −$208
- Net cashflow
- $183
Break-even live
UW: 25.0% down · 7.5% · 30yr · 1.5% tax · 5.0% vac · 8.0% maint · 8.0% mgmt
Financing live
Cash to close
- Down payment
- $22,250
- Closing costs
- $2,670
- Reserves months
- —
- Total cash needed
- —
Loan-product check · same deal, 3 products live
Conventional
25% down · 7.5% · 30yr
- Down + closing
- —
- Monthly P&I
- —
- Monthly cashflow
- —
- DSCR
- —
- Eligible?
- —
Personal DTI + credit; lowest rate.
DSCR
20% down · 8.5% · 30yr
- Down + closing
- —
- Monthly P&I
- —
- Monthly cashflow
- —
- DSCR
- —
- Eligible?
- —
No personal income docs; deal must DSCR.
Hard money
10% down · 12.0% · 12mo
- Down + closing
- —
- Monthly P&I
- —
- Monthly cashflow
- —
- DSCR
- —
- Eligible?
- —
Short-term bridge; refi at stabilization.
Listing history 19 events
-
2026-06-18days on market $89,000 Active 84 DOM
-
2026-06-17days on market $89,000 Active 83 DOM
-
2026-06-16days on market $89,000 Active 82 DOM
-
2026-06-15days on market $89,000 Active 81 DOM
-
2026-06-13days on market $89,000 Active 79 DOM
-
2026-06-12days on market $89,000 Active 78 DOM
-
2026-06-09days on market $89,000 Active 75 DOM
-
2026-06-08days on market $89,000 Active 74 DOM
-
2026-06-07days on market $89,000 Active 73 DOM
-
2026-06-07days on market $89,000 Active 72 DOM
-
2026-06-04days on market $89,000 Active 69 DOM
-
2026-06-02days on market $89,000 Active 68 DOM
-
2026-06-01days on market $89,000 Active 67 DOM
-
2026-05-31days on market $89,000 Active 66 DOM
-
2026-05-07price $89,000 196-char remark
Show marketing remark (196 chars)
Circa 1895, 3BR/2BA home. Home features lovely wood floors, original fireplace, beautiful mantels, all with the character that you would expect from this Era. Roof and HVAC less than 5 years old.
-
2026-03-26$99,000 Active 196-char remark
Show marketing remark (196 chars)
Circa 1895, 3BR/2BA home. Home features lovely wood floors, original fireplace, beautiful mantels, all with the character that you would expect from this Era. Roof and HVAC less than 5 years old.
-
2023-03-21soldstatus $70,069
-
2020-12-17soldstatus $70,069
-
2004-08-31soldstatus
ⓘ Source: listings_history table (triggers on properties + properties_extension) + one-shot
backfill from property_details.listing_events for pre-trigger history.
Tax reassessment forecast MS · Resets to sale price
- Current annual tax
- $1,157 · $96/mo
- Projected year-2 tax
- $1,157 · $96/mo
- Expected delta
- $0/yr ($0/mo · 0.0%)
ⓘ Screening estimate from a state-policy table — verify with the county assessor before closing.
Climate risk First Street
- Flood 1/10 Low FEMA zone X (unshaded) · 0% chance over 30 yrs
- Wildfire 3/10 Moderate
- Heat 7/10 Severe 7 d/yr ≥110°F today · 21 d/yr by 30 yrs out
- Wind 6/10 Major 27% chance of damaging wind over 30 yrs
- Air quality 1/10 Low 0 unhealthy d/yr today · 0 by 30 yrs out
Nearby sold comps map
Loading sold comps map…
Walkable amenities ~0.75 mi
Loading nearby amenities…
Taxation est. · year 1
- Rental income
- $11,898
- − Mortgage interest
- −$4,985
- − Property taxes
- −$1,157
- − Insurance
- −$445
- − Repairs & maintenance
- −$952
- − Management
- −$952
- − Depreciation
- −$2,589
- Taxable income
- $818
- Est. tax owed @ 24.0%
- −$196
- After-tax cash flow
- $2,000/yr
For passive investors: Depreciation is non-cash, so a rental often shows a tax loss while cash-flowing — sheltering income. Rental losses are passive: they offset passive income freely, and up to $25,000/yr can offset ordinary (W-2) income if you actively participate and your MAGI is under $100k (phasing out to $0 by $150k); unused losses carry forward. On sale, claimed depreciation is recaptured at up to 25%, and gains may owe capital-gains tax (a 1031 exchange can defer both). Figures are a year-1 estimate at your 24.0% rate — not tax advice; consult a CPA.
Schools (NCES district)
- District
- Aberdeen School District
- NCES district ID
- 2800360
- Math proficiency
- 15% ▼ -18.00%
- Reading proficiency
- 19% ▼ -9.00%
- Median HH income
- $30,551
- Composite
- 13.56/100
- National rank
- #9513
- State rank
- #99 of 130 in MS
Livability — Aberdeen
- Score
- 63/100
- State rank
- #164
- US rank
- #15742
Category grades
Schools grade is shown separately in the Schools card above.
Census & demographics
- Census place
- Aberdeen, MS
- City population
- 11,496
- Population (ZIP)
- 11,496
Population outlook (Monroe County) Hauer SSP2
- Today (2025)
- 33,903 people
- By 2030
- 32,612 · -3.8%
- By 2040
- 29,761 · -12.2%
- By 2050
- 26,788 · -21.0%
- By 2075
- 20,058 · -40.8%
- By 2100
- 14,566 · -57.0%
Race, ethnicity, and origin ACS 2023
- Neighborhood character
- Majority Black (50%)
- Race & ethnicity
- Black 50% White 49%
- Common ancestry
- Slovak 1% Serbian 1%
- Foreign-born
- 0% · Canada
Political lean MEDSL · Monroe
- 2024 margin
- Solid R (+35.9) · D 31.7% · R 67.6%
- 2008→2024 swing
- -18.7pp toward R · 2008: -17.2pp · 2024: -35.9pp
- All cycles
- 2024: R+35.9 2020: R+30.7 2016: R+29.3 2012: R+15.9 2008: R+17.2
Not yet ingested
- Civics
- —
Market trends
- HPI YoY
- ▼ -19.15%
- Current HPI
- 137.8358
- Rent YoY
- —
- Metro
- —
- State GDP YoY
- —
- F500 in state
- 0
Price history
+27.0% since first listed5 events — show timeline
- 2026-05-07 Price Changed $89,000 NEMSBD
- 2026-03-26 Listed $99,000 NEMSBD
- 2023-03-21 Sold (Public Records) $70,069 Public Records
- 2020-12-17 Sold (Public Records) $70,069 Public Records
- 2004-08-31 Sold (Public Records) — Public Records
Property tax history
+12.0%/yrLatest (2020): $1,157 · +1.1% YoY. Source: county tax records.
Cash-flow waterfall
monthlySold comps — $/sqft
last 12 mo · ≤1 miLoading sold comps…