 🏷️ Likely Rental
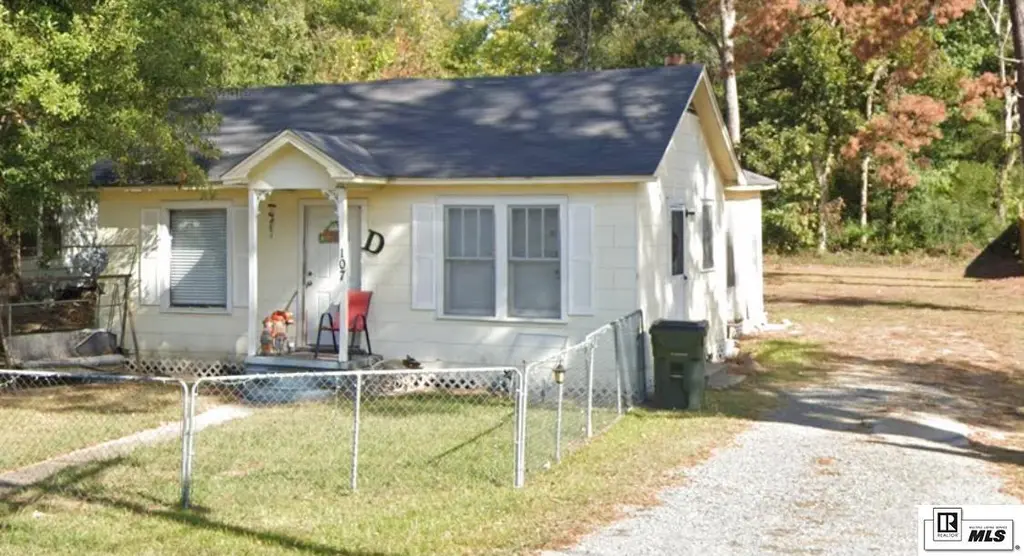
107 Bancroft Blvd · West Monroe, LA
Flood risk 1/10 · Minimal
- FEMA flood zone
- X
- Chance of flooding over 30 yrs
- 0.0%
- Est. flood insurance / yr
- $507 – $1,088
Fire risk 1/10 · Minimal
- Est. fire insurance / yr
- $1,269 – $2,357
Heat risk 7/10 · Major
- Hot days now (above 112°F)
- 7 days/yr
- Hot days in 30 yrs
- 20 days/yr
Wind risk 7/10 · Major
- Chance of severe wind over 30 yrs
- 76.0%
Air-quality risk 1/10 · Minimal
- Unhealthy air days now
- 0 days/yr
- Unhealthy air days in 30 yrs
- 0 days/yr
Risk factors via First Street. Map © Google.
Why this score? — see what drove the B+ grade
The composite is a weighted blend of 9 inputs, each scored 0–100. Each bar is that input's sub-score; the figure is the points it added to the 100-point composite (weight × sub-score).
- Cash flow +30.0/30.0
- ARV discount +15.0/15.0
- 1% rule +10.0/10.0
- DSCR +10.0/10.0
- Livability +3.5/5.0
- Schools +3.2/10.0
- Rent growth +2.5/5.0
- Condition / age +2.5/5.0
- Appreciation +0.0/10.0
$65,000
🖨 Deal sheet 📄 Offer letter ✓ Due diligence
Listing remarks
Great investment opportunity in West Monroe! This 3 bedroom, 1 bathroom home offers approximately 1,200 heated square feet and is currently occupied by a long-term Section 8 tenant who has lived at the property for 10+ years, providing stable rental income for an investor. The home features central air and heat, updated flooring, repaired floor joists, and a functional floor plan. Conveniently located near the interstate, shopping, restaurants, and other local amenities. Excellent opportunity for an investor looking for a steady income-producing property with established rental history. Shown by appointment only. Please do not disturb tenant.
Key facts
- Central air and heat
- Updated flooring
- Conveniently located
Tags
Property features AI
Exterior
- Parking: Open parking
- Utilities: Public water; Public sewer; Natural gas not available
- Home design: Single-family residence; Residential income property
- Construction: Frame construction; Asphalt roof; Crawl space foundation; Built area approximately 1200
- Exterior features: Covered patio/porch; Gravel parking area
Interior
- Kitchen: No built-in kitchen appliances listed
- Heating & cooling: Central heating; Central air conditioning; Ceiling fans for cooling
- Interior features: Ceiling fans
- Laundry & utility: No laundry hookups or appliances listed; Gas water heater
Neighborhood map
What this means for you Summary
Snapshot
- This is a 3-bed/1.0-bath single-family listed at $65k.
Deal economics
- At list price, monthly cash flow is $582 ($7k/yr) — positive.
- The deal already cash-flows at list — no discount required.
- Meets the 1% rule at list price ($1k rent vs $65k).
- Recommended offer: $63k (3.0% below list) — sets the bar for market timing.
- Cap rate 17.0% vs local median 5.5% in West Monroe — top-decile yield for the area; either an underpriced asset or a hidden risk that comps aren't pricing in. Stress-test before assuming the spread holds.
Location & tenants
- Location reads 70/100 on livability (#53 in LA) — a middle-class / working-renter tenant base. Strengths: cost of living A+, health & safety A+, housing A; Watch: crime F, commute F, employment F.
- Ouachita Parish (suburban): math 31% / reading 45% proficiency, ranked #26 of 98 in LA (top 26%) — families likely to look elsewhere, expect single-tenant / working-renter base with shorter leases.
- Market conditions: 195 active listings in the ZIP; 6 comparable units currently listed for rent nearby; rentals at typical pace (median 21d on market — plan ~3-4 weeks tenant-placement turnaround); 345 units permitted in Ouachita Parish in 2024 (0 in 5+ unit buildings).
- This rent runs 31% of the median local income ($51k/yr) — at the standard rent-burdened threshold; future hikes will face affordability resistance.
Forward outlook
- Local home prices are declining (-3.0%/yr); year-one equity from $449 of loan paydown is wiped out by about $2k of value loss. Plan a longer hold.
- At projected returns (-3.0% appreciation + 3.0% rent growth), your $18k cash investment doubles in ~4 years — after that, you're playing with house money.
Negotiation context
- It's been on market 38 days — a 3% lower offer ($63k) is reasonable based on typical stale-listing flexibility.
- 2 sale attempts with the ask held roughly flat each time — persistent listings suggest the price (not the market) is what's stuck; bring a comps-based counter.
Risks & watch-outs
- Watch-outs: built in 1952 — expect roof / HVAC / electrical / plumbing capex.
- Climate carrying-cost: major wind risk, 76% chance of damaging wind over 30y; extreme-heat days projected 7→20/yr by 2055 (HVAC capex compounding) — expect insurance premiums to compound above CPI over the hold.
Questions for the listing agent
- It's been on market 38 days. Have you received any prior offers? Is the seller open to a 3% concession, seller financing, or rate buy-down credit?
- Built in 1952 — when were the roof, HVAC, electrical panel, plumbing, and water heater last replaced?
- Is there a deadline driving the sale (1031 exchange, divorce, estate, relocation)? That informs how much negotiation room exists.
- Schools are B-rated — typically a magnet for longer-tenancy family renters. What's the average tenant stay here, and is there a school-zone premium baked into asking?
- Crime grade is F in this area — have there been break-ins, vandalism, or insurance claims at this property in the last 3 years? What carrier currently insures it and at what premium?
- What's the average days-on-market for RENTAL listings here right now (not sales)? A rising rental-DOM trend means longer vacancies and softer asking-rent achievability than the comps imply.
- What's the recent tenant-quality profile in this submarket — average credit score on applications, eviction rate, late-payment / NSF rate, and stable-employment percentage? A property-management company in the area should have these aggregated.
- How much new for-sale + rental construction is in the pipeline within 1–3 miles? Heavy new supply typically softens prices + rents 12–24 months out; constrained supply supports both.
Investment metrics
- 1% rule
- 2.01% ✓
- Cap rate
- 17.04%
- Cash-on-cash
- 38.38%
- DSCR
- 2.71
- GRM
- 4.1
CMA / ARV
- ARV (median comp)
- $127,720
- List price
- $65,000
- Delta
- -49.11%
- Verdict
- UNDERPRICED
- Comps
- 4 within 1.0 mi
Projected returns pro-forma
-3.0% appreciation · 3.0% rent growth · sell at horizon
- IRR
- 34.5%
- Equity multiple
- 2.46×
- Total profit
- $26,566
- Equity at exit
- $9,692
- IRR
- 41.4%
- Equity multiple
- 4.90×
- Total profit
- $70,957
- Equity at exit
- $5,620
Cash invested: $18,200 (down + closing). Projections, not guarantees.
Landlord ↔ Tenant lean methodology
- Overall (STATE)
- 90 Strongly Landlord-Friendly
- State Louisiana
- 90 Strongly Landlord-Friendly · R+12
- County
- — inherits STATE
- City
- — inherits STATE
ZIP-level market 71292
- Home prices YoY
- -22.1%
- Active inventory
- 195
- Price-to-rent
- 4.1×
Monthly cashflow live
- Estimated rent
- $1,306 high interval (Pro) →
- Mortgage (P&I)
- −$341
- Tax est. 1.5%
- −$81 /mo · $975/yr
- Insurance
- −$27
- HOA
- −$0
- Vacancy / Maint / Mgmt
- −$274
- Net cashflow
- $582
Break-even live
UW: 25.0% down · 7.5% · 30yr · 1.5% tax · 5.0% vac · 8.0% maint · 8.0% mgmt
Financing live
Cash to close
- Down payment
- $16,250
- Closing costs
- $1,950
- Reserves months
- —
- Total cash needed
- —
Loan-product check · same deal, 3 products live
Conventional
25% down · 7.5% · 30yr
- Down + closing
- —
- Monthly P&I
- —
- Monthly cashflow
- —
- DSCR
- —
- Eligible?
- —
Personal DTI + credit; lowest rate.
DSCR
20% down · 8.5% · 30yr
- Down + closing
- —
- Monthly P&I
- —
- Monthly cashflow
- —
- DSCR
- —
- Eligible?
- —
No personal income docs; deal must DSCR.
Hard money
10% down · 12.0% · 12mo
- Down + closing
- —
- Monthly P&I
- —
- Monthly cashflow
- —
- DSCR
- —
- Eligible?
- —
Short-term bridge; refi at stabilization.
Rent comps 6 comps
| Address | Beds | Baths | Sqft | Rent | $/sqft | DOM | Units | Dist |
|---|---|---|---|---|---|---|---|---|
| 118 Bancroft Blvd West Monroe, LA | 3.0 | 2.0 | 1300 | $1,525 | $1.17 | 21d | 1 | 0.03mi |
| 411 Filhiol Ave West Monroe, LA | 2.0 | 1.0 | 782 | $875 | $1.12 | 21d | 1 | 1.19mi |
| 220 Drew Ave West Monroe, LA | 3.0 | 1.0 | 900 | $1,525 | $1.69 | 21d | 1 | 1.39mi |
| 110 Pine St Unit 12 West Monroe, LA | 2.0 | 2.0 | 1000 | $2,400 | $2.40 | 43d | 1 | 1.46mi |
| 808 Kyle St West Monroe, LA | 3.0 | 1.0 | 1008 | $950 | $0.94 | 21d | 1 | 1.47mi |
| 107 Riverbend Dr West Monroe, LA | 2.0 | 1.0 | 896 | $800 | $0.89 | 21d | 1 | 1.49mi |
Listing history 18 events
-
2026-06-19days on market $65,000 Active 38 DOM
-
2026-06-18days on market $65,000 Active 37 DOM
-
2026-06-17days on market $65,000 Active 36 DOM
-
2026-06-16days on market $65,000 Active 35 DOM
-
2026-06-15days on market $65,000 Active 34 DOM
-
2026-06-14days on market $65,000 Active 32 DOM
-
2026-06-13days on market $65,000 Active 31 DOM
-
2026-06-10days on market $65,000 Active 29 DOM
-
2026-06-09days on market $65,000 Active 28 DOM
-
2026-06-08days on market $65,000 Active 27 DOM
-
2026-06-07days on market $65,000 Active 26 DOM
-
2026-06-03days on market $65,000 Active 22 DOM
-
2026-06-02days on market $65,000 Active 21 DOM
-
2026-06-01days on market $65,000 Active 20 DOM
-
2026-05-31days on market $65,000 Active 19 DOM
-
2026-05-30days on market $65,000 Active 18 DOM
-
2026-05-12$65,000 Active 650-char remark
-
2025-02-26$65,000 Active
ⓘ Source: listings_history table (triggers on properties + properties_extension) + one-shot
backfill from property_details.listing_events for pre-trigger history.
Climate risk First Street
- Flood 1/10 Low FEMA zone X · 0% chance over 30 yrs
- Wildfire 1/10 Low
- Heat 7/10 Severe 7 d/yr ≥112°F today · 20 d/yr by 30 yrs out
- Wind 7/10 Severe 76% chance of damaging wind over 30 yrs
- Air quality 1/10 Low 0 unhealthy d/yr today · 0 by 30 yrs out
Nearby sold comps map
Loading sold comps map…
Walkable amenities ~0.75 mi
Loading nearby amenities…
Taxation est. · year 1
- Rental income
- $15,666
- − Mortgage interest
- −$3,641
- − Property taxes
- −$975
- − Insurance
- −$325
- − Repairs & maintenance
- −$1,253
- − Management
- −$1,253
- − Depreciation
- −$1,891
- Taxable income
- $6,328
- Est. tax owed @ 24.0%
- −$1,519
- After-tax cash flow
- $5,467/yr
For passive investors: Depreciation is non-cash, so a rental often shows a tax loss while cash-flowing — sheltering income. Rental losses are passive: they offset passive income freely, and up to $25,000/yr can offset ordinary (W-2) income if you actively participate and your MAGI is under $100k (phasing out to $0 by $150k); unused losses carry forward. On sale, claimed depreciation is recaptured at up to 25%, and gains may owe capital-gains tax (a 1031 exchange can defer both). Figures are a year-1 estimate at your 24.0% rate — not tax advice; consult a CPA.
Schools (NCES district)
- District
- Ouachita Parish
- NCES district ID
- 2201200
- Math proficiency
- 31% ▼ -38.00%
- Reading proficiency
- 45% ▼ -31.00%
- Median HH income
- $43,316
- Composite
- 32.14/100
- National rank
- #5791
- State rank
- #26 of 98 in LA
Livability — West Monroe
- Score
- 70/100
- State rank
- #53
- US rank
- #7498
Category grades
Schools grade is shown separately in the Schools card above.
Census & demographics
- Census place
- West Monroe, LA
- County
- Ouachita Parish · 118,340 people
- City population
- 58,204
- Metro
- Monroe, LA
- Population (ZIP)
- 22,935
- Household income
- $51,355
- Rent vs Own
- Severe rent burden
- 1027.0
Population outlook (Ouachita County) Hauer SSP2
- Today (2025)
- 163,370 people
- By 2030
- 165,520 · +1.3%
- By 2040
- 167,652 · +2.6%
- By 2050
- 166,699 · +2.0%
- By 2075
- 156,348 · -4.3%
- By 2100
- 134,102 · -17.9%
Race, ethnicity, and origin ACS 2023
- Neighborhood character
- Predominantly White (73%)
- Race & ethnicity
- White 73% Black 20% Hispanic / Latino 4% Two or more races 3%
- Common ancestry
- Lithuanian 4% Slovak 2% Serbian 1%
- Foreign-born
- 1% · Canada
- Languages at home
- 98% English-only · Spanish 1%
Political lean MEDSL · Ouachita
- 2024 margin
- Strong R (+27.9) · D 35.5% · R 63.3% · Other 1.2%
- 2008→2024 swing
- -2.7pp toward R · 2008: -25.2pp · 2024: -27.9pp
- All cycles
- 2024: R+27.9 2020: R+23.6 2016: R+25.4 2012: R+20.9 2008: R+25.2
Not yet ingested
- Civics
- —
Market trends
- HPI YoY
- ▼ -53.78%
- Current HPI
- 189.9135
- Rent YoY
- —
- Metro
- Monroe, LA
- State GDP YoY
- ▲ 3.29%
- F500 in state
- 10
Industry mix (Fortune 500 HQ in LA)
| Industry | F500 HQs | Revenue |
|---|---|---|
| Telecommunications | 2 | $23B |
|
||
| Utilities | 1 | $12B |
|
||
| Wholesale / Distribution | 1 | $5B |
|
||
| Advertising | 1 | $2B |
|
||
Price history
+0.0% since first listed2 events — show timeline
- 2026-05-12 Listed $65,000 NELABOR
- 2025-02-26 Listed $65,000 NELABOR
Property tax history
+0.8%/yrLatest (2025): $95 · +5.7% YoY. Source: county tax records.
Cash-flow waterfall
monthlySold comps — $/sqft
last 12 mo · ≤1 miLoading sold comps…