 Multi-family
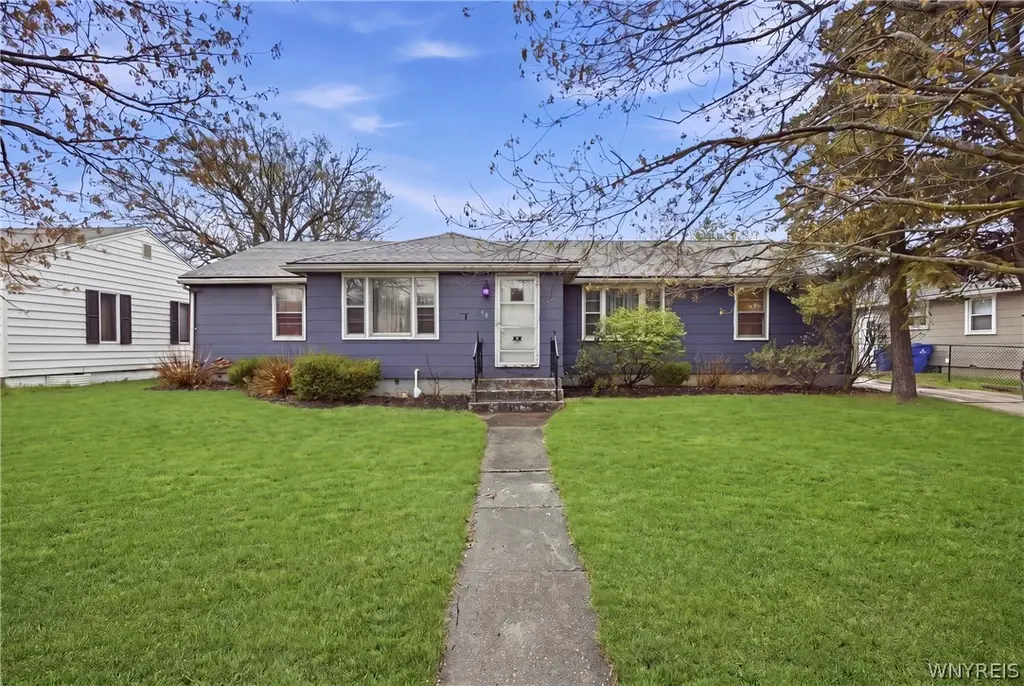
98 Frontier Dr · Blasdell, NY
Flood risk 1/10 · Minimal
- FEMA flood zone
- X (unshaded)
- Chance of flooding over 30 yrs
- 0.0%
- Est. flood insurance / yr
- $473 – $860
Fire risk 1/10 · Minimal
- Est. fire insurance / yr
- $691 – $1,283
Heat risk 2/10 · Minimal
- Hot days now (above 92°F)
- 7 days/yr
- Hot days in 30 yrs
- 16 days/yr
Wind risk 1/10 · Minimal
- Chance of severe wind over 30 yrs
- —
Air-quality risk 4/10 · Minor
- Unhealthy air days now
- 3 days/yr
- Unhealthy air days in 30 yrs
- 8 days/yr
Risk factors via First Street. Map © Google.
Why this score? — see what drove the C grade
The composite is a weighted blend of 9 inputs, each scored 0–100. Each bar is that input's sub-score; the figure is the points it added to the 100-point composite (weight × sub-score).
- Cash flow +23.2/30.0
- 1% rule +7.8/10.0
- DSCR +7.5/10.0
- ARV discount +7.5/15.0
- Schools +4.7/10.0
- Livability +3.3/5.0
- Rent growth +2.5/5.0
- Condition / age +2.5/5.0
- Appreciation +0.0/10.0
$189,900
🖨 Deal sheet 📄 Offer letter ✓ Due diligence
Multi-family units
County records classify this as Multi-Family (2-4 Unit). Listing-text estimate: 1 unit. estimate disagrees with records
Listing remarks
Welcome to 98 Frontier Drive in Blasdell- a rare duplex & excellent opportunity for both investors and owner-occupants alike. This side-by-side duplex offers two spacious units, each featuring 2 bedrooms, 1 full bathroom, an eat-in kitchen, and a generously sized living room, providing comfortable and functional living spaces on both sides. Each unit has its own private feel, complemented by a two-car garage thoughtfully divided in the center for added convenience and privacy. And the full basement adds ample storage space. The house is currently used as a single family home, and could be used as such in the future. Ideally located on a quiet street running between the Tehan Post on E
Key facts
- Quiet street
- Full basement
- Side by side duplex
Tags
Property features AI
Finance
- Financial info: Property operates as a 2-unit multi-family; Each unit currently rents for $900; Separate gas and electric meters for each unit; Operating expenses include trash and water/sewer; Owner pays trash collection and water for the property
Exterior
- Parking: Detached or attached 2-car garage; Concrete parking with two or more spaces
- Utilities: Public water connected; Sewer connected; High-speed internet available
- Home design: Single-story building; Existing condition
- Construction: Composite and shake siding; Asphalt roof; Poured foundation; Built previously (existing)
- Exterior features: Partial fencing; Patio
Interior
- Kitchen: Eat-in kitchens in each unit
- Bedrooms: Two 2-bedroom units
- Flooring: Carpet; Hardwood; Laminate; Tile; Vinyl; Varied flooring types
- Bathrooms: Two full bathrooms (one in each unit)
- Heating & cooling: Gas forced-air heating
- Interior features: Full basement with sump pump
- Laundry & utility: Gas water heater
Neighborhood map
What this means for you Summary
Snapshot
- This is a 4-bed/2.0-bath multifamily listed at $190k.
Deal economics
- At list price, monthly cash flow is $345 ($4k/yr) — positive.
- The deal already cash-flows at list — no discount required.
- Meets the 1% rule at list price ($2k rent vs $190k).
- Cap rate 8.5% vs local median 4.5% in Blasdell — top-decile yield for the area; either an underpriced asset or a hidden risk that comps aren't pricing in. Stress-test before assuming the spread holds.
Location & tenants
- Location reads 66/100 on livability (#643 in NY) — a middle-class / working-renter tenant base. Strengths: cost of living A+, housing A+, health & safety A+; Watch: employment D, schools D-, amenities F.
- Frontier Central School District (suburban): math 54% / reading 55% proficiency, ranked #301 of 590 in NY (top 51%) — acceptable for families but not a draw, mixed tenant base, ~2y average lease; only 20% free/reduced lunch — higher-income household profile.
- Market conditions: 44 active listings in the ZIP; 1 comparable units currently listed for rent nearby; 1,244 units permitted in Erie County in 2024 (563 in 5+ unit buildings).
Forward outlook
- Local home prices are declining (-3.0%/yr); year-one equity from $1k of loan paydown is wiped out by about $6k of value loss. Plan a longer hold.
Negotiation context
- Only 3 days on market — expect competitive offers; lowballing is unlikely to land.
- 3 sale attempts since 5y ago with the ask held roughly flat each time — persistent listings suggest the price (not the market) is what's stuck; bring a comps-based counter.
Risks & watch-outs
- Watch-outs: property tax is 3.2% of price; built in 1955 — expect roof / HVAC / electrical / plumbing capex.
Questions for the listing agent
- Built in 1955 — when were the roof, HVAC, electrical panel, plumbing, and water heater last replaced?
- Property tax is high relative to price — has the assessment been appealed recently, and will the sale trigger a re-assessment?
- Is there a deadline driving the sale (1031 exchange, divorce, estate, relocation)? That informs how much negotiation room exists.
- Schools are D-rated, which usually means shorter tenancies and higher turnover. Who's the typical renter profile here, and what's been the actual vacancy rate?
- What's the average days-on-market for RENTAL listings here right now (not sales)? A rising rental-DOM trend means longer vacancies and softer asking-rent achievability than the comps imply.
- What's the recent tenant-quality profile in this submarket — average credit score on applications, eviction rate, late-payment / NSF rate, and stable-employment percentage? A property-management company in the area should have these aggregated.
- How much new apartment / multifamily construction is in the pipeline within 1–3 miles? Heavy new supply (>2% of stock underway) typically softens rents 12–24 months out; light construction supports rent growth.
Investment metrics
- 1% rule
- 1.28% ✓
- Cap rate
- 8.47%
- Cash-on-cash
- 7.78%
- DSCR
- 1.35
- GRM
- 6.5
CMA / ARV
- ARV (median comp)
- $390,971
- List price
- $189,900
- Delta
- -51.43%
- Verdict
- UNDERPRICED
- Comps
- 20 within 1.0 mi
Show comp detail 2 sales within ~0.75 mi
| Address | Dist | Beds/Ba | Sqft | Sold | Price | $/sf | Match |
|---|---|---|---|---|---|---|---|
| 24 Commercial St | 0.18mi | 4/2.0 | 1,664 (+1%) | 1mo | $230,000 | $138 | 89 |
| 31 Orchard Ave | 0.19mi | 4/2.0 | 1,806 (+10%) | 19mo | $200,850 | $111 | 60 |
Match score weights: distance 35% · size 25% · config 20% · recency 20%. Top-matched comps best support the ARV.
Projected returns pro-forma
-3.0% appreciation · 3.0% rent growth · sell at horizon
- IRR
- -4.3%
- Equity multiple
- 0.84×
- Total profit
- $-8,626
- Equity at exit
- $28,315
- IRR
- 5.5%
- Equity multiple
- 1.41×
- Total profit
- $21,556
- Equity at exit
- $16,419
Cash invested: $53,172 (down + closing). Projections, not guarantees.
Landlord ↔ Tenant lean methodology
- Overall (STATE)
- 15 Strongly Tenant-Friendly
- State New York
- 15 Strongly Tenant-Friendly · D+10
- County
- — inherits STATE
- City
- — inherits STATE
ZIP-level market 14219
- Home prices YoY
- -19.4%
- Active inventory
- 44
- Price-to-rent
- 13.0×
Monthly cashflow live
- Estimated rent
- $2,430 medium interval (Pro) →
- Mortgage (P&I)
- −$996
- Tax from tax record
- −$500 /mo · $6,001/yr
- Insurance
- −$79
- HOA
- −$0
- Vacancy / Maint / Mgmt
- −$510
- Net cashflow
- $345
Break-even live
2-unit breakdown (identical units grouped — click to expand)
| Units | Beds | Baths | Est. rent |
|---|---|---|---|
| 2× units | 2 | 1 | $2,430 |
| #1 | 2 | 1 | $1,215 |
| #2 | 2 | 1 | $1,215 |
| Total (2 units) | $2,430 | ||
UW: 25.0% down · 7.5% · 30yr · 1.5% tax · 5.0% vac · 8.0% maint · 8.0% mgmt
Financing live
Cash to close
- Down payment
- $47,475
- Closing costs
- $5,697
- Reserves months
- —
- Total cash needed
- —
Loan-product check · same deal, 3 products live
Conventional
25% down · 7.5% · 30yr
- Down + closing
- —
- Monthly P&I
- —
- Monthly cashflow
- —
- DSCR
- —
- Eligible?
- —
Personal DTI + credit; lowest rate.
DSCR
20% down · 8.5% · 30yr
- Down + closing
- —
- Monthly P&I
- —
- Monthly cashflow
- —
- DSCR
- —
- Eligible?
- —
No personal income docs; deal must DSCR.
Hard money
10% down · 12.0% · 12mo
- Down + closing
- —
- Monthly P&I
- —
- Monthly cashflow
- —
- DSCR
- —
- Eligible?
- —
Short-term bridge; refi at stabilization.
Rent comps 1 comps
| Address | Beds | Baths | Sqft | Rent | $/sqft | DOM | Units | Dist |
|---|---|---|---|---|---|---|---|---|
| 3365 McKinley Pkwy Buffalo, NY | 3.0 | 1.0 | 2016 | $2,200 | $1.09 | 2d | 1 | 1.06mi |
Listing history 9 events
-
2026-05-03status Pending 1283-char remark
-
2026-04-30$189,900 Active 1283-char remark
-
2022-05-24soldstatus $160,000
-
2021-11-27historical
-
2021-11-27historical
-
2021-09-19price $189,900
-
2021-09-19price $189,900
-
2021-08-27$194,900 Active
-
2021-08-27$194,900 Active
ⓘ Source: listings_history table (triggers on properties + properties_extension) + one-shot
backfill from property_details.listing_events for pre-trigger history.
Tax reassessment forecast NY · Partial reset (capped growth)
- Current annual tax
- $6,001 · $500/mo
- Projected year-2 tax
- $6,001 · $500/mo
- Expected delta
- $0/yr ($0/mo · 0.0%)
ⓘ Screening estimate from a state-policy table — verify with the county assessor before closing.
Climate risk First Street
- Flood 1/10 Low FEMA zone X (unshaded) · 0% chance over 30 yrs
- Wildfire 1/10 Low
- Heat 2/10 Low 7 d/yr ≥92°F today · 16 d/yr by 30 yrs out
- Wind 1/10 Low
- Air quality 4/10 Moderate 3 unhealthy d/yr today · 8 by 30 yrs out
Nearby sold comps map
Loading sold comps map…
Walkable amenities ~0.75 mi
Loading nearby amenities…
Taxation est. · year 1
- Rental income
- $29,160
- − Mortgage interest
- −$10,637
- − Property taxes
- −$6,001
- − Insurance
- −$950
- − Repairs & maintenance
- −$2,333
- − Management
- −$2,333
- − Depreciation
- −$5,524
- Taxable income
- $1,382
- Est. tax owed @ 24.0%
- −$332
- After-tax cash flow
- $3,804/yr
For passive investors: Depreciation is non-cash, so a rental often shows a tax loss while cash-flowing — sheltering income. Rental losses are passive: they offset passive income freely, and up to $25,000/yr can offset ordinary (W-2) income if you actively participate and your MAGI is under $100k (phasing out to $0 by $150k); unused losses carry forward. On sale, claimed depreciation is recaptured at up to 25%, and gains may owe capital-gains tax (a 1031 exchange can defer both). Figures are a year-1 estimate at your 24.0% rate — not tax advice; consult a CPA.
Schools (NCES district)
- District
- Frontier Central School District
- NCES district ID
- 3611670
- Math proficiency
- 54% ▼ -16.00%
- Reading proficiency
- 55% ▼ -10.00%
- Median HH income
- $58,807
- Composite
- 47.36/100
- National rank
- #2291
- State rank
- #301 of 590 in NY
Livability — Blasdell
- Score
- 66/100
- State rank
- #643
- US rank
- #12059
Category grades
Schools grade is shown separately in the Schools card above.
Census & demographics
- Census place
- Blasdell, NY
- Population (ZIP)
- 10,894
Population outlook (Erie County) Hauer SSP2
- Today (2025)
- 933,037 people
- By 2030
- 935,181 · +0.2%
- By 2040
- 928,531 · -0.5%
- By 2050
- 905,725 · -2.9%
- By 2075
- 834,037 · -10.6%
- By 2100
- 708,033 · -24.1%
Race, ethnicity, and origin ACS 2023
- Neighborhood character
- Predominantly White (87%)
- Race & ethnicity
- White 87% Two or more races 5% Hispanic / Latino 5% Asian 2% Black 2%
- Common ancestry
- Romanian 21% Slovak 5% Lithuanian 2%
- Foreign-born
- 3% · Canada
- Languages at home
- 93% English-only · Russian/Polish/Slavic 3% Other Indo-European 2% Spanish 1%
Political lean MEDSL · Erie
- 2024 margin
- Lean D (+9.7) · D 54.8% · R 45.2%
- 2008→2024 swing
- -7.9pp toward R · 2008: 17.5pp · 2024: 9.7pp
- All cycles
- 2024: D+9.7 2020: D+14.7 2016: D+4.8 2012: D+15.6 2008: D+17.5
Not yet ingested
- Civics
- —
Market trends
- HPI YoY
- ▼ -80.33%
- Current HPI
- 332.7314
- Rent YoY
- —
- Metro
- —
- State GDP YoY
- ▲ 2.60%
- F500 in state
- 92
Industry mix (Fortune 500 HQ in NY)
| Industry | F500 HQs | Revenue |
|---|---|---|
| Financial Services | 10 | $950B |
|
||
| Consumer Goods | 9 | $162B |
|
||
| Insurance | 4 | $225B |
|
||
| Telecommunications | 2 | $144B |
|
||
| Pharmaceuticals | 2 | $112B |
|
||
| Media / Entertainment | 2 | $69B |
|
||
Price history
+12.9% since first listed10 events — show timeline
- 2026-06-08 Sold (MLS) $220,000 WNYREIS
- 2026-05-03 Pending — WNYREIS
- 2026-04-30 Listed $189,900 WNYREIS
- 2022-05-24 Sold (Public Records) $160,000 Public Records
- 2021-11-27 Listing Removed — WNYREIS
- 2021-11-27 Listing Removed — WNYREIS
- 2021-09-19 Price Changed $189,900 WNYREIS
- 2021-09-19 Price Changed $189,900 WNYREIS
- 2021-08-27 Listed $194,900 WNYREIS
- 2021-08-27 Listed $194,900 WNYREIS
Property tax history
+5.6%/yrLatest (2025): $6,001 · +1.9% YoY. Source: county tax records.
Cash-flow waterfall
monthlySold comps — $/sqft
last 12 mo · ≤1 miLoading sold comps…