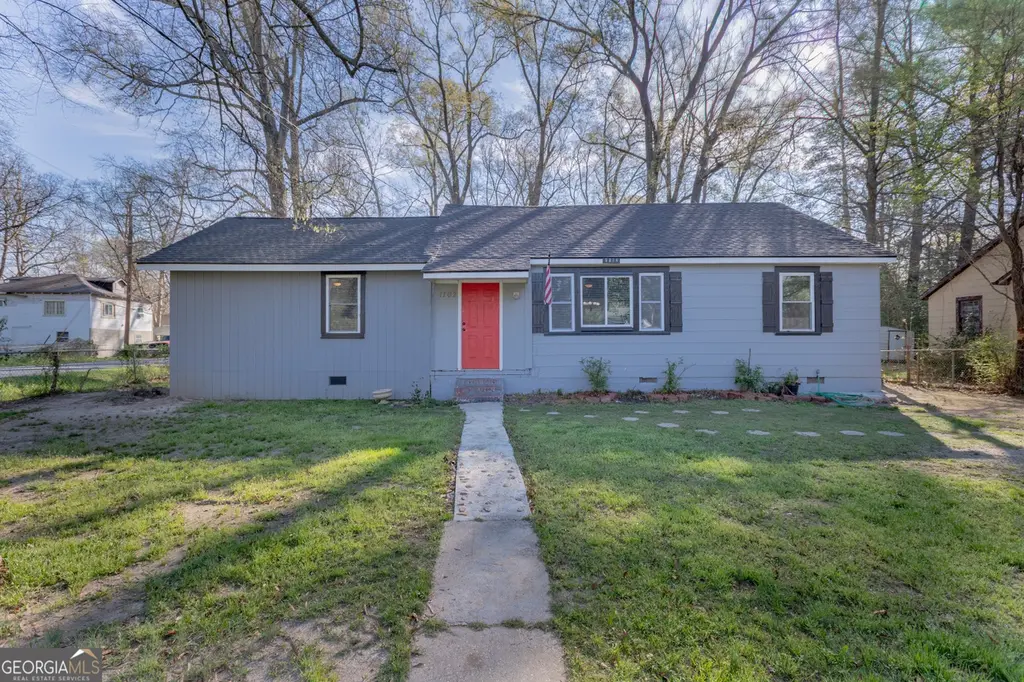
1102 Calvin Ave · Columbus, GA
Flood risk 1/10 · Minimal
- FEMA flood zone
- X (unshaded)
- Chance of flooding over 30 yrs
- 0.0%
- Est. flood insurance / yr
- $507 – $1,088
Fire risk 3/10 · Minor
- Est. fire insurance / yr
- $963 – $1,789
Heat risk 7/10 · Major
- Hot days now (above 107°F)
- 7 days/yr
- Hot days in 30 yrs
- 19 days/yr
Wind risk 6/10 · Moderate
- Chance of severe wind over 30 yrs
- 76.0%
Air-quality risk 4/10 · Minor
- Unhealthy air days now
- 4 days/yr
- Unhealthy air days in 30 yrs
- 5 days/yr
Risk factors via First Street. Map © Google.
Why this score? — see what drove the F grade
The composite is a weighted blend of 9 inputs, each scored 0–100. Each bar is that input's sub-score; the figure is the points it added to the 100-point composite (weight × sub-score).
- Cash flow +10.9/30.0
- ARV discount +7.5/15.0
- DSCR +3.2/10.0
- Livability +3.2/5.0
- Rent growth +3.0/5.0
- Condition / age +2.5/5.0
- 1% rule +2.4/10.0
- Schools +2.2/10.0
- Appreciation +0.0/10.0
$120,000
🖨 Deal sheet (PDF) 📄 Offer letter ✓ Due diligence
Listing remarks MLS
Welcome home to this beautifully remodeled 3-bedroom, 2-bathroom property ideally located just minutes from Fort Benning. Situated on a desirable corner lot, this home with a fenced in yard offers both privacy and curb appeal.
Key facts
- Remodeled
- Curb appeal
- Corner lot
Tags
Neighborhood map
What this means for you Summary
Snapshot
- This is a 2-bed/1.0-bath single-family listed at $120k.
Deal economics
- At list price, monthly cash flow is $-53 ($-638/yr) — negative.
- To cash-flow at today's rent, offer at most $111k (7.8% below list).
- To meet the 1% rule (rent ≥ 1% of price), the offer needs to be $89k (25.9% below list).
- Recommended offer: $89k (25.9% below list) — sets the bar for 1% rule.
- Cap rate 5.8% vs local median 4.7% in Columbus — meaningfully above typical; check what's discounted (condition, days-on-market, listing class) to confirm the premium yield is real.
Location & tenants
- Location reads 64/100 on livability (#254 in GA) — a middle-class / working-renter tenant base. Strengths: cost of living A+, housing A+, health & safety B; Watch: amenities D+, crime F, commute F.
- Muscogee County (urban): math 21% / reading 30% proficiency, ranked #120 of 174 in GA (top 69%) — low school quality limits family demand, transient renter base, plan for 1-2y turnover; 61% free/reduced lunch — lower-income household profile, screen leases tightly.
- Zoned schools: Dorothy Height Elementary School (math 3% / reading 9%, grade F, #1,154 of 1,228 statewide, top 94%, 500 students, 97% FRL); Baker Middle School (math 2% / reading 9%, grade F, #461 of 470 statewide, top 98%, 588 students, 97% FRL); Spencer High School (math 2% / reading 8%, grade F, #394 of 424 statewide, top 97%, 943 students, 97% FRL) — zoned schools average 97% FRL vs 61% district-wide (36 pts higher); higher-poverty schools than district average — tighter screening recommended.
- Zoned-school proficiency averages 6% at this address vs 26% district-wide (-20 pts) — the specific schools serving this property underperform the Muscogee County average; the district grade overstates school quality for this exact location.
- Market conditions: Rents rising (+1.8%/yr); 105 active listings in the ZIP; 26 comparable units currently listed for rent nearby; rentals at typical pace (median 23d on market — plan ~3-4 weeks tenant-placement turnaround); lower-income renter base — watch delinquency; 291 units permitted in Muscogee County in 2024 (30 in 5+ unit buildings).
Forward outlook
- Local home prices are declining (-3.0%/yr); year-one equity from $830 of loan paydown is wiped out by about $4k of value loss. Plan a longer hold.
- Muscogee County population projected at +15% by 2050 — modest demand growth; plan on rents tracking national, not racing it.
Negotiation context
- It's been on market 98 days — a 9% lower offer ($109k) is reasonable based on typical stale-listing flexibility.
- 5 sale attempts since 5y ago; this cycle's ask has dropped $20k (14%) from the opening price — seller is motivated, your offer sets the floor, not the list.
- Current owner paid $27k; list at $120k implies a 344% gain — meaningful room to come down on a strong offer.
Risks & watch-outs
- Watch-outs: built in 1948 — expect roof / HVAC / electrical / plumbing capex.
- Climate carrying-cost: major wind risk, 76% chance of damaging wind over 30y; extreme-heat days projected 7→19/yr by 2055 (HVAC capex compounding) — expect insurance premiums to compound above CPI over the hold.
Questions for the listing agent
- What do current leases actually rent for vs. the listed asking? Can we see a recent rent roll and the last 12 months of T-12 income?
- It's been on market 98 days. Have you received any prior offers? Is the seller open to a 26% concession, seller financing, or rate buy-down credit?
- Built in 1948 — when were the roof, HVAC, electrical panel, plumbing, and water heater last replaced?
- Why hasn't it sold? Are there any deal-killer items the seller is aware of (foundation, flood, title, zoning, code violations)?
- Is there a deadline driving the sale (1031 exchange, divorce, estate, relocation)? That informs how much negotiation room exists.
- Schools are F-rated, which usually means shorter tenancies and higher turnover. Who's the typical renter profile here, and what's been the actual vacancy rate?
- Crime grade is F in this area — have there been break-ins, vandalism, or insurance claims at this property in the last 3 years? What carrier currently insures it and at what premium?
- The area grade is low — what's the realistic commute time and amenity access for the typical tenant pool here? Any planned neighborhood developments (good or bad) we should know about?
- What's the average days-on-market for RENTAL listings here right now (not sales)? A rising rental-DOM trend means longer vacancies and softer asking-rent achievability than the comps imply.
- What's the recent tenant-quality profile in this submarket — average credit score on applications, eviction rate, late-payment / NSF rate, and stable-employment percentage? A property-management company in the area should have these aggregated.
- How much new for-sale + rental construction is in the pipeline within 1–3 miles? Heavy new supply typically softens prices + rents 12–24 months out; constrained supply supports both.
Investment metrics
- 1% rule
- 0.74% ✗
- Cap rate
- 5.76%
- Cash-on-cash
- -1.90%
- DSCR
- 0.92
- GRM
- 11.3
CMA / ARV
- ARV (median comp)
- $50,911
- List price
- $120,000
- Delta
- 135.70%
- Verdict
- OVERPRICED
- Comps
- 20 within 1.0 mi
Show comp detail 12 sales within ~0.75 mi
| Address | Dist | Beds/Ba | Sqft | Sold | Price | $/sf | Match |
|---|---|---|---|---|---|---|---|
| 1114 Brooks Rd | 0.08mi | 2/1.0 | 942 (-1%) | 12mo | $25,000 | $27 | 84 |
| 810 Winston Rd | 0.30mi | 2/1.0 | 1,008 (+6%) | 5mo | $7,500 | $7 | 72 |
| 909 Sheridan Ave | 0.34mi | 3/2.0 (+1) | 984 (+3%) | 10mo | $29,000 | $29 | 62 |
| 917 Brooks Rd | 0.21mi | 2/1.0 | 858 (-10%) | 14mo | $22,500 | $26 | 62 |
| 716 Benning Dr | 0.37mi | 2/1.5 | 1,056 (+11%) | 4mo | $53,300 | $50 | 59 |
| 929 Winston Rd | 0.20mi | 3/2.0 (+1) | 1,064 (+12%) | 5mo | $105,000 | $99 | 58 |
| 270 32nd Ave | 0.66mi | 2/1.0 | 1,053 (+11%) | 3mo | $19,900 | $19 | 49 |
| 1401 Clark Ave | 0.58mi | 3/1.0 (+1) | 1,026 (+8%) | 8mo | $110,000 | $107 | 49 |
| 1417 Clark Ave | 0.60mi | 3/1.0 (+1) | 1,016 (+7%) | 9mo | $108,000 | $106 | 48 |
| 2973 Hawthorne Dr | 0.69mi | 3/1.0 (+1) | 1,014 (+6%) | 4mo | $68,000 | $67 | 48 |
| 1334 Foye Ave | 0.70mi | 2/1.0 | 925 (-3%) | 23mo | $55,000 | $59 | 44 |
| 1551 Bowman St | 0.74mi | 3/1.0 (+1) | 1,014 (+6%) | 16mo | $32,000 | $32 | 36 |
Match score weights: distance 35% · size 25% · config 20% · recency 20%. Top-matched comps best support the ARV.
Projected returns pro-forma
-3.0% appreciation · 1.82% rent growth · sell at horizon
- IRR
- -20.7%
- Equity multiple
- 0.29×
- Total profit
- $-23,906
- Equity at exit
- $17,892
- IRR
- -16.6%
- Equity multiple
- 0.12×
- Total profit
- $-29,486
- Equity at exit
- $10,375
Cash invested: $33,600 (down + closing). Projections, not guarantees.
Landlord ↔ Tenant lean methodology
- Overall (STATE)
- 90 Strongly Landlord-Friendly
- State Georgia
- 90 Strongly Landlord-Friendly · R+3
- County
- — inherits STATE
- City
- — inherits STATE
ZIP-level market 31903
- Home prices YoY
- -14.5%
- Rents YoY
- 1.8%
- Active inventory
- 105
- Price-to-rent
- 11.3×
Monthly cashflow live
- Estimated rent
- $889 high interval (Pro) →
- Mortgage (P&I)
- −$629
- Tax from tax record
- −$76 /mo · $912/yr
- Insurance
- −$50
- HOA
- −$0
- Vacancy / Maint / Mgmt
- −$187
- Net cashflow
- $-53
Break-even live
Sensitivity live
| Price | -10% $15 | -5% $-19 | +0% $-53 | +5% $-87 | +10% $-121 |
|---|---|---|---|---|---|
| Rent | -10% $-123 | -5% $-88 | +0% $-53 | +5% $-18 | +10% $17 |
| Rate | -1.0pp $7 | -0.5pp $-23 | base $-53 | +0.5pp $-84 | +1.0pp $-116 |
UW: 25.0% down · 7.5% · 30yr · 1.5% tax · 5.0% vac · 8.0% maint · 8.0% mgmt
Financing live
Cash to close
- Down payment
- $30,000
- Closing costs
- $3,600
- Reserves months
- —
- Total cash needed
- —
Loan-product check · same deal, 3 products live
Conventional
25% down · 7.5% · 30yr
- Down + closing
- —
- Monthly P&I
- —
- Monthly cashflow
- —
- DSCR
- —
- Eligible?
- —
Personal DTI + credit; lowest rate.
DSCR
20% down · 8.5% · 30yr
- Down + closing
- —
- Monthly P&I
- —
- Monthly cashflow
- —
- DSCR
- —
- Eligible?
- —
No personal income docs; deal must DSCR.
Hard money
10% down · 12.0% · 12mo
- Down + closing
- —
- Monthly P&I
- —
- Monthly cashflow
- —
- DSCR
- —
- Eligible?
- —
Short-term bridge; refi at stabilization.
Rent comps 26 comps
| Address | Beds | Baths | Sqft | Rent | $/sqft | DOM | Units | Dist |
|---|---|---|---|---|---|---|---|---|
| 1206 Winston Rd Columbus, GA | 2.0 | 1.0 | 868 | $750 | $0.86 | 45d | 1 | 0.09mi |
| 1048 Brooks Rd Columbus, GA | 2.0 | 1.0 | 942 | $925 | $0.98 | 23d | 1 | 0.10mi |
| 3909 Baker Plaza Dr Columbus, GA | 1.0–2.0 | 1.0–2.0 | 869 | $1,010 | $1.16 | 15d | 1 | 0.42mi |
| 3390 N Lumpkin Rd Columbus, GA | 2.0–3.0 | 2.0 | 1073 | $999 | $0.93 | 15d | 14 | 0.59mi |
| 3217 Lee St Apt 1 Columbus, GA | 2.0 | 1.0 | 688 | $899 | $1.31 | 45d | 1 | 0.61mi |
| 3213 Lee St Unit 3 Columbus, GA | 2.0 | 1.0 | 1100 | $925 | $0.84 | 15d | 1 | 0.62mi |
| 1414 Foye Ave Columbus, GA | 2.0 | 1.0 | 1021 | $895 | $0.88 | 15d | 1 | 0.70mi |
| 3320 N Lumpkin Rd Columbus, GA | 2.0–3.0 | 2.0 | 1098 | $999 | $0.91 | 15d | 8 | 0.73mi |
| 1459 Ivan Ave Columbus, GA | 3.0 | 1.0 | 1003 | $975 | $0.97 | 45d | 1 | 0.96mi |
| 2630 Garden Dr Columbus, GA | 2.0 | 1.0 | 1008 | $755 | $0.75 | 45d | 1 | 1.15mi |
| 909 Farr Rd Columbus, GA | 1.0–4.0 | 1.0–1.5 | 1200 | $713 | $0.59 | 23d | 1 | 1.17mi |
| 48 Douglas St Columbus, GA | 3.0 | 1.0 | 1038 | $980 | $0.94 | 15d | 1 | 1.18mi |
| 2051 Somerset Ave Columbus, GA | 3.0 | 1.0 | 1092 | $1,100 | $1.01 | 45d | 1 | 1.23mi |
| 243 Oakley Ct Columbus, GA | 1.0–2.0 | 1.0–2.0 | 1005 | $1,149 | $1.14 | 15d | 6 | 1.29mi |
| 497 Mellon St Columbus, GA | 1.0 | 1.0 | 600 | $600 | $1.00 | 23d | 1 | 1.31mi |
| 2406 Dawson St #2 Columbus, GA | 2.0 | 1.0 | 565 | $700 | $1.24 | 23d | 1 | 1.31mi |
| 513 Farr Rd Columbus, GA | 2.0 | 1.0 | 1000 | $968 | $0.97 | 45d | 1 | 1.32mi |
| 2220 Ticknor Dr Columbus, GA | 1.0 | 1.0 | 706 | $650 | $0.92 | 15d | 1 | 1.41mi |
| 2220 Ticknor Dr Unit 9 Columbus, GA | 1.0 | 1.0 | 706 | $675 | $0.96 | 15d | 1 | 1.41mi |
| 2220 Ticknor Dr Unit 1 Columbus, GA | 1.0 | 1.0 | 706 | $750 | $1.06 | 23d | 1 | 1.41mi |
| 2220 Ticknor Dr Columbus, GA | 1.0 | 1.0 | 706 | $675 | $0.96 | 45d | 1 | 1.41mi |
| 171 Munson Dr Columbus, GA | 2.0 | 1.0 | 780 | $800 | $1.03 | 23d | 1 | 1.44mi |
| 214 23rd Ave Unit A Columbus, GA | 1.0 | 1.0 | 640 | $410 | $0.64 | 15d | 1 | 1.46mi |
| 3053 Blan St Columbus, GA | 2.0 | 1.0 | 868 | $875 | $1.01 | 15d | 1 | 1.47mi |
| 25 Mason Dr Columbus, GA | 3.0 | 1.0 | 1038 | $1,100 | $1.06 | 23d | 1 | 1.48mi |
| 121 Torch Hill Rd Columbus, GA | 2.0 | 1.0 | 936 | $825 | $0.88 | 45d | 1 | 1.49mi |
Listing history 27 events
-
2026-06-22days on market $120,000 Active 98 DOM
-
2026-06-18days on market $120,000 Active 95 DOM
-
2026-06-17days on market $120,000 Active 94 DOM
-
2026-06-16days on market $120,000 Active 93 DOM
-
2026-06-15days on market $120,000 Active 92 DOM
-
2026-06-14days on market $120,000 Active 90 DOM
-
2026-06-13days on market $120,000 Active 89 DOM
-
2026-06-10days on market $120,000 Active 87 DOM
-
2026-06-09days on market $120,000 Active 86 DOM
-
2026-06-08days on market $120,000 Active 85 DOM
-
2026-06-07days on market $120,000 Active 84 DOM
-
2026-06-05days on market $120,000 Active 81 DOM
-
2026-06-03days on market $120,000 Active 80 DOM
-
2026-06-02days on market $120,000 Active 79 DOM
-
2026-06-01days on market $120,000 Active 78 DOM
-
2026-05-31days on market $120,000 Active 77 DOM
-
2026-05-30days on market $120,000 Active 76 DOM
-
2026-05-17status Active 226-char remark
Show marketing remark (226 chars)
Welcome home to this beautifully remodeled 3-bedroom, 2-bathroom property ideally located just minutes from Fort Benning. Situated on a desirable corner lot, this home with a fenced in yard offers both privacy and curb appeal.
-
2026-05-17status Back On Market 226-char remark
Show marketing remark (226 chars)
Welcome home to this beautifully remodeled 3-bedroom, 2-bathroom property ideally located just minutes from Fort Benning. Situated on a desirable corner lot, this home with a fenced in yard offers both privacy and curb appeal.
-
2026-05-13status Under Contract 226-char remark
Show marketing remark (226 chars)
Welcome home to this beautifully remodeled 3-bedroom, 2-bathroom property ideally located just minutes from Fort Benning. Situated on a desirable corner lot, this home with a fenced in yard offers both privacy and curb appeal.
-
2026-05-13status Pending 226-char remark
Show marketing remark (226 chars)
Welcome home to this beautifully remodeled 3-bedroom, 2-bathroom property ideally located just minutes from Fort Benning. Situated on a desirable corner lot, this home with a fenced in yard offers both privacy and curb appeal.
-
2026-04-29price $120,000 226-char remark
Show marketing remark (226 chars)
Welcome home to this beautifully remodeled 3-bedroom, 2-bathroom property ideally located just minutes from Fort Benning. Situated on a desirable corner lot, this home with a fenced in yard offers both privacy and curb appeal.
-
2026-03-09$140,000 Active 226-char remark
Show marketing remark (226 chars)
Welcome home to this beautifully remodeled 3-bedroom, 2-bathroom property ideally located just minutes from Fort Benning. Situated on a desirable corner lot, this home with a fenced in yard offers both privacy and curb appeal.
-
2026-03-09$140,000 New 226-char remark
Show marketing remark (226 chars)
Welcome home to this beautifully remodeled 3-bedroom, 2-bathroom property ideally located just minutes from Fort Benning. Situated on a desirable corner lot, this home with a fenced in yard offers both privacy and curb appeal.
-
2021-11-10soldstatus $27,000
-
2021-08-19$27,900
ⓘ Source: listings_history table (triggers on properties + properties_extension) + one-shot
backfill from property_details.listing_events for pre-trigger history.
Tax reassessment forecast GA · Resets to sale price
- Current annual tax
- $912 · $76/mo
- Projected year-2 tax
- $1,104 · $92/mo
- Expected delta
- +$192/yr (+$16/mo · 21.0%)
ⓘ Screening estimate from a state-policy table — verify with the county assessor before closing.
Climate risk First Street
- Flood 1/10 Low FEMA zone X (unshaded) · 0% chance over 30 yrs
- Wildfire 3/10 Moderate
- Heat 7/10 Severe 7 d/yr ≥107°F today · 19 d/yr by 30 yrs out
- Wind 6/10 Major 76% chance of damaging wind over 30 yrs
- Air quality 4/10 Moderate 4 unhealthy d/yr today · 5 by 30 yrs out
Nearby sold comps map
Loading sold comps map…
Walkable amenities ~0.75 mi
Loading nearby amenities…
Taxation est. · year 1
- Rental income
- $10,666
- − Mortgage interest
- −$6,722
- − Property taxes
- −$912
- − Insurance
- −$600
- − Repairs & maintenance
- −$853
- − Management
- −$853
- − Depreciation
- −$3,491
- Taxable loss
- −$2,766
- Est. tax savings @ 24.0%
- +$664
- After-tax cash flow
- $26/yr
For passive investors: Depreciation is non-cash, so a rental often shows a tax loss while cash-flowing — sheltering income. Rental losses are passive: they offset passive income freely, and up to $25,000/yr can offset ordinary (W-2) income if you actively participate and your MAGI is under $100k (phasing out to $0 by $150k); unused losses carry forward. On sale, claimed depreciation is recaptured at up to 25%, and gains may owe capital-gains tax (a 1031 exchange can defer both). Figures are a year-1 estimate at your 24.0% rate — not tax advice; consult a CPA.
Schools (NCES district)
- District
- Muscogee County
- NCES district ID
- 1303870
- Math proficiency
- 21% ▼ -11.00%
- Reading proficiency
- 30% ▼ -7.00%
- Median HH income
- $41,176
- Composite
- 21.6/100
- National rank
- #8297
- State rank
- #120 of 174 in GA
Livability — Columbus
- Score
- 64/100
- State rank
- #254
- US rank
- #14102
Category grades
Schools grade is shown separately in the Schools card above.
Census & demographics
- Census place
- Columbus, GA
- County
- Muscogee County · 180,764 people
- City population
- 180,764
- Metro
- Columbus, GA-AL
- Population (ZIP)
- 20,644
- Household income
- $32,401
- Rent vs Own
- Severe rent burden
- 1878.0
Population outlook (Muscogee County) Hauer SSP2
- Today (2025)
- 216,729 people
- By 2030
- 224,504 · +3.6%
- By 2040
- 238,318 · +10.0%
- By 2050
- 249,027 · +14.9%
- By 2075
- 264,862 · +22.2%
- By 2100
- 254,786 · +17.6%
Race, ethnicity, and origin ACS 2023
- Neighborhood character
- Predominantly Black (77%)
- Race & ethnicity
- Black 77% Hispanic / Latino 11% White 9% Two or more races 3% Asian 1%
- Hispanic origin (detail)
- Mexican 6% Puerto Rican 2%
- Foreign-born
- 6% · Canada
- Languages at home
- 88% English-only · Spanish 10% Other Indo-European 1%
Political lean MEDSL · Muscogee
- 2024 margin
- Strong D (+23.4) · D 61.4% · R 38.0%
- 2008→2024 swing
- +3.7pp toward D · 2008: 19.7pp · 2024: 23.4pp
- All cycles
- 2024: D+23.4 2020: D+24.0 2016: D+18.6 2012: D+21.3 2008: D+19.7
Not yet ingested
- Civics
- —
Market trends
- HPI YoY
- ▼ -22.30%
- Current HPI
- 131.4761
- Rent YoY
- ▲ 1.82%
- Metro
- Columbus, GA-AL
- State GDP YoY
- ▲ 2.66%
- F500 in state
- 28
Industry mix (Fortune 500 HQ in GA)
| Industry | F500 HQs | Revenue |
|---|---|---|
| Paper / Packaging | 2 | $29B |
|
||
| Retail | 1 | $160B |
|
||
| Transportation / Logistics | 1 | $91B |
|
||
| Airlines | 1 | $62B |
|
||
| Consumer Goods | 1 | $47B |
|
||
| Utilities | 1 | $25B |
|
||
Price history
+330.1% since first listed10 events — show timeline
- 2026-05-17 Relisted — CBOR
- 2026-05-17 Relisted — GAMLS
- 2026-05-13 Pending — GAMLS
- 2026-05-13 Pending — CBOR
- 2026-04-29 Price Changed $120,000 CBOR
- 2026-04-29 Price Changed $120,000 GAMLS
- 2026-03-09 Listed $140,000 CBOR
- 2026-03-09 Listed $140,000 GAMLS
- 2021-11-10 Sold (MLS) $27,000 CBOR
- 2021-08-19 Listed $27,900 CBOR
Property tax history
+7.4%/yrLatest (2025): $912 · +64.8% YoY. Source: county tax records.
Cash-flow waterfall
monthlySold comps — $/sqft
last 12 mo · ≤1 miLoading sold comps…