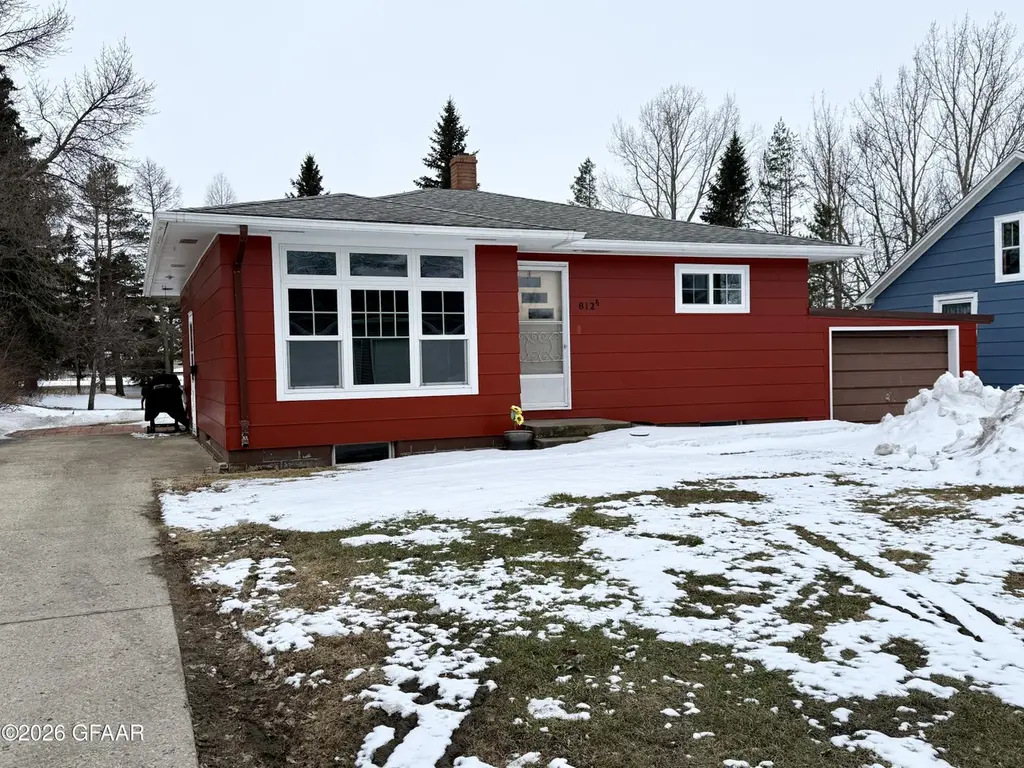
812 1/2 7th St · Langdon, ND
Flood risk 1/10 · Minimal
- FEMA flood zone
- X (unshaded)
- Chance of flooding over 30 yrs
- 0.0%
- Est. flood insurance / yr
- $473 – $860
Fire risk 1/10 · Minimal
- Est. fire insurance / yr
- $1,289 – $2,393
Heat risk 1/10 · Minimal
- Hot days now (above 91°F)
- 7 days/yr
- Hot days in 30 yrs
- 12 days/yr
Wind risk 1/10 · Minimal
- Chance of severe wind over 30 yrs
- —
Air-quality risk 4/10 · Minor
- Unhealthy air days now
- 5 days/yr
- Unhealthy air days in 30 yrs
- 5 days/yr
Risk factors via First Street. Map © Google.
Why this score? — see what drove the C+ grade
The composite is a weighted blend of 9 inputs, each scored 0–100. Each bar is that input's sub-score; the figure is the points it added to the 100-point composite (weight × sub-score).
- Cash flow +21.8/30.0
- ARV discount +15.0/15.0
- DSCR +7.0/10.0
- 1% rule +5.7/10.0
- Schools +4.1/10.0
- Condition / age +3.8/5.0
- Livability +3.6/5.0
- Rent growth +2.5/5.0
- Appreciation +0.0/10.0
$79,000
🖨 Deal sheet 📄 Offer letter ✓ Due diligence
Key facts
- Private backyard
- Updated kitchen
- 0.25 acre lot
Tags
Property features AI
Exterior
- Parking: Attached garage (1 car)
- Utilities: Public water; Natural gas available
- Home design: Single-family residence; One level
- Construction: Block foundation
- Exterior features: Lot approximately 11,000 square feet; Irregular lot dimensions
Interior
- Bedrooms: Total rooms: 6
- Bathrooms: 1 full bathroom
- Heating & cooling: Has heating; Has cooling
- Interior features: Full basement
Neighborhood map
What this means for you Summary
Snapshot
- This is a 2-bed/1.0-bath single-family listed at $79k. Condition is rated good.
Deal economics
- At list price, monthly cash flow is $123 ($1k/yr) — positive.
- The deal already cash-flows at list — no discount required.
- Meets the 1% rule at list price ($847 rent vs $79k).
- Recommended offer: $78k (1.5% below list) — sets the bar for market timing.
Location & tenants
- Location reads 72/100 on livability (#42 in ND) — a middle-class / working-renter tenant base. Strengths: crime A+, cost of living A+, housing A+; Watch: health & safety D+, amenities F, commute F.
- Langdon Area 23 (rural): math 38% / reading 51% proficiency, ranked #83 of 169 in ND (top 49%) — families likely to look elsewhere, expect single-tenant / working-renter base with shorter leases.
- Zoned schools: Langdon Area Elementary School (math 52% / reading 57%, grade C, #39 of 236 statewide, top 21%, 239 students, 23% FRL); Langdon Area High School (math 27% / reading 47%, grade F, #71 of 144 statewide, top 52%, 176 students, 19% FRL) — zoned schools at 21% FRL track the district average.
- Market conditions: 16 active listings in the ZIP; 2 units permitted in Cavalier County in 2024 (0 in 5+ unit buildings).
Forward outlook
- Local home prices are declining (-3.0%/yr); year-one equity from $546 of loan paydown is wiped out by about $2k of value loss. Plan a longer hold.
Negotiation context
- It's been on market 29 days — a 2% lower offer ($78k) is reasonable based on typical stale-listing flexibility.
Risks & watch-outs
- Watch-outs: built in 1959 — expect roof / HVAC / electrical / plumbing capex.
Questions for the listing agent
- Built in 1959 — when were the roof, HVAC, electrical panel, plumbing, and water heater last replaced?
- Is there a deadline driving the sale (1031 exchange, divorce, estate, relocation)? That informs how much negotiation room exists.
- What's the average days-on-market for RENTAL listings here right now (not sales)? A rising rental-DOM trend means longer vacancies and softer asking-rent achievability than the comps imply.
- What's the recent tenant-quality profile in this submarket — average credit score on applications, eviction rate, late-payment / NSF rate, and stable-employment percentage? A property-management company in the area should have these aggregated.
- How much new for-sale + rental construction is in the pipeline within 1–3 miles? Heavy new supply typically softens prices + rents 12–24 months out; constrained supply supports both.
Investment metrics
- 1% rule
- 1.07% ✓
- Cap rate
- 8.16%
- Cash-on-cash
- 6.66%
- DSCR
- 1.30
- GRM
- 7.8
CMA / ARV
- ARV (on-the-fly)
- $156,384
- Comps found
- 3
Show comp detail 3 sales within ~0.75 mi
| Address | Dist | Beds/Ba | Sqft | Sold | Price | $/sf | Match |
|---|---|---|---|---|---|---|---|
| 1007 10th St | 0.22mi | 3/2.0 (+1) | 912 (+6%) | 2mo | $165,000 | $181 | 70 |
| 414 9th Ave | 0.20mi | 2/1.0 | 960 (+11%) | 7mo | $50,000 | $52 | 66 |
| 317 1st ST St | 0.62mi | 2/1.5 | 936 (+8%) | 18mo | $169,000 | $181 | 40 |
Match score weights: distance 35% · size 25% · config 20% · recency 20%. Top-matched comps best support the ARV.
Projected returns pro-forma
-3.0% appreciation · 3.0% rent growth · sell at horizon
- IRR
- -6.0%
- Equity multiple
- 0.78×
- Total profit
- $-4,968
- Equity at exit
- $11,779
- IRR
- 3.6%
- Equity multiple
- 1.26×
- Total profit
- $5,796
- Equity at exit
- $6,830
Cash invested: $22,120 (down + closing). Projections, not guarantees.
Landlord ↔ Tenant lean methodology
- Overall (STATE)
- 82 Strongly Landlord-Friendly
- State North Dakota
- 82 Strongly Landlord-Friendly · R+20
- County
- — inherits STATE
- City
- — inherits STATE
ZIP-level market 58249
- Active inventory
- 16
- Price-to-rent
- 7.8×
Monthly cashflow live
- Estimated rent
- $847 medium interval (Pro) →
- Mortgage (P&I)
- −$414
- Tax est. 1.5%
- −$99 /mo · $1,185/yr
- Insurance
- −$33
- HOA
- −$0
- Vacancy / Maint / Mgmt
- −$178
- Net cashflow
- $123
Break-even live
UW: 25.0% down · 7.5% · 30yr · 1.5% tax · 5.0% vac · 8.0% maint · 8.0% mgmt
Financing live
Cash to close
- Down payment
- $19,750
- Closing costs
- $2,370
- Reserves months
- —
- Total cash needed
- —
Loan-product check · same deal, 3 products live
Conventional
25% down · 7.5% · 30yr
- Down + closing
- —
- Monthly P&I
- —
- Monthly cashflow
- —
- DSCR
- —
- Eligible?
- —
Personal DTI + credit; lowest rate.
DSCR
20% down · 8.5% · 30yr
- Down + closing
- —
- Monthly P&I
- —
- Monthly cashflow
- —
- DSCR
- —
- Eligible?
- —
No personal income docs; deal must DSCR.
Hard money
10% down · 12.0% · 12mo
- Down + closing
- —
- Monthly P&I
- —
- Monthly cashflow
- —
- DSCR
- —
- Eligible?
- —
Short-term bridge; refi at stabilization.
Listing history 3 events
-
2026-04-30status Pending
-
2026-04-14historical Active Under Contract
-
2026-04-01$79,000 Active
ⓘ Source: listings_history table (triggers on properties + properties_extension) + one-shot
backfill from property_details.listing_events for pre-trigger history.
Climate risk First Street
- Flood 1/10 Low FEMA zone X (unshaded) · 0% chance over 30 yrs
- Wildfire 1/10 Low
- Heat 1/10 Low 7 d/yr ≥91°F today · 12 d/yr by 30 yrs out
- Wind 1/10 Low
- Air quality 4/10 Moderate 5 unhealthy d/yr today · 5 by 30 yrs out
Nearby sold comps map
Loading sold comps map…
Walkable amenities ~0.75 mi
Loading nearby amenities…
Taxation est. · year 1
- Rental income
- $10,158
- − Mortgage interest
- −$4,425
- − Property taxes
- −$1,185
- − Insurance
- −$395
- − Repairs & maintenance
- −$813
- − Management
- −$813
- − Depreciation
- −$2,298
- Taxable income
- $229
- Est. tax owed @ 24.0%
- −$55
- After-tax cash flow
- $1,418/yr
For passive investors: Depreciation is non-cash, so a rental often shows a tax loss while cash-flowing — sheltering income. Rental losses are passive: they offset passive income freely, and up to $25,000/yr can offset ordinary (W-2) income if you actively participate and your MAGI is under $100k (phasing out to $0 by $150k); unused losses carry forward. On sale, claimed depreciation is recaptured at up to 25%, and gains may owe capital-gains tax (a 1031 exchange can defer both). Figures are a year-1 estimate at your 24.0% rate — not tax advice; consult a CPA.
Condition & rehab AI · 13 photos
This single-family home is in good condition with a good condition score of 75. It has a cosmetic rehab level and requires minimal repairs and maintenance. The highest-ROI updates would be painting the exterior, replacing the carpet in the bedrooms, and installing modern lighting fixtures.
Value-add opportunities
- Both Paint exterior — Enhances curb appeal and value
- Both Replace carpet in bedrooms — Improves aesthetics and comfort
- Both Install modern lighting fixtures — Enhances curb appeal and interior ambiance
Renovation cost estimate screening
Value-add ROI direction
- Both Paint exterior — Enhances curb appeal and value ↑
- Both Replace carpet in bedrooms — Improves aesthetics and comfort ↑
- Both Install modern lighting fixtures — Enhances curb appeal and interior ambiance ↑
ⓘ Cost ranges are severity-bucket heuristics (US national rule-of-thumb). Get contractor quotes + a written scope before underwriting a rehab budget.
Schools (NCES district)
- District
- Langdon Area 23
- NCES district ID
- 3810810
- Math proficiency
- 38% ▲ 1.00%
- Reading proficiency
- 51% ▲ 8.00%
- Median HH income
- $57,184
- Composite
- 41.13/100
- National rank
- #7427
- State rank
- #83 of 169 in ND
Livability — Langdon
- Score
- 72/100
- State rank
- #42
- US rank
- #5786
Category grades
Schools grade is shown separately in the Schools card above.
Census & demographics
- Census place
- Langdon, ND
- Population (ZIP)
- 2,363
Population outlook (Cavalier County) Hauer SSP2
- Today (2025)
- 3,638 people
- By 2030
- 3,566 · -2.0%
- By 2040
- 3,500 · -3.8%
- By 2050
- 3,532 · -2.9%
- By 2075
- 3,954 · +8.7%
- By 2100
- 4,178 · +14.8%
Race, ethnicity, and origin ACS 2023
- Neighborhood character
- Predominantly White (93%)
- Race & ethnicity
- White 93% Hispanic / Latino 3% Native American 1% Two or more races 1%
- Common ancestry
- Portuguese 18% Lithuanian 4% Italian 2%
- Foreign-born
- 0%
- Languages at home
- 97% English-only · Spanish 2%
Political lean MEDSL · Cavalier
- 2024 margin
- Solid R (+49.1) · D 24.8% · R 73.9% · Other 1.3%
- 2008→2024 swing
- -39.8pp toward R · 2008: -9.3pp · 2024: -49.1pp
- All cycles
- 2024: R+49.1 2020: R+50.7 2016: R+44.7 2012: R+18.2 2008: R+9.3
Not yet ingested
- Civics
- —
Market trends
- HPI YoY
- ▼ -81.91%
- Current HPI
- 116.1776
- Rent YoY
- —
- Metro
- —
- State GDP YoY
- ▲ 2.09%
- F500 in state
- 2
Industry mix (Fortune 500 HQ in ND)
| Industry | F500 HQs | Revenue |
|---|---|---|
| Utilities / Construction | 1 | $6B |
|
||
Price history
3 events — show timeline
- 2026-04-30 Pending — GFAAR
- 2026-04-14 Contingent — GFAAR
- 2026-04-01 Listed $79,000 GFAAR
Cash-flow waterfall
monthlySold comps — $/sqft
last 12 mo · ≤1 miLoading sold comps…