 Triplex
1202 Bowman Loop · Bowman, TN
Flood risk 1/10 · Minimal
- FEMA flood zone
- X (unshaded)
- Chance of flooding over 30 yrs
- 0.0%
- Est. flood insurance / yr
- $473 – $860
Fire risk 6/10 · Moderate
- Est. fire insurance / yr
- $949 – $1,763
Heat risk 3/10 · Minor
- Hot days now (above 98°F)
- 7 days/yr
- Hot days in 30 yrs
- 20 days/yr
Wind risk 3/10 · Minor
- Chance of severe wind over 30 yrs
- 8.0%
Air-quality risk 2/10 · Minimal
- Unhealthy air days now
- 1 days/yr
- Unhealthy air days in 30 yrs
- 1 days/yr
Risk factors via First Street. Map © Google.
Why this score? — see what drove the B grade
The composite is a weighted blend of 9 inputs, each scored 0–100. Each bar is that input's sub-score; the figure is the points it added to the 100-point composite (weight × sub-score).
- Cash flow +29.2/30.0
- DSCR +10.0/10.0
- Appreciation +10.0/10.0
- ARV discount +7.5/15.0
- 1% rule +6.9/10.0
- Livability +3.4/5.0
- Schools +2.6/10.0
- Rent growth +2.5/5.0
- Condition / age +2.5/5.0
$351,900
🖨 Deal sheet 📄 Offer letter ✓ Due diligence
Multi-family units
County records classify this as Multi-Family (2-4 Unit). Listing-text estimate: 3 units. confirmed
Listing remarks
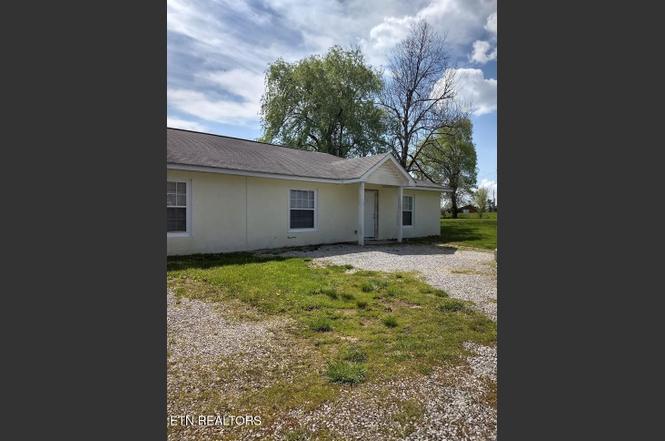
Great Investment Opportunity! Well-maintained triplex featuring 3 units, each offering 2 bedrooms and 1 bath. Units include eat-in kitchens and comfortable living space. Property is situated in a private setting and offers excellent income potential for investors or those looking to live in one unit while renting the others. Solid rental opportunity with strong long-term potential! Offers approximately 1 acre (to be surveyed and divided from a larger tract at closing).
Key facts
- Income potential
- Eat-in kitchens
- Triplex
Tags
Property features AI
Finance
- Financial info: Owner pays lawn maintenance and taxes; Total of 3 rental units (multifamily)
Exterior
- Parking: On-premise parking
- Utilities: Water, sewer, and power details per local connections (standard utilities implied)
- Home design: Triplex (3-unit multifamily building)
- Construction: Stucco and block construction; Building area approximately 3,024 (per tax records)
- Exterior features: Lot dimensions approx. 359 x 398 x 213 x 326
Interior
- Kitchen: Dishwasher; Refrigerator; Self-cleaning oven
- Bedrooms: Three 2-bedroom units (all unfurnished)
- Flooring: Laminate; Carpet
- Heating & cooling: Heat pump; Natural gas heating; Electric heating; Central cooling; Ceiling fans
- Interior features: Dishwasher; Refrigerator; Self-cleaning oven
Neighborhood map
What this means for you Summary
Snapshot
- This is a 3 × 2-bed/1.0-bath units multifamily listed at $352k.
Deal economics
- At list price, monthly cash flow is $1k ($15k/yr) — positive. Per door: $410/mo.
- The deal already cash-flows at list — no discount required.
- Meets the 1% rule at list price ($4k rent vs $352k).
- Recommended offer: $320k (9.0% below list) — sets the bar for market timing.
Location & tenants
- Location reads 67/100 on livability (#103 in TN) — a middle-class / working-renter tenant base. Strengths: cost of living A+, housing A+; Watch: health & safety C-, schools F, crime D-.
- Cumberland County (rural): math 30% / reading 31% proficiency, ranked #59 of 139 in TN (top 42%) — families likely to look elsewhere, expect single-tenant / working-renter base with shorter leases.
- Market conditions: 216 active listings in the ZIP; 114 units permitted in Cumberland County in 2024 (0 in 5+ unit buildings).
Forward outlook
- In year one you build about $38k of equity ($2k loan paydown + $35k appreciation (10.0% local appreciation)).
- Cumberland County population projected at +7% by 2050 — modest demand growth; plan on rents tracking national, not racing it.
- At projected returns (10.0% appreciation + 3.0% rent growth), your $99k cash investment doubles in ~2 years — after that, you're playing with house money.
- By year 2, paydown + projected appreciation supports a ~$60k cash-out refi (75% LTV) — recoverable capital for the next deal without selling this one.
Negotiation context
- It's been on market 101 days — a 9% lower offer ($320k) is reasonable based on typical stale-listing flexibility.
- 4 sale attempts since 2y ago with the ask held roughly flat each time — persistent listings suggest the price (not the market) is what's stuck; bring a comps-based counter.
Risks & watch-outs
- Climate carrying-cost: major wildfire risk — expect insurance premiums to compound above CPI over the hold.
Questions for the listing agent
- It's been on market 101 days. Have you received any prior offers? Is the seller open to a 9% concession, seller financing, or rate buy-down credit?
- Can we see the unit-by-unit rent roll, current vacancy, and any below-market leases? What's the average tenancy length?
- What capital expenditures (roof, boiler, parking lot, exteriors) have been made in the last 5 years, and what's planned in the next 2?
- Why hasn't it sold? Are there any deal-killer items the seller is aware of (foundation, flood, title, zoning, code violations)?
- Is there a deadline driving the sale (1031 exchange, divorce, estate, relocation)? That informs how much negotiation room exists.
- Schools are F-rated, which usually means shorter tenancies and higher turnover. Who's the typical renter profile here, and what's been the actual vacancy rate?
- Crime grade is D in this area — have there been break-ins, vandalism, or insurance claims at this property in the last 3 years? What carrier currently insures it and at what premium?
- What's the average days-on-market for RENTAL listings here right now (not sales)? A rising rental-DOM trend means longer vacancies and softer asking-rent achievability than the comps imply.
- What's the recent tenant-quality profile in this submarket — average credit score on applications, eviction rate, late-payment / NSF rate, and stable-employment percentage? A property-management company in the area should have these aggregated.
- How much new apartment / multifamily construction is in the pipeline within 1–3 miles? Heavy new supply (>2% of stock underway) typically softens rents 12–24 months out; light construction supports rent growth.
Investment metrics
- 1% rule
- 1.19% ✓
- Cap rate
- 10.48%
- Cash-on-cash
- 14.97%
- DSCR
- 1.67
- GRM
- 7.0
CMA / ARV
No comps found within radius.
Projected returns pro-forma
10.0% appreciation · 3.0% rent growth · sell at horizon
- IRR
- 35.3%
- Equity multiple
- 3.74×
- Total profit
- $269,775
- Equity at exit
- $317,019
- IRR
- 30.4%
- Equity multiple
- 8.44×
- Total profit
- $732,601
- Equity at exit
- $683,664
Cash invested: $98,532 (down + closing). Projections, not guarantees.
Landlord ↔ Tenant lean methodology
- Overall (STATE)
- 87 Strongly Landlord-Friendly
- State Tennessee
- 87 Strongly Landlord-Friendly · R+13
- County
- — inherits STATE
- City
- — inherits STATE
ZIP-level market 38571
- Home prices YoY
- 6.7%
- Active inventory
- 216
- Price-to-rent
- 20.9×
Monthly cashflow live
- Estimated rent
- $4,200 medium interval (Pro) →
- Mortgage (P&I)
- −$1,845
- Tax from tax record
- −$97 /mo · $1,165/yr
- Insurance
- −$147
- HOA
- −$0
- Vacancy / Maint / Mgmt
- −$882
- Net cashflow
- $1,229
Break-even live
3-unit breakdown (identical units grouped — click to expand)
| Units | Beds | Baths | Est. rent |
|---|---|---|---|
| 3× units | 2 | 1 | $4,200 |
| #1 | 2 | 1 | $1,400 |
| #2 | 2 | 1 | $1,400 |
| #3 | 2 | 1 | $1,400 |
| Total (3 units) | $4,200 | ||
UW: 25.0% down · 7.5% · 30yr · 1.5% tax · 5.0% vac · 8.0% maint · 8.0% mgmt
Financing live
Cash to close
- Down payment
- $87,975
- Closing costs
- $10,557
- Reserves months
- —
- Total cash needed
- —
Loan-product check · same deal, 3 products live
Conventional
25% down · 7.5% · 30yr
- Down + closing
- —
- Monthly P&I
- —
- Monthly cashflow
- —
- DSCR
- —
- Eligible?
- —
Personal DTI + credit; lowest rate.
DSCR
20% down · 8.5% · 30yr
- Down + closing
- —
- Monthly P&I
- —
- Monthly cashflow
- —
- DSCR
- —
- Eligible?
- —
No personal income docs; deal must DSCR.
Hard money
10% down · 12.0% · 12mo
- Down + closing
- —
- Monthly P&I
- —
- Monthly cashflow
- —
- DSCR
- —
- Eligible?
- —
Short-term bridge; refi at stabilization.
Listing history 22 events
-
2026-06-18days on market $351,900 Active 101 DOM
-
2026-06-17days on market $351,900 Active 100 DOM
-
2026-06-16days on market $351,900 Active 99 DOM
-
2026-06-15days on market $351,900 Active 98 DOM
-
2026-06-13days on market $351,900 Active 96 DOM
-
2026-06-12days on market $351,900 Active 95 DOM
-
2026-06-09days on market $351,900 Active 92 DOM
-
2026-06-08days on market $351,900 Active 91 DOM
-
2026-06-08days on market $351,900 Active 90 DOM
-
2026-06-07days on market $351,900 Active 89 DOM
-
2026-06-03days on market $351,900 Active 86 DOM
-
2026-06-02days on market $351,900 Active 85 DOM
-
2026-06-01days on market $351,900 Active 84 DOM
-
2026-05-31days on market $351,900 Active 83 DOM
-
2026-03-09$369,900 Active
-
2025-03-03historical $750
-
2025-02-14$750
-
2025-02-14historical $750
-
2025-02-14$750
-
2024-03-06historical
-
2024-02-24
-
2023-06-30historical
ⓘ Source: listings_history table (triggers on properties + properties_extension) + one-shot
backfill from property_details.listing_events for pre-trigger history.
Tax reassessment forecast TN · Resets to sale price
- Current annual tax
- $1,165 · $97/mo
- Projected year-2 tax
- $2,498 · $208/mo
- Expected delta
- +$1,333/yr (+$111/mo · 114.5%)
ⓘ Screening estimate from a state-policy table — verify with the county assessor before closing.
Climate risk First Street
- Flood 1/10 Low FEMA zone X (unshaded) · 0% chance over 30 yrs
- Wildfire 6/10 Major
- Heat 3/10 Moderate 7 d/yr ≥98°F today · 20 d/yr by 30 yrs out
- Wind 3/10 Moderate 8% chance of damaging wind over 30 yrs
- Air quality 2/10 Low 1 unhealthy d/yr today · 1 by 30 yrs out
Nearby sold comps map
Loading sold comps map…
Walkable amenities ~0.75 mi
Loading nearby amenities…
Taxation est. · year 1
- Rental income
- $50,400
- − Mortgage interest
- −$19,712
- − Property taxes
- −$1,165
- − Insurance
- −$1,760
- − Repairs & maintenance
- −$4,032
- − Management
- −$4,032
- − Depreciation
- −$10,237
- Taxable income
- $9,463
- Est. tax owed @ 24.0%
- −$2,271
- After-tax cash flow
- $12,476/yr
For passive investors: Depreciation is non-cash, so a rental often shows a tax loss while cash-flowing — sheltering income. Rental losses are passive: they offset passive income freely, and up to $25,000/yr can offset ordinary (W-2) income if you actively participate and your MAGI is under $100k (phasing out to $0 by $150k); unused losses carry forward. On sale, claimed depreciation is recaptured at up to 25%, and gains may owe capital-gains tax (a 1031 exchange can defer both). Figures are a year-1 estimate at your 24.0% rate — not tax advice; consult a CPA.
Schools (NCES district)
- District
- Cumberland County
- NCES district ID
- 4700900
- Math proficiency
- 30% ▼ -10.00%
- Reading proficiency
- 31% ▼ -7.00%
- Median HH income
- $38,510
- Composite
- 25.52/100
- National rank
- #7438
- State rank
- #59 of 139 in TN
Livability — Bowman
- Score
- 67/100
- State rank
- #103
- US rank
- #10579
Category grades
Schools grade is shown separately in the Schools card above.
Census & demographics
- Census place
- Bowman, TN
- Population (ZIP)
- 14,573
Population outlook (Cumberland County) Hauer SSP2
- Today (2025)
- 61,344 people
- By 2030
- 62,611 · +2.1%
- By 2040
- 64,547 · +5.2%
- By 2050
- 65,462 · +6.7%
- By 2075
- 66,839 · +9.0%
- By 2100
- 63,855 · +4.1%
Race, ethnicity, and origin ACS 2023
- Neighborhood character
- Predominantly White (96%)
- Race & ethnicity
- White 96% Two or more races 2% Hispanic / Latino 1%
- Common ancestry
- Serbian 3% Italian 2% Lithuanian 2%
- Foreign-born
- 1% · Canada
- Languages at home
- 97% English-only · German/W. Germanic 1% Spanish 1% Other Indo-European 1%
Political lean MEDSL · Cumberland
- 2024 margin
- Solid R (+58.9) · D 20.2% · R 79.1%
- 2008→2024 swing
- -21.8pp toward R · 2008: -37.1pp · 2024: -58.9pp
- All cycles
- 2024: R+58.9 2020: R+57.1 2016: R+57.8 2012: R+49.1 2008: R+37.1
Not yet ingested
- Civics
- —
Market trends
- HPI YoY
- ▲ 24.02%
- Current HPI
- 382.4479
- Rent YoY
- —
- Metro
- —
- State GDP YoY
- ▲ 2.78%
- F500 in state
- 22
Industry mix (Fortune 500 HQ in TN)
| Industry | F500 HQs | Revenue |
|---|---|---|
| Healthcare | 3 | $91B |
|
||
| Retail | 3 | $72B |
|
||
| Transportation / Logistics | 1 | $88B |
|
||
| Paper / Packaging | 1 | $19B |
|
||
| Insurance | 1 | $13B |
|
||
| Energy | 1 | $12B |
|
||
Price history
8 events — show timeline
- 2026-03-09 Listed $369,900 Knoxville MLS
- 2025-03-03 Rental Removed $750 BUILDIUM
- 2025-02-14 Listed for Rent $750 BUILDIUM
- 2025-02-14 Rental Removed $750 LEASESTAR
- 2025-02-14 Listed for Rent $750 LEASESTAR
- 2024-03-06 Rental Removed — BUILDIUM
- 2024-02-24 Listed for Rent — BUILDIUM
- 2023-06-30 Rental Removed — BUILDIUM
Property tax history
+2.0%/yrLatest (2025): $1,165 · +0.0% YoY. Source: county tax records.
Cash-flow waterfall
monthlySold comps — $/sqft
last 12 mo · ≤1 miLoading sold comps…