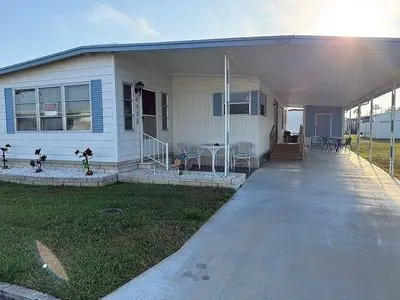
 🌊 Lakefront
2022 Oahu Dr · Holiday, FL
Flood risk 6/10 · Moderate
- FEMA flood zone
- AE
- Chance of flooding over 30 yrs
- 0.58%
- Est. flood insurance / yr
- $1,737 – $8,500
Fire risk 4/10 · Minor
- Est. fire insurance / yr
- $947 – $1,759
Heat risk 10/10 · Severe
- Hot days now (above 109°F)
- 6 days/yr
- Hot days in 30 yrs
- 23 days/yr
Wind risk 10/10 · Severe
- Chance of severe wind over 30 yrs
- 99.0%
Air-quality risk 2/10 · Minimal
- Unhealthy air days now
- 1 days/yr
- Unhealthy air days in 30 yrs
- 1 days/yr
Risk factors via First Street. Map © Google.
Why this score? — see what drove the B+ grade
The composite is a weighted blend of 9 inputs, each scored 0–100. Each bar is that input's sub-score; the figure is the points it added to the 100-point composite (weight × sub-score).
- Cash flow +30.0/30.0
- ARV discount +15.0/15.0
- 1% rule +10.0/10.0
- DSCR +10.0/10.0
- Schools +4.3/10.0
- Livability +3.3/5.0
- Rent growth +3.0/5.0
- Condition / age +2.5/5.0
- Appreciation +0.0/10.0
$85,000
🖨 Deal sheet (PDF) 📄 Offer letter ✓ Due diligence
Listing remarks
Priced to Sell & acirc; & euro; & ldquo; you won & acirc; & euro; & trade; t find a better value in the sought after community of Lake Conley, a large Mobile Home Park in the city of Holiday Florida of Pasco County! This is a Gated 55+ Community with MULTIPLE amenities and a very low community fee. * * No lot Rent here so you own the land * * The Amenities include: Community Boat Ramp, Fishing Pier, Clubhouse with numerous activities and opportunities, heated Pool, Shuffleboard Court, Horseshoe Court, Lakefront Dock to sit and enjoy sunset, RV/Boat Parking and much more! This double wide mobile home is 1,148 sqft and bright with a lot of natural light all through
Key facts
- Built 1979
Neighborhood map
What this means for you Summary
Snapshot
- This is a 2-bed/2.0-bath manufactured listed at $85k.
Deal economics
- At list price, monthly cash flow is $221 ($3k/yr) — positive.
- The deal already cash-flows at list — no discount required.
- Meets the 1% rule at list price ($2k rent vs $85k).
- Cap rate 15.4% vs local median 4.6% in Holiday — top-decile yield for the area; either an underpriced asset or a hidden risk that comps aren't pricing in. Stress-test before assuming the spread holds.
Location & tenants
- Location reads 66/100 on livability (#623 in FL) — a middle-class / working-renter tenant base. Strengths: cost of living A+, housing A+, health & safety B; Watch: crime D+, schools D, amenities F.
- Pasco (suburban): math 50% / reading 52% proficiency, ranked #32 of 73 in FL (top 44%) — acceptable for families but not a draw, mixed tenant base, ~2y average lease.
- Market conditions: Rents rising (+2.0%/yr); 328 active listings in the ZIP; 40 comparable units currently listed for rent nearby; rentals at typical pace (median 26d on market — plan ~3-4 weeks tenant-placement turnaround); 6,765 units permitted in Pasco County in 2024 (1,250 in 5+ unit buildings).
- This rent runs 38% of the median local income ($50k/yr) — at the standard rent-burdened threshold; future hikes will face affordability resistance.
Forward outlook
- Local home prices are declining (-3.0%/yr); year-one equity from $588 of loan paydown is wiped out by about $3k of value loss. Plan a longer hold.
- Pasco County population projected at +29% by 2050 — long-run rental-demand tailwind backs the buy-and-hold thesis.
Negotiation context
- Only 0 days on market — expect competitive offers; lowballing is unlikely to land.
- Current owner paid $43k; list at $85k implies a 98% gain — meaningful room to come down on a strong offer.
Risks & watch-outs
- Watch-outs: flood insurance adds $427/mo.
- Climate carrying-cost: in FEMA flood zone AE (mandatory federal flood insurance); severe wind risk, 99% chance of damaging wind over 30y; extreme-heat days projected 6→23/yr by 2055 (HVAC capex compounding) — expect insurance premiums to compound above CPI over the hold.
Questions for the listing agent
- Built in 1979 — when were the roof, HVAC, electrical panel, plumbing, and water heater last replaced?
- What's the actual annual flood-insurance premium (NFIP or private), and is the property in a SFHA with mandatory coverage?
- Is there a deadline driving the sale (1031 exchange, divorce, estate, relocation)? That informs how much negotiation room exists.
- Schools are D-rated, which usually means shorter tenancies and higher turnover. Who's the typical renter profile here, and what's been the actual vacancy rate?
- Crime grade is D in this area — have there been break-ins, vandalism, or insurance claims at this property in the last 3 years? What carrier currently insures it and at what premium?
- This sits on a lake — are riparian / water-frontage rights deeded with the parcel? Any dock permits, shoreline easements, or HOA water-use restrictions?
- What's the documented flood / surge / shoreline-erosion history here (FEMA AND non-FEMA — e.g., storm surge, creek backup, septic-field saturation)?
- Any water-quality or seasonal algae-bloom issues that affect tenant satisfaction or short-term-rental demand?
- What's the average days-on-market for RENTAL listings here right now (not sales)? A rising rental-DOM trend means longer vacancies and softer asking-rent achievability than the comps imply.
- What's the recent tenant-quality profile in this submarket — average credit score on applications, eviction rate, late-payment / NSF rate, and stable-employment percentage? A property-management company in the area should have these aggregated.
- How much new for-sale + rental construction is in the pipeline within 1–3 miles? Heavy new supply typically softens prices + rents 12–24 months out; constrained supply supports both.
Investment metrics
- 1% rule
- 1.89% ✓
- Cap rate
- 15.43%
- Cash-on-cash
- 32.63%
- DSCR
- 2.45
- GRM
- 4.4
CMA / ARV
- ARV (on-the-fly)
- $155,131
- Comps found
- 12
Show comp detail 12 sales within ~0.75 mi
| Address | Dist | Beds/Ba | Sqft | Sold | Price | $/sf | Match |
|---|---|---|---|---|---|---|---|
| 3852 Bywater Dr | 0.04mi | 2/2.0 | 968 (-4%) | 2mo | $170,000 | $176 | 90 |
| 2013 Wailua Dr | 0.06mi | 2/2.0 | 960 (-5%) | 1mo | $113,000 | $118 | 88 |
| 2101 Maui Dr | 0.13mi | 2/2.0 | 960 (-5%) | 0mo | $135,000 | $141 | 86 |
| 2033 Maui Dr | 0.12mi | 2/2.0 | 1,056 (+5%) | 1mo | $120,000 | $114 | 86 |
| 2032 Waterview Dr | 0.17mi | 2/2.0 | 1,056 (+5%) | 1mo | $165,400 | $157 | 83 |
| 1934 Shady Cv | 0.25mi | 2/2.0 | 1,108 (+10%) | 2mo | $90,000 | $81 | 71 |
| 2100 Manoa Dr | 0.07mi | 2/2.0 | 864 (-14%) | 5mo | $100,000 | $116 | 69 |
| 2125 Kepner Dr | 0.37mi | 2/2.0 | 934 (-7%) | 3mo | $80,000 | $86 | 68 |
| 2119 Lullaby Dr | 0.29mi | 2/2.0 | 877 (-13%) | 2mo | $50,000 | $57 | 63 |
| 3544 Tiki Dr | 0.72mi | 2/2.0 | 1,008 (0%) | 4mo | $110,000 | $109 | 63 |
| 2107 Melody Dr | 0.41mi | 2/2.0 | 890 (-12%) | 2mo | $70,000 | $79 | 60 |
| 2011 Melody Dr | 0.40mi | 2/1.5 | 1,116 (+11%) | 6mo | $75,000 | $67 | 57 |
Match score weights: distance 35% · size 25% · config 20% · recency 20%. Top-matched comps best support the ARV.
Projected returns pro-forma
-3.0% appreciation · 2.05% rent growth · sell at horizon
- IRR
- -1.1%
- Equity multiple
- 0.96×
- Total profit
- $-937
- Equity at exit
- $12,674
- IRR
- 7.3%
- Equity multiple
- 1.52×
- Total profit
- $12,399
- Equity at exit
- $7,349
Cash invested: $23,800 (down + closing). Projections, not guarantees.
Landlord ↔ Tenant lean methodology
- Overall (STATE)
- 87 Strongly Landlord-Friendly
- State Florida
- 87 Strongly Landlord-Friendly · R+3
- County
- — inherits STATE
- City
- — inherits STATE
ZIP-level market 34691
- Home prices YoY
- -23.9%
- Rents YoY
- 2.0%
- Active inventory
- 328
- Price-to-rent
- 4.4×
Monthly cashflow live
- Estimated rent
- $1,608 high interval (Pro) →
- Mortgage (P&I)
- −$446
- Tax from tax record
- −$142 /mo · $1,704/yr
- Insurance
- −$35
- Flood insurance flood zone
- −$427 /mo · $5,118/yr
- HOA
- −$0
- Vacancy / Maint / Mgmt
- −$338
- Net cashflow
- $221
Break-even live
Sensitivity live
| Price | -10% $269 | -5% $245 | +0% $221 | +5% $197 | +10% $172 |
|---|---|---|---|---|---|
| Rent | -10% $94 | -5% $157 | +0% $221 | +5% $284 | +10% $348 |
| Rate | -1.0pp $263 | -0.5pp $242 | base $221 | +0.5pp $199 | +1.0pp $176 |
UW: 25.0% down · 7.5% · 30yr · 1.5% tax · 5.0% vac · 8.0% maint · 8.0% mgmt
Financing live
Cash to close
- Down payment
- $21,250
- Closing costs
- $2,550
- Reserves months
- —
- Total cash needed
- —
Loan-product check · same deal, 3 products live
Conventional
25% down · 7.5% · 30yr
- Down + closing
- —
- Monthly P&I
- —
- Monthly cashflow
- —
- DSCR
- —
- Eligible?
- —
Personal DTI + credit; lowest rate.
DSCR
20% down · 8.5% · 30yr
- Down + closing
- —
- Monthly P&I
- —
- Monthly cashflow
- —
- DSCR
- —
- Eligible?
- —
No personal income docs; deal must DSCR.
Hard money
10% down · 12.0% · 12mo
- Down + closing
- —
- Monthly P&I
- —
- Monthly cashflow
- —
- DSCR
- —
- Eligible?
- —
Short-term bridge; refi at stabilization.
Rent comps 40 comps
| Address | Beds | Baths | Sqft | Rent | $/sqft | DOM | Units | Dist |
|---|---|---|---|---|---|---|---|---|
| 2051 Pleasure Dr Holiday, FL | 2.0 | 1.0 | 720 | $1,200 | $1.67 | 25d | 1 | 0.26mi |
| 3711 Redwood Dr Holiday, FL | 3.0 | 2.0 | 1368 | $1,795 | $1.31 | 0d | 1 | 0.30mi |
| 3749 Beechwood Dr Holiday, FL | 2.0 | 1.0 | 1012 | $1,623 | $1.60 | 0d | 1 | 0.30mi |
| 3521 Allandale Dr Holiday, FL | 2.0 | 2.0 | 1368 | $1,800 | $1.32 | 25d | 1 | 0.38mi |
| 4334 Tahitian Gardens Cir Unit C Holiday, FL | 2.0 | 1.0 | 768 | $1,450 | $1.89 | 25d | 1 | 0.39mi |
| 2132 Kepner Dr Holiday, FL | 2.0 | 1.0 | 920 | $1,295 | $1.41 | 21d | 1 | 0.42mi |
| 4337 Tahitian Gardens Cir Unit F Holiday, FL | 2.0 | 1.0 | 768 | $1,500 | $1.95 | 25d | 1 | 0.43mi |
| 4326 Tahitian Gardens Cir Unit 14E Holiday, FL | 2.0 | 1.5 | 768 | $2,000 | $2.60 | 25d | 1 | 0.48mi |
| 3405 Wilson Dr Holiday, FL | 2.0 | 1.0 | 861 | $1,650 | $1.92 | 25d | 1 | 0.48mi |
| 3742 Darlington Rd Holiday, FL | 2.0 | 1.5 | 936 | $1,800 | $1.92 | 25d | 1 | 0.48mi |
| 3446 Cincinnati Dr Holiday, FL | 3.0 | 2.0 | 1216 | $1,906 | $1.57 | 6d | 1 | 0.50mi |
| 3513 Trask Dr Holiday, FL | 2.0 | 1.5 | 1000 | $1,249 | $1.25 | 25d | 1 | 0.52mi |
| 4351 Tahitian Gardens Cir Holiday, FL | 2.0 | 1.0 | 825 | $1,150 | $1.39 | 25d | 1 | 0.53mi |
| 1624 Springdale Dr Holiday, FL | 2.0 | 1.0 | 1000 | $1,575 | $1.57 | 6d | 1 | 0.55mi |
| 3536 Darlington Rd Holiday, FL | 3.0 | 2.0 | 1400 | $1,950 | $1.39 | 25d | 1 | 0.57mi |
| 4354 Tahitian Gardens Cir Unit F Holiday, FL | 2.0 | 1.0 | 825 | $1,500 | $1.82 | 25d | 1 | 0.60mi |
| 4313 Tahitian Gardens Cir Unit C Holiday, FL | 2.0 | 1.5 | 825 | $1,300 | $1.58 | 16d | 1 | 0.60mi |
| 4365 Tahitian Gardens Cir Unit C Holiday, FL | 2.0 | 1.0 | 825 | $1,300 | $1.58 | 0d | 1 | 0.61mi |
| 4356 Tahitian Gardens Cir Unit C Holiday, FL | 2.0 | 1.0 | 825 | $1,350 | $1.64 | 25d | 1 | 0.63mi |
| 3433 Atlantis Dr Holiday, FL | 2.0 | 1.0 | 1024 | $1,500 | $1.46 | 25d | 1 | 0.67mi |
| 2117 Calusa Trl Holiday, FL | 2.0 | 1.0 | 1205 | $1,600 | $1.33 | 6d | 1 | 0.72mi |
| 2117 Calusa Trl Unit B Holiday, FL | 1.0 | 1.0 | 708 | $1,200 | $1.69 | 6d | 1 | 0.72mi |
| 3143 Pinon Dr Holiday, FL | 2.0 | 2.0 | 1034 | $1,695 | $1.64 | 23d | 1 | 0.77mi |
| 3623 Holiday Lake Dr Holiday, FL | 3.0 | 1.0 | 1004 | $1,525 | $1.52 | 25d | 1 | 0.80mi |
| 4205 Jordana Way Holiday, FL | 1.0–3.0 | 1.0–2.0 | 1027 | $1,404 | $1.37 | 3d | 13 | 0.87mi |
| 3531 Rosewater Dr Holiday, FL | 2.0 | 2.0 | 907 | $1,795 | $1.98 | 25d | 1 | 0.87mi |
| 3838 Staysail Ln Unit 3838 Holiday, FL | 2.0 | 1.0 | 1114 | $1,500 | $1.35 | 25d | 1 | 0.88mi |
| 3530 Oxford Dr Holiday, FL | 2.0 | 1.5 | 1080 | $1,495 | $1.38 | 23d | 1 | 0.93mi |
| 3052 Salton St Holiday, FL | 2.0 | 2.0 | 1067 | $1,600 | $1.50 | 25d | 1 | 0.95mi |
| 4348 Plaza Dr Holiday, FL | 1.0–2.0 | 1.0–2.0 | 860 | $1,499 | $1.74 | 0d | 7 | 0.95mi |
| 4620 Tropical Ln Holiday, FL | 2.0 | 1.0 | 1276 | $1,650 | $1.29 | 3d | 1 | 0.97mi |
| 1440 Brixton Ln Holiday, FL | 2.0 | 1.0 | 952 | $1,707 | $1.79 | 25d | 1 | 0.97mi |
| 1132 Maybury Dr Holiday, FL | 3.0 | 2.0 | 1173 | $1,838 | $1.57 | 3d | 1 | 1.00mi |
| 1351 Whitehall Ln Holiday, FL | 2.0 | 1.0 | 1078 | $1,550 | $1.44 | 25d | 1 | 1.00mi |
| 4823 Longwood Ave Holiday, FL | 3.0 | 1.0 | 1122 | $1,800 | $1.60 | 6d | 1 | 1.01mi |
| 1552 Alert St Holiday, FL | 3.0 | 1.0 | 956 | $2,100 | $2.20 | 6d | 1 | 1.02mi |
| 1051 Maybury Dr Holiday, FL | 3.0 | 2.0 | 1021 | $1,695 | $1.66 | 23d | 1 | 1.07mi |
| 3104 Primrose Dr Holiday, FL | 2.0 | 2.0 | 1226 | $1,640 | $1.34 | 25d | 1 | 1.08mi |
| 4835 Blossom Dr Holiday, FL | 2.0 | 2.0 | 1174 | $1,700 | $1.45 | 25d | 1 | 1.08mi |
| 3054 Primrose Dr Holiday, FL | 2.0 | 1.0 | 976 | $1,500 | $1.54 | 6d | 1 | 1.09mi |
Listing history 2 events
-
2026-05-26$85,000
-
1994-04-13soldstatus $43,000
ⓘ Source: listings_history table (triggers on properties + properties_extension) + one-shot
backfill from property_details.listing_events for pre-trigger history.
Tax reassessment forecast FL · Resets to sale price
- Current annual tax
- $1,704 · $142/mo
- Projected year-2 tax
- $1,704 · $142/mo
- Expected delta
- $0/yr ($0/mo · -0.0%)
ⓘ Screening estimate from a state-policy table — verify with the county assessor before closing.
Climate risk First Street
- Flood 6/10 Major FEMA zone AE · 58% chance over 30 yrs
- Wildfire 4/10 Moderate
- Heat 10/10 Extreme 6 d/yr ≥109°F today · 23 d/yr by 30 yrs out
- Wind 10/10 Extreme 99% chance of damaging wind over 30 yrs
- Air quality 2/10 Low 1 unhealthy d/yr today · 1 by 30 yrs out
Nearby sold comps map
Loading sold comps map…
Walkable amenities ~0.75 mi
Loading nearby amenities…
Taxation est. · year 1
- Rental income
- $19,296
- − Mortgage interest
- −$4,761
- − Property taxes
- −$1,704
- − Insurance
- −$5,544
- − Repairs & maintenance
- −$1,544
- − Management
- −$1,544
- − Depreciation
- −$2,473
- Taxable income
- $1,727
- Est. tax owed @ 24.0%
- −$414
- After-tax cash flow
- $2,233/yr
For passive investors: Depreciation is non-cash, so a rental often shows a tax loss while cash-flowing — sheltering income. Rental losses are passive: they offset passive income freely, and up to $25,000/yr can offset ordinary (W-2) income if you actively participate and your MAGI is under $100k (phasing out to $0 by $150k); unused losses carry forward. On sale, claimed depreciation is recaptured at up to 25%, and gains may owe capital-gains tax (a 1031 exchange can defer both). Figures are a year-1 estimate at your 24.0% rate — not tax advice; consult a CPA.
Schools (NCES district)
- District
- Pasco
- NCES district ID
- 1201530
- Math proficiency
- 50% ▼ -10.00%
- Reading proficiency
- 52% ▼ -5.00%
- Median HH income
- $45,039
- Composite
- 43.14/100
- National rank
- #3074
- State rank
- #32 of 73 in FL
Livability — Holiday
- Score
- 66/100
- State rank
- #623
- US rank
- #12124
Category grades
Schools grade is shown separately in the Schools card above.
Census & demographics
- Census place
- Holiday, FL
- County
- Pasco County · 524,098 people
- City population
- 33,730
- Metro
- Tampa-St. Petersburg-Clearwater, FL
- Population (ZIP)
- 21,232
- Household income
- $50,288
- Rent vs Own
- Severe rent burden
- 1031.0
Population outlook (Pasco County) Hauer SSP2
- Today (2025)
- 570,045 people
- By 2030
- 605,844 · +6.3%
- By 2040
- 674,806 · +18.4%
- By 2050
- 736,022 · +29.1%
- By 2075
- 862,900 · +51.4%
- By 2100
- 906,364 · +59.0%
Race, ethnicity, and origin ACS 2023
- Neighborhood character
- Predominantly White (73%)
- Race & ethnicity
- White 73% Hispanic / Latino 15% Two or more races 11% Black 7% Asian 2%
- Hispanic origin (detail)
- Mexican 2% Puerto Rican 6% Cuban 2% Dominican 2%
- Common ancestry
- Romanian 3% Iranian 2% Lithuanian 2%
- Foreign-born
- 10% · Canada, Vietnam
- Languages at home
- 82% English-only · Spanish 8% Other Indo-European 5% Other Asian/Pacific 1%
Political lean MEDSL · Pasco
- 2024 margin
- Strong R (+25.2) · D 36.9% · R 62.1% · Other 1.0%
- 2008→2024 swing
- -21.6pp toward R · 2008: -3.6pp · 2024: -25.2pp
- All cycles
- 2024: R+25.2 2020: R+20.1 2016: R+21.6 2012: R+6.7 2008: R+3.6
Not yet ingested
- Civics
- —
Market trends
- HPI YoY
- ▼ -102.84%
- Current HPI
- 326.9843
- Rent YoY
- ▲ 2.05%
- Metro
- Tampa-St. Petersburg-Clearwater, FL
- State GDP YoY
- ▲ 3.28%
- F500 in state
- 36
Industry mix (Fortune 500 HQ in FL)
| Industry | F500 HQs | Revenue |
|---|---|---|
| Industrial Technology | 2 | $29B |
|
||
| Insurance | 2 | $17B |
|
||
| Retail | 1 | $60B |
|
||
| Technology Distribution | 1 | $58B |
|
||
| Homebuilding | 1 | $35B |
|
||
| Technology Manufacturing | 1 | $35B |
|
||
Price history
+97.7% since first listed2 events — show timeline
- 2026-05-26 Listed $85,000 FSBO.com
- 1994-04-13 Sold (Public Records) $43,000 Public Records
Property tax history
+6.0%/yrLatest (2025): $1,704 · +4.8% YoY. Source: county tax records.
Cash-flow waterfall
monthlySold comps — $/sqft
last 12 mo · ≤1 miLoading sold comps…