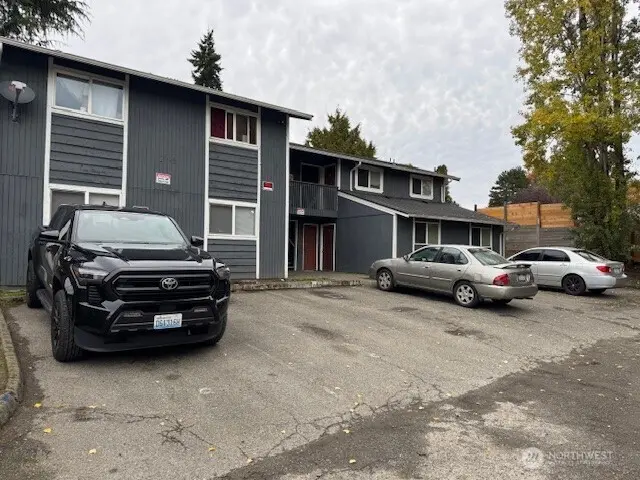
 Fourplex
2716 S 258th Pl · Kent, WA
Flood risk 1/10 · Minimal
- FEMA flood zone
- X (unshaded)
- Chance of flooding over 30 yrs
- 0.0%
- Est. flood insurance / yr
- $507 – $1,088
Fire risk 1/10 · Minimal
- Est. fire insurance / yr
- $604 – $1,122
Heat risk 3/10 · Minor
- Hot days now (above 88°F)
- 7 days/yr
- Hot days in 30 yrs
- 15 days/yr
Wind risk 1/10 · Minimal
- Chance of severe wind over 30 yrs
- —
Air-quality risk 7/10 · Major
- Unhealthy air days now
- 9 days/yr
- Unhealthy air days in 30 yrs
- 10 days/yr
Risk factors via First Street. Map © Google.
Why this score? — see what drove the F grade
The composite is a weighted blend of 9 inputs, each scored 0–100. Each bar is that input's sub-score; the figure is the points it added to the 100-point composite (weight × sub-score).
- Cash flow +10.9/30.0
- Livability +4.0/5.0
- Schools +3.9/10.0
- DSCR +3.2/10.0
- 1% rule +2.5/10.0
- Condition / age +2.5/5.0
- Rent growth +2.3/5.0
- ARV discount +1.5/15.0
- Appreciation +0.0/10.0
$925,000
🖨 Deal sheet (PDF) 📄 Offer letter ✓ Due diligence
Multi-family units
County records classify this as Multi-Family (2-4 Unit). Listing-text estimate: 4 units. confirmed
Listing remarks
FOUR UNIT 3 unit : 2Bed 1Bath 1 Unit 1bath TOTAL Fin sqft 3416. Newer roof (-5year)Coin operated Laundry, close to freeways shopping, Please do not disturb Tenants. Buyer & Agent to Verify all information. 4PLEX Managed by a professional. NO VACANCY
Key facts
- Close to freeways
- Newer roof
- Close to shopping
Tags
Neighborhood map
What this means for you Summary
Snapshot
- This is a 4 × 2-bed/1-bath units multifamily listed at $925k.
Deal economics
- At list price, monthly cash flow is $-398 ($-5k/yr) — negative. Per door: $-100/mo.
- To cash-flow at today's rent, offer at most $855k (7.6% below list).
- To meet the 1% rule (rent ≥ 1% of price), the offer needs to be $695k (24.9% below list).
- Recommended offer: $695k (24.9% below list) — sets the bar for 1% rule.
- Cap rate 5.8% vs local median 2.7% in Kent — top-decile yield for the area; either an underpriced asset or a hidden risk that comps aren't pricing in. Stress-test before assuming the spread holds.
Location & tenants
- Location reads 79/100 on livability (#109 in WA, #2,154 nationally) — a middle-class / working-renter tenant base. Strengths: amenities A+, commute A+, housing A+; Watch: schools C-, crime F, cost of living F.
- Federal Way School District (suburban): math 35% / reading 47% proficiency, ranked #207 of 291 in WA (top 71%) — families likely to look elsewhere, expect single-tenant / working-renter base with shorter leases.
- Market conditions: Rents soft (-0.7%/yr); 124 active listings in the ZIP; solid renter incomes; 10,555 units permitted in King County in 2024 (7,119 in 5+ unit buildings).
- At $6,950/mo this rent would consume 101% of the median local household income ($83k/yr) (locally 2581% of renters already pay >50% of income on rent) — very limited rent-growth headroom before tenants either downsize or default.
Forward outlook
- Local home prices are declining (-3.0%/yr); year-one equity from $6k of loan paydown is wiped out by about $28k of value loss. Plan a longer hold.
- King County population projected at +44% by 2050 — long-run rental-demand tailwind backs the buy-and-hold thesis.
Negotiation context
- It's been on market 201 days — a 12% lower offer ($814k) is reasonable based on typical stale-listing flexibility.
- 2 sale attempts with the ask held roughly flat each time — persistent listings suggest the price (not the market) is what's stuck; bring a comps-based counter.
- Current owner paid $460k; list at $925k implies a 101% gain — meaningful room to come down on a strong offer.
Questions for the listing agent
- What do current leases actually rent for vs. the listed asking? Can we see a recent rent roll and the last 12 months of T-12 income?
- It's been on market 201 days. Have you received any prior offers? Is the seller open to a 25% concession, seller financing, or rate buy-down credit?
- Can we see the unit-by-unit rent roll, current vacancy, and any below-market leases? What's the average tenancy length?
- What capital expenditures (roof, boiler, parking lot, exteriors) have been made in the last 5 years, and what's planned in the next 2?
- Built in 1977 — when were the roof, HVAC, electrical panel, plumbing, and water heater last replaced?
- Why hasn't it sold? Are there any deal-killer items the seller is aware of (foundation, flood, title, zoning, code violations)?
- Is there a deadline driving the sale (1031 exchange, divorce, estate, relocation)? That informs how much negotiation room exists.
- Crime grade is F in this area — have there been break-ins, vandalism, or insurance claims at this property in the last 3 years? What carrier currently insures it and at what premium?
- The area grade is low — what's the realistic commute time and amenity access for the typical tenant pool here? Any planned neighborhood developments (good or bad) we should know about?
- What's the average days-on-market for RENTAL listings here right now (not sales)? A rising rental-DOM trend means longer vacancies and softer asking-rent achievability than the comps imply.
- What's the recent tenant-quality profile in this submarket — average credit score on applications, eviction rate, late-payment / NSF rate, and stable-employment percentage? A property-management company in the area should have these aggregated.
- How much new apartment / multifamily construction is in the pipeline within 1–3 miles? Heavy new supply (>2% of stock underway) typically softens rents 12–24 months out; light construction supports rent growth.
Investment metrics
- 1% rule
- 0.75% ✗
- Cap rate
- 5.78%
- Cash-on-cash
- -1.84%
- DSCR
- 0.92
- GRM
- 11.1
CMA / ARV
- ARV (median comp)
- $816,324
- List price
- $925,000
- Delta
- 13.31%
- Verdict
- OVERPRICED
- Comps
- 9 within 1.0 mi
Projected returns pro-forma
-3.0% appreciation · 0.0% rent growth · sell at horizon
- IRR
- -22.5%
- Equity multiple
- 0.24×
- Total profit
- $-195,818
- Equity at exit
- $137,921
- IRR
- -25.8%
- Equity multiple
- -0.09×
- Total profit
- $-282,709
- Equity at exit
- $79,977
Cash invested: $259,000 (down + closing). Projections, not guarantees.
Landlord ↔ Tenant lean methodology
- Overall (STATE)
- 28 Tenant-Leaning
- State Washington
- 28 Tenant-Leaning · D+8
- County
- — inherits STATE
- City
- — inherits STATE
ZIP-level market 98032
- Rents YoY
- -0.7%
- Active inventory
- 124
- Price-to-rent
- 44.4×
Monthly cashflow live
- Estimated rent
- $6,950 high interval (Pro) →
- Mortgage (P&I)
- −$4,851
- Tax from tax record
- −$652 /mo · $7,829/yr
- Insurance
- −$385
- HOA
- −$0
- Vacancy / Maint / Mgmt
- −$1,460
- Net cashflow
- $-398
Break-even live
Sensitivity live
| Price | -10% $126 | -5% $-136 | +0% $-398 | +5% $-660 | +10% $-922 |
|---|---|---|---|---|---|
| Rent | -10% $-947 | -5% $-673 | +0% $-398 | +5% $-124 | +10% $151 |
| Rate | -1.0pp $68 | -0.5pp $-163 | base $-398 | +0.5pp $-638 | +1.0pp $-882 |
4-unit breakdown (identical units grouped — click to expand)
| Units | Beds | Baths | Est. rent |
|---|---|---|---|
| 4× units | 2 | 1 | $6,952 |
| #1 | 2 | 1 | $1,738 |
| #2 | 2 | 1 | $1,738 |
| #3 | 2 | 1 | $1,738 |
| #4 | 2 | 1 | $1,738 |
| Total (4 units) | $6,950 | ||
UW: 25.0% down · 7.5% · 30yr · 1.5% tax · 5.0% vac · 8.0% maint · 8.0% mgmt
Financing live
Cash to close
- Down payment
- $231,250
- Closing costs
- $27,750
- Reserves months
- —
- Total cash needed
- —
Loan-product check · same deal, 3 products live
Conventional
25% down · 7.5% · 30yr
- Down + closing
- —
- Monthly P&I
- —
- Monthly cashflow
- —
- DSCR
- —
- Eligible?
- —
Personal DTI + credit; lowest rate.
DSCR
20% down · 8.5% · 30yr
- Down + closing
- —
- Monthly P&I
- —
- Monthly cashflow
- —
- DSCR
- —
- Eligible?
- —
No personal income docs; deal must DSCR.
Hard money
10% down · 12.0% · 12mo
- Down + closing
- —
- Monthly P&I
- —
- Monthly cashflow
- —
- DSCR
- —
- Eligible?
- —
Short-term bridge; refi at stabilization.
Listing history 21 events
-
2026-06-18days on market $925,000 Active 201 DOM
-
2026-06-17days on market $925,000 Active 200 DOM
-
2026-06-16days on market $925,000 Active 199 DOM
-
2026-06-15days on market $925,000 Active 198 DOM
-
2026-06-13days on market $925,000 Active 196 DOM
-
2026-06-09days on market $925,000 Active 192 DOM
-
2026-06-08days on market $925,000 Active 191 DOM
-
2026-06-07days on market $925,000 Active 190 DOM
-
2026-06-04days on market $925,000 Active 187 DOM
-
2026-06-03pricedays on market $925,000 Active 186 DOM
-
2026-06-02days on market $939,000 Active 185 DOM
-
2026-06-01days on market $939,000 Active 184 DOM
-
2026-05-31days on market $939,000 Active 183 DOM
-
2026-04-21price $939,000
-
2025-12-15status Active
-
2025-12-15price $949,000
-
2025-12-05status Pending
-
2025-10-27$899,000 Active
-
2021-03-01soldstatus $460,000
-
1997-08-19soldstatus $149,025
-
1989-06-22soldstatus $125,000
ⓘ Source: listings_history table (triggers on properties + properties_extension) + one-shot
backfill from property_details.listing_events for pre-trigger history.
Tax reassessment forecast WA · Resets to sale price
- Current annual tax
- $7,829 · $652/mo
- Projected year-2 tax
- $9,065 · $755/mo
- Expected delta
- +$1,236/yr (+$103/mo · 15.8%)
ⓘ Screening estimate from a state-policy table — verify with the county assessor before closing.
Climate risk First Street
- Flood 1/10 Low FEMA zone X (unshaded) · 0% chance over 30 yrs
- Wildfire 1/10 Low
- Heat 3/10 Moderate 7 d/yr ≥88°F today · 15 d/yr by 30 yrs out
- Wind 1/10 Low
- Air quality 7/10 Severe 9 unhealthy d/yr today · 10 by 30 yrs out
Nearby sold comps map
Loading sold comps map…
Walkable amenities ~0.75 mi
Loading nearby amenities…
Taxation est. · year 1
- Rental income
- $83,400
- − Mortgage interest
- −$51,814
- − Property taxes
- −$7,829
- − Insurance
- −$4,625
- − Repairs & maintenance
- −$6,672
- − Management
- −$6,672
- − Depreciation
- −$26,909
- Taxable loss
- −$21,121
- Est. tax savings @ 24.0%
- +$5,069
- After-tax cash flow
- $292/yr
For passive investors: Depreciation is non-cash, so a rental often shows a tax loss while cash-flowing — sheltering income. Rental losses are passive: they offset passive income freely, and up to $25,000/yr can offset ordinary (W-2) income if you actively participate and your MAGI is under $100k (phasing out to $0 by $150k); unused losses carry forward. On sale, claimed depreciation is recaptured at up to 25%, and gains may owe capital-gains tax (a 1031 exchange can defer both). Figures are a year-1 estimate at your 24.0% rate — not tax advice; consult a CPA.
Schools (NCES district)
- District
- Federal Way School District
- NCES district ID
- 5302820
- Math proficiency
- 35% ▬ 0.00%
- Reading proficiency
- 47% ▬ 0.00%
- Median HH income
- $61,594
- Composite
- 38.79/100
- National rank
- #8361
- State rank
- #207 of 291 in WA
Livability — Kent
- Score
- 79/100
- State rank
- #109
- US rank
- #2154
Category grades
Schools grade is shown separately in the Schools card above.
Census & demographics
- Census place
- Kent, WA
- County
- King County · 2,251,916 people
- City population
- 119,479
- Metro
- Seattle-Tacoma-Bellevue, WA
- Population (ZIP)
- 40,862
- Household income
- $82,636
- Rent vs Own
- Severe rent burden
- 2581.0
Population outlook (King County) Hauer SSP2
- Today (2025)
- 2,576,485 people
- By 2030
- 2,803,316 · +8.8%
- By 2040
- 3,255,921 · +26.4%
- By 2050
- 3,706,444 · +43.9%
- By 2075
- 4,746,063 · +84.2%
- By 2100
- 5,407,730 · +109.9%
Race, ethnicity, and origin ACS 2023
- Neighborhood character
- Highly diverse neighborhood (Simpson 0.79)
- Race & ethnicity
- White 32% Hispanic / Latino 24% Asian 17% Black 16% Two or more races 12% Pacific Islander 4%
- Hispanic origin (detail)
- Mexican 18%
- Common ancestry
- Portuguese 4% Italian 4% Lithuanian 2%
- Foreign-born
- 33% · Canada, Vietnam, China
- Languages at home
- 57% English-only · Spanish 19% Other Indo-European 6% Other Asian/Pacific 4%
Political lean MEDSL · King
- 2024 margin
- Solid D (+51.7) · D 74.2% · R 22.5% · Other 3.4%
- 2008→2024 swing
- +9.6pp toward D · 2008: 42.1pp · 2024: 51.7pp
- All cycles
- 2024: D+51.7 2020: D+52.7 2016: D+50.4 2012: D+39.9 2008: D+42.1
Not yet ingested
- Civics
- —
Market trends
- HPI YoY
- ▼ -527.12%
- Current HPI
- 299.2499
- Rent YoY
- ▼ -0.68%
- Metro
- Seattle-Tacoma-Bellevue, WA
- State GDP YoY
- ▲ 4.65%
- F500 in state
- 22
Industry mix (Fortune 500 HQ in WA)
| Industry | F500 HQs | Revenue |
|---|---|---|
| Retail | 2 | $269B |
|
||
| Technology / Retail | 1 | $638B |
|
||
| Technology | 1 | $245B |
|
||
| Telecommunications | 1 | $38B |
|
||
| Food / Beverage | 1 | $36B |
|
||
| Automotive / Trucks | 1 | $34B |
|
||
Price history
+651.2% since first listed8 events — show timeline
- 2026-04-21 Price Changed $939,000 NWMLS as Distributed by MLS Grid
- 2025-12-15 Relisted — NWMLS as Distributed by MLS Grid
- 2025-12-15 Price Changed $949,000 NWMLS as Distributed by MLS Grid
- 2025-12-05 Pending — NWMLS as Distributed by MLS Grid
- 2025-10-27 Listed $899,000 NWMLS as Distributed by MLS Grid
- 2021-03-01 Sold (Public Records) $460,000 Public Records
- 1997-08-19 Sold (Public Records) $149,025 Public Records
- 1989-06-22 Sold (Public Records) $125,000 Public Records
Property tax history
+3.7%/yrLatest (2025): $7,829 · -20.7% YoY. Source: county tax records.
Cash-flow waterfall
monthlySold comps — $/sqft
last 12 mo · ≤1 miLoading sold comps…