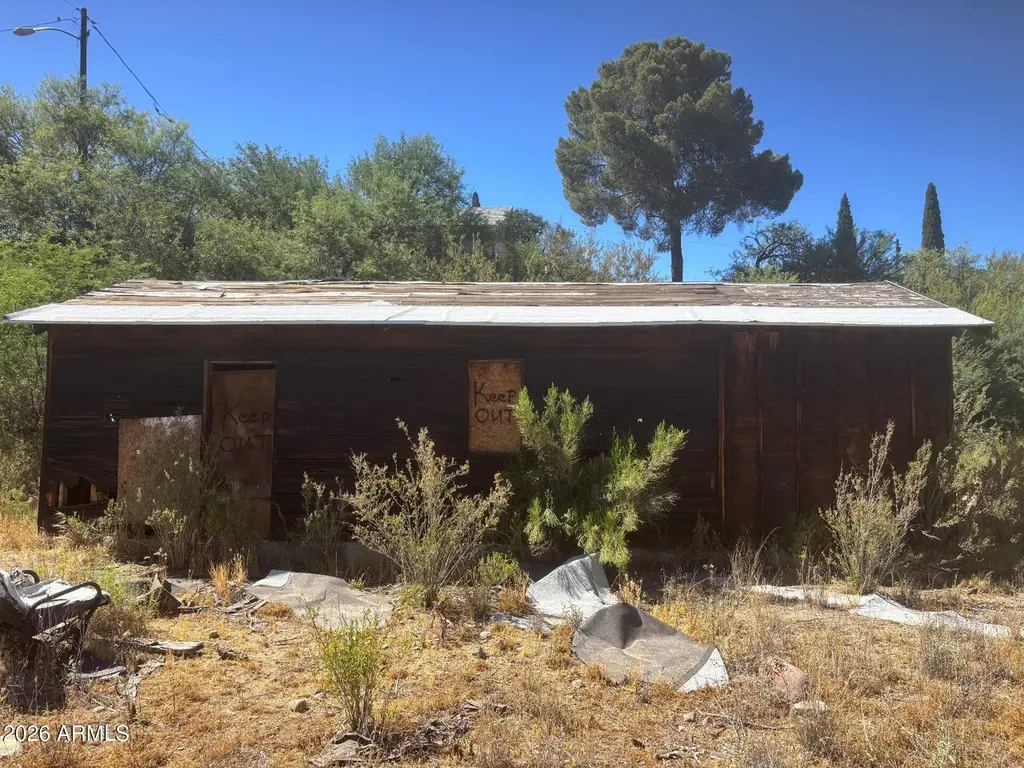
745 S Second St · Globe, AZ
Flood risk 10/10 · Severe
- FEMA flood zone
- X (unshaded)
- Chance of flooding over 30 yrs
- 0.99%
- Est. flood insurance / yr
- $507 – $1,088
Fire risk 7/10 · Major
- Est. fire insurance / yr
- $610 – $1,132
Heat risk 6/10 · Moderate
- Hot days now (above 100°F)
- 7 days/yr
- Hot days in 30 yrs
- 19 days/yr
Wind risk 1/10 · Minimal
- Chance of severe wind over 30 yrs
- —
Air-quality risk 1/10 · Minimal
- Unhealthy air days now
- 0 days/yr
- Unhealthy air days in 30 yrs
- 0 days/yr
Risk factors via First Street. Map © Google.
Why this score? — see what drove the B- grade
The composite is a weighted blend of 9 inputs, each scored 0–100. Each bar is that input's sub-score; the figure is the points it added to the 100-point composite (weight × sub-score).
- Cash flow +30.0/30.0
- 1% rule +10.0/10.0
- DSCR +10.0/10.0
- ARV discount +7.5/15.0
- Livability +3.1/5.0
- Rent growth +2.5/5.0
- Condition / age +2.5/5.0
- Schools +1.4/10.0
- Appreciation +0.0/10.0
$19,900
🖨 Deal sheet (PDF) 📄 Offer letter ✓ Due diligence
Listing remarks
Attention investors and DIY enthusiasts! Multiple exit strategies: finish this remodel then either flip, rent or move in! Home being sold as is. Cash preferred but will consider financed all offers. Seller is assisted by an Attorney in Fact. Do not knock on door or approach house without prior communication.
Key facts
- 7,405 sq ft lot
- Built 1963
- Listed 2 days
Property features AI
Finance
- Financial info: Current financing: Other; Tax annual amount: $151 (tax year 2025)
- HOA & community: Has an association; Association fee $250 annually (fee includes: No Fees)
Exterior
- Utilities: City water; Sewer: Other (see remarks); Utilities: Other (see remarks)
- Home design: Single family residence; Fee simple ownership
- Construction: Building area source: Assessor
- Exterior features: Other construction materials; Other fencing; Other roof
Interior
- Bedrooms: Possible 1 bedroom
- Bathrooms: 1 full bathroom
- Heating & cooling: Cooling present (Other); No heating
- Interior features: No built-in laundry; Has cooling (type listed as Other); No heating
- Laundry & utility: No laundry features specified
Neighborhood map
What this means for you Summary
Snapshot
- This is a 1-bed/1.0-bath single-family listed at $20k.
Deal economics
- At list price, monthly cash flow is $410 ($5k/yr) — positive.
- The deal already cash-flows at list — no discount required.
- Meets the 1% rule at list price ($792 rent vs $20k).
- Cap rate 35.0% vs local median 5.8% in Globe — top-decile yield for the area; either an underpriced asset or a hidden risk that comps aren't pricing in. Stress-test before assuming the spread holds.
Location & tenants
- Location reads 62/100 on livability (#145 in AZ) — a middle-class / working-renter tenant base. Strengths: cost of living A+, housing A+; Watch: amenities D+, health & safety D+, crime F.
- Globe Unified District (4208) (town): math 11% / reading 21% proficiency, ranked #206 of 249 in AZ (top 83%) — low school quality limits family demand, transient renter base, plan for 1-2y turnover.
- Zoned schools: Copper Rim Elementary School (math 14% / reading 22%, grade F, #796 of 1,109 statewide, top 72%, 765 students, 56% FRL); High Desert Middle School (math 9% / reading 18%, grade F, #167 of 218 statewide, top 77%, 407 students, 55% FRL); Globe High School (math 12% / reading 22%, grade F, #252 of 381 statewide, top 67%, 498 students, 46% FRL) — zoned schools at 52% FRL track the district average.
- Market conditions: 65 active listings in the ZIP; 217 units permitted in Gila County in 2024 (0 in 5+ unit buildings).
Forward outlook
- Local home prices are declining (-3.0%/yr); year-one equity from $138 of loan paydown is wiped out by about $597 of value loss. Plan a longer hold.
- Gila County population projected at -18% by 2050 — secular population decline; favor cash flow + early exit over multi-decade hold.
- At projected returns (-3.0% appreciation + 3.0% rent growth), your $6k cash investment doubles in ~2 years — after that, you're playing with house money.
Negotiation context
- Only 2 days on market — expect competitive offers; lowballing is unlikely to land.
Risks & watch-outs
- Watch-outs: flood insurance adds $66/mo.
- Climate carrying-cost: severe flood risk; major wildfire risk; extreme-heat days projected 7→19/yr by 2055 (HVAC capex compounding) — expect insurance premiums to compound above CPI over the hold.
Questions for the listing agent
- Built in 1963 — when were the roof, HVAC, electrical panel, plumbing, and water heater last replaced?
- What's the actual annual flood-insurance premium (NFIP or private), and is the property in a SFHA with mandatory coverage?
- What does the HOA fee cover, when was the last increase, and are there any pending special assessments or reserve-fund shortfalls?
- Is there a deadline driving the sale (1031 exchange, divorce, estate, relocation)? That informs how much negotiation room exists.
- Schools are F-rated, which usually means shorter tenancies and higher turnover. Who's the typical renter profile here, and what's been the actual vacancy rate?
- Crime grade is F in this area — have there been break-ins, vandalism, or insurance claims at this property in the last 3 years? What carrier currently insures it and at what premium?
- What's the average days-on-market for RENTAL listings here right now (not sales)? A rising rental-DOM trend means longer vacancies and softer asking-rent achievability than the comps imply.
- What's the recent tenant-quality profile in this submarket — average credit score on applications, eviction rate, late-payment / NSF rate, and stable-employment percentage? A property-management company in the area should have these aggregated.
- How much new for-sale + rental construction is in the pipeline within 1–3 miles? Heavy new supply typically softens prices + rents 12–24 months out; constrained supply supports both.
Investment metrics
- 1% rule
- 3.98% ✓
- Cap rate
- 35.02%
- Cash-on-cash
- 102.60%
- DSCR
- 5.57
- GRM
- 2.1
CMA / ARV
No comps found within radius.
Projected returns pro-forma
-3.0% appreciation · 3.0% rent growth · sell at horizon
- IRR
- 89.0%
- Equity multiple
- 5.12×
- Total profit
- $22,945
- Equity at exit
- $2,967
- IRR
- 92.0%
- Equity multiple
- 10.66×
- Total profit
- $53,843
- Equity at exit
- $1,721
Cash invested: $5,572 (down + closing). Projections, not guarantees.
Landlord ↔ Tenant lean methodology
- Overall (STATE)
- 87 Strongly Landlord-Friendly
- State Arizona
- 87 Strongly Landlord-Friendly · R+3
- County
- — inherits STATE
- City
- — inherits STATE
ZIP-level market 85501
- Home prices YoY
- -12.1%
- Active inventory
- 65
- Price-to-rent
- 2.1×
Monthly cashflow live
- Estimated rent
- $792 medium interval (Pro) →
- Mortgage (P&I)
- −$104
- Tax from tax record
- −$16 /mo · $187/yr
- Insurance
- −$8
- Flood insurance flood zone
- −$66 /mo · $798/yr
- HOA
- −$21
- Vacancy / Maint / Mgmt
- −$166
- Net cashflow
- $410
Break-even live
Sensitivity live
| Price | -10% $421 | -5% $416 | +0% $410 | +5% $404 | +10% $399 |
|---|---|---|---|---|---|
| Rent | -10% $347 | -5% $379 | +0% $410 | +5% $441 | +10% $473 |
| Rate | -1.0pp $420 | -0.5pp $415 | base $410 | +0.5pp $405 | +1.0pp $400 |
UW: 25.0% down · 7.5% · 30yr · 1.5% tax · 5.0% vac · 8.0% maint · 8.0% mgmt
Financing live
Cash to close
- Down payment
- $4,975
- Closing costs
- $597
- Reserves months
- —
- Total cash needed
- —
Loan-product check · same deal, 3 products live
Conventional
25% down · 7.5% · 30yr
- Down + closing
- —
- Monthly P&I
- —
- Monthly cashflow
- —
- DSCR
- —
- Eligible?
- —
Personal DTI + credit; lowest rate.
DSCR
20% down · 8.5% · 30yr
- Down + closing
- —
- Monthly P&I
- —
- Monthly cashflow
- —
- DSCR
- —
- Eligible?
- —
No personal income docs; deal must DSCR.
Hard money
10% down · 12.0% · 12mo
- Down + closing
- —
- Monthly P&I
- —
- Monthly cashflow
- —
- DSCR
- —
- Eligible?
- —
Short-term bridge; refi at stabilization.
HOA detail
- Monthly dues
- $21 · $252/yr
Listing history 3 events
-
2026-06-12statusdays on market $19,900 Pending 2 DOM
-
2026-06-09remarks 309-char remark
-
2026-06-09$19,900 Active 1 DOM
ⓘ Source: listings_history table (triggers on properties + properties_extension) + one-shot
backfill from property_details.listing_events for pre-trigger history.
Tax reassessment forecast AZ · Resets to sale price
- Current annual tax
- $187 · $16/mo
- Projected year-2 tax
- $187 · $16/mo
- Expected delta
- $0/yr ($0/mo · 0.0%)
ⓘ Screening estimate from a state-policy table — verify with the county assessor before closing.
Climate risk First Street
- Flood 10/10 Extreme FEMA zone X (unshaded) · 99% chance over 30 yrs
- Wildfire 7/10 Severe
- Heat 6/10 Major 7 d/yr ≥100°F today · 19 d/yr by 30 yrs out
- Wind 1/10 Low
- Air quality 1/10 Low 0 unhealthy d/yr today · 0 by 30 yrs out
Nearby sold comps map
Loading sold comps map…
Walkable amenities ~0.75 mi
Loading nearby amenities…
Taxation est. · year 1
- Rental income
- $9,503
- − Mortgage interest
- −$1,115
- − Property taxes
- −$187
- − Insurance
- −$897
- − Repairs & maintenance
- −$760
- − Management
- −$760
- − HOA
- −$252
- − Depreciation
- −$579
- Taxable income
- $4,953
- Est. tax owed @ 24.0%
- −$1,189
- After-tax cash flow
- $3,731/yr
For passive investors: Depreciation is non-cash, so a rental often shows a tax loss while cash-flowing — sheltering income. Rental losses are passive: they offset passive income freely, and up to $25,000/yr can offset ordinary (W-2) income if you actively participate and your MAGI is under $100k (phasing out to $0 by $150k); unused losses carry forward. On sale, claimed depreciation is recaptured at up to 25%, and gains may owe capital-gains tax (a 1031 exchange can defer both). Figures are a year-1 estimate at your 24.0% rate — not tax advice; consult a CPA.
Schools (NCES district)
- District
- Globe Unified District (4208)
- NCES district ID
- 0403500
- Math proficiency
- 11% ▼ -11.00%
- Reading proficiency
- 21% ▼ -5.00%
- Median HH income
- $42,829
- Composite
- 13.87/100
- National rank
- #9485
- State rank
- #206 of 249 in AZ
Livability — Globe
- Score
- 62/100
- State rank
- #145
- US rank
- #17153
Category grades
Schools grade is shown separately in the Schools card above.
Census & demographics
- Census place
- Globe, AZ
- Population (ZIP)
- 12,353
Population outlook (Gila County) Hauer SSP2
- Today (2025)
- 50,229 people
- By 2030
- 48,202 · -4.0%
- By 2040
- 44,101 · -12.2%
- By 2050
- 41,041 · -18.3%
- By 2075
- 37,536 · -25.3%
- By 2100
- 32,485 · -35.3%
Race, ethnicity, and origin ACS 2023
- Neighborhood character
- Diverse neighborhood (Simpson 0.58)
- Race & ethnicity
- White 54% Hispanic / Latino 36% Two or more races 16% Native American 5% Asian 2% Black 2%
- Hispanic origin (detail)
- Mexican 30%
- Common ancestry
- Slovak 2% Italian 2% Serbian 1%
- Foreign-born
- 5% · Canada
- Languages at home
- 84% English-only · Spanish 12% Tagalog/Filipino 1%
Political lean MEDSL · Gila
- 2024 margin
- Solid R (+37.6) · D 30.8% · R 68.4%
- 2008→2024 swing
- -9.8pp toward R · 2008: -27.8pp · 2024: -37.6pp
- All cycles
- 2024: R+37.6 2020: R+34.1 2016: R+32.4 2012: R+26.4 2008: R+27.8
Not yet ingested
- Civics
- —
Market trends
- HPI YoY
- ▼ -40.96%
- Current HPI
- 296.458
- Rent YoY
- —
- Metro
- —
- State GDP YoY
- ▲ 4.54%
- F500 in state
- 20
Industry mix (Fortune 500 HQ in AZ)
| Industry | F500 HQs | Revenue |
|---|---|---|
| Technology | 2 | $13B |
|
||
| Mining / Metals | 1 | $23B |
|
||
| Environmental Services | 1 | $16B |
|
||
| Metals / Steel | 1 | $14B |
|
||
| Technology Distribution | 1 | $9B |
|
||
| Homebuilding | 1 | $8B |
|
||
Price history
1 event — show timeline
- 2026-06-05 Listed $19,900 ARMLS
Property tax history
+5.2%/yrLatest (2025): $187 · +24.2% YoY. Source: county tax records.
Cash-flow waterfall
monthlySold comps — $/sqft
last 12 mo · ≤1 miLoading sold comps…