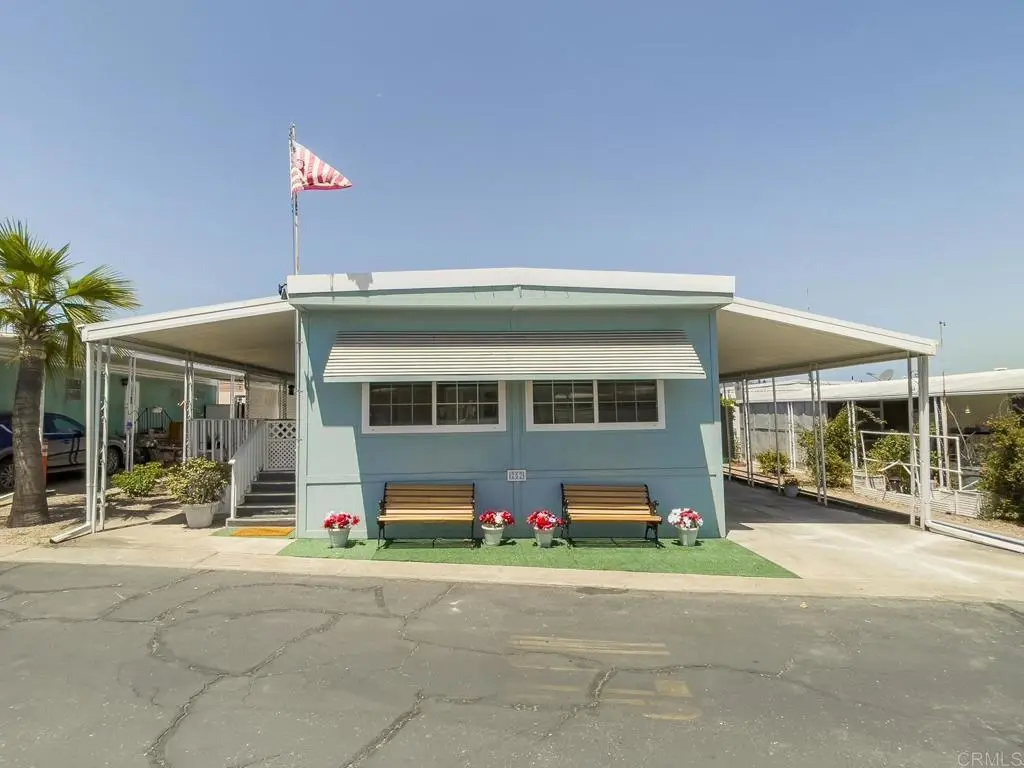
8545 Mission Gorge Rd Spc 252 · Santee, CA
Flood risk 1/10 · Minimal
- FEMA flood zone
- X (unshaded)
- Chance of flooding over 30 yrs
- 0.0%
- Est. flood insurance / yr
- $507 – $1,088
Fire risk 5/10 · Moderate
- Est. fire insurance / yr
- $659 – $1,223
Heat risk 5/10 · Moderate
- Hot days now (above 98°F)
- 5 days/yr
- Hot days in 30 yrs
- 15 days/yr
Wind risk 1/10 · Minimal
- Chance of severe wind over 30 yrs
- —
Air-quality risk 3/10 · Minor
- Unhealthy air days now
- 4 days/yr
- Unhealthy air days in 30 yrs
- 4 days/yr
Risk factors via First Street. Map © Google.
Why this score? — see what drove the B- grade
The composite is a weighted blend of 9 inputs, each scored 0–100. Each bar is that input's sub-score; the figure is the points it added to the 100-point composite (weight × sub-score).
- Cash flow +30.0/30.0
- DSCR +10.0/10.0
- 1% rule +9.3/10.0
- ARV discount +5.4/15.0
- Schools +4.5/10.0
- Livability +3.2/5.0
- Rent growth +2.7/5.0
- Condition / age +2.5/5.0
- Appreciation +0.0/10.0
$220,000
🖨 Deal sheet 📄 Offer letter ✓ Due diligence
Listing remarks
Welcome to Mission Gorge Villas, a 55+ community with an SUPER LOW SPACE RENT OF $740 MONTHLY. This 3-bedroom, 2-bath home offers a spacious layout featuring a built-in buffet in the dining room, a kitchen with a gas stove, a walk-in closet in the primary bedroom, two walk-in showers, and two solar tubes that provide natural light—one in the kitchen and one in the bathroom. Additional features include a large covered porch and patio area, storage shed, and a two-car carport. Conveniently located near Costco, Home Depot, Lowe’s, Trader Joe’s, and recreational areas such as Santee Lakes for fishing and Cowles Mountain for walking and hiking, with easy access to the I-52 and
Key facts
- Built-in buffet
- Large covered porch
- Walk-in closet
Tags
Property features AI
Finance
- Other: Park directions: Use GPS
- Financial info: Monthly land lease: $740
- HOA & community: Senior community; Manager approval required; Trash included in rent
Exterior
- Parking: 2 parking spaces; 2 carport spaces
- Utilities: Public sewer
- Home design: Manufactured/mobile home (10' x 60') remains on site; Single-story; Located in a senior community; Located in Mission Gorge Villas park
- Construction: Mobile home
- Exterior features: Indoor pool; Community pool; Street lighting; Rectangular lot shape; One shed on property
Interior
- Kitchen: Kitchen
- Bedrooms: Bedroom(s) with walk-in closet
- Bathrooms: 2 full bathrooms
- Heating & cooling: Central cooling
- Interior features: Front porch entry; One-level home; Walk-in closet; Living room
- Laundry & utility: Washer included; Dryer included; In-unit laundry
Neighborhood map
What this means for you Summary
Snapshot
- This is a 3-bed/2.0-bath manufactured listed at $220k.
Deal economics
- At list price, monthly cash flow is $958 ($11k/yr) — positive.
- The deal already cash-flows at list — no discount required.
- Meets the 1% rule at list price ($3k rent vs $220k).
- Cap rate 11.5% vs local median 2.6% in Santee — top-decile yield for the area; either an underpriced asset or a hidden risk that comps aren't pricing in. Stress-test before assuming the spread holds.
Location & tenants
- Location reads 65/100 on livability (#361 in CA) — a middle-class / working-renter tenant base. Strengths: commute A+, employment A+, crime A-; Watch: health & safety C-, amenities D, cost of living F.
- Santee (suburban): math 46% / reading 54% proficiency, ranked #130 of 517 in CA (top 25%) — acceptable for families but not a draw, mixed tenant base, ~2y average lease.
- Market conditions: Rents flat; 197 active listings in the ZIP; 13 comparable units currently listed for rent nearby; rentals leasing fast (median 2d on market — plan ~1-2 weeks tenant-placement turnaround); high-income renter base; 11,759 units permitted in San Diego County in 2024 (7,244 in 5+ unit buildings).
- This rent runs 33% of the median local income ($114k/yr) — at the standard rent-burdened threshold; future hikes will face affordability resistance.
Forward outlook
- Local home prices are declining (-3.0%/yr); year-one equity from $2k of loan paydown is wiped out by about $7k of value loss. Plan a longer hold.
- San Diego County population projected at +20% by 2050 — long-run rental-demand tailwind backs the buy-and-hold thesis.
- At projected returns (-3.0% appreciation + 0.8% rent growth), your $62k cash investment doubles in ~8 years — after that, you're playing with house money.
Negotiation context
- Only 9 days on market — expect competitive offers; lowballing is unlikely to land.
- 3 sale attempts since 17y ago with the ask held roughly flat each time — persistent listings suggest the price (not the market) is what's stuck; bring a comps-based counter.
Risks & watch-outs
- Climate carrying-cost: moderate wildfire risk; extreme-heat days projected 5→15/yr by 2055 (HVAC capex compounding) — expect insurance premiums to compound above CPI over the hold.
Questions for the listing agent
- Built in 1967 — when were the roof, HVAC, electrical panel, plumbing, and water heater last replaced?
- Is there a deadline driving the sale (1031 exchange, divorce, estate, relocation)? That informs how much negotiation room exists.
- What's the average days-on-market for RENTAL listings here right now (not sales)? A rising rental-DOM trend means longer vacancies and softer asking-rent achievability than the comps imply.
- What's the recent tenant-quality profile in this submarket — average credit score on applications, eviction rate, late-payment / NSF rate, and stable-employment percentage? A property-management company in the area should have these aggregated.
- How much new for-sale + rental construction is in the pipeline within 1–3 miles? Heavy new supply typically softens prices + rents 12–24 months out; constrained supply supports both.
Investment metrics
- 1% rule
- 1.43% ✓
- Cap rate
- 11.52%
- Cash-on-cash
- 18.66%
- DSCR
- 1.83
- GRM
- 5.8
CMA / ARV
- ARV (on-the-fly)
- $210,000
- Comps found
- 12
Show comp detail 12 sales within ~0.75 mi
| Address | Dist | Beds/Ba | Sqft | Sold | Price | $/sf | Match |
|---|---|---|---|---|---|---|---|
| 8545 Mission Gorge Rd Spc 232 | 0.00mi | 3/2.0 | 1,325 (+10%) | 3mo | $299,000 | $226 | 80 |
| 8545 Mission Gorge Rd Spc 147 | 0.16mi | 3/2.0 | 1,325 (+10%) | 2mo | $315,000 | $238 | 74 |
| 8301 Mission Gorge Rd #282 | 0.39mi | 2/2.0 (-1) | 1,248 (+4%) | 5mo | $310,000 | $248 | 66 |
| 8301 Mission Gorge Rd #86 | 0.39mi | 2/2.0 (-1) | 1,272 (+6%) | 2mo | $223,000 | $175 | 65 |
| 8545 Mission Gorge Rd Spc 141 | 0.04mi | 2/2.0 (-1) | 1,040 (-13%) | 7mo | $230,000 | $221 | 65 |
| 8301 Mission Gorge Road 301 | 0.39mi | 3/2.0 | 1,320 (+10%) | 4mo | $295,000 | $223 | 62 |
| 8301 Mission Gorge Rd #124 | 0.31mi | 2/2.0 (-1) | 1,368 (+14%) | 0mo | $100,000 | $73 | 57 |
| 8301 Mission Gorge Rd #172 | 0.39mi | 2/2.0 (-1) | 1,344 (+12%) | 3mo | $220,000 | $164 | 54 |
| 8301 Mission Gorge Rd #154 | 0.39mi | 2/2.0 (-1) | 1,344 (+12%) | 5mo | $160,000 | $119 | 52 |
| 8301 Mission Gorge Rd #286 | 0.39mi | 2/2.0 (-1) | 1,368 (+14%) | 4mo | $189,000 | $138 | 50 |
| 8301 Mission Gorge Rd #351 | 0.39mi | 2/2.0 (-1) | 1,368 (+14%) | 8mo | $240,000 | $175 | 47 |
| 8301 Mission Gorge Rd Spc 382 | 0.39mi | 2/2.0 (-1) | 1,368 (+14%) | 8mo | $225,000 | $164 | 46 |
Match score weights: distance 35% · size 25% · config 20% · recency 20%. Top-matched comps best support the ARV.
Projected returns pro-forma
-3.0% appreciation · 0.85% rent growth · sell at horizon
- IRR
- 8.0%
- Equity multiple
- 1.30×
- Total profit
- $18,766
- Equity at exit
- $32,803
- IRR
- 15.3%
- Equity multiple
- 2.12×
- Total profit
- $68,983
- Equity at exit
- $19,022
Cash invested: $61,600 (down + closing). Projections, not guarantees.
Landlord ↔ Tenant lean methodology
- Overall (STATE)
- 18 Strongly Tenant-Friendly
- State California
- 18 Strongly Tenant-Friendly · D+13
- County
- — inherits STATE
- City
- — inherits STATE
ZIP-level market 92071
- Rents YoY
- 0.8%
- Active inventory
- 197
- Price-to-rent
- 5.8×
Monthly cashflow live
- Estimated rent
- $3,137 high interval (Pro) →
- Mortgage (P&I)
- −$1,154
- Tax est. 1.5%
- −$275 /mo · $3,300/yr
- Insurance
- −$92
- HOA
- −$0
- Vacancy / Maint / Mgmt
- −$659
- Net cashflow
- $958
Break-even live
UW: 25.0% down · 7.5% · 30yr · 1.5% tax · 5.0% vac · 8.0% maint · 8.0% mgmt
Financing live
Cash to close
- Down payment
- $55,000
- Closing costs
- $6,600
- Reserves months
- —
- Total cash needed
- —
Loan-product check · same deal, 3 products live
Conventional
25% down · 7.5% · 30yr
- Down + closing
- —
- Monthly P&I
- —
- Monthly cashflow
- —
- DSCR
- —
- Eligible?
- —
Personal DTI + credit; lowest rate.
DSCR
20% down · 8.5% · 30yr
- Down + closing
- —
- Monthly P&I
- —
- Monthly cashflow
- —
- DSCR
- —
- Eligible?
- —
No personal income docs; deal must DSCR.
Hard money
10% down · 12.0% · 12mo
- Down + closing
- —
- Monthly P&I
- —
- Monthly cashflow
- —
- DSCR
- —
- Eligible?
- —
Short-term bridge; refi at stabilization.
Rent comps 13 comps
| Address | Beds | Baths | Sqft | Rent | $/sqft | DOM | Units | Dist |
|---|---|---|---|---|---|---|---|---|
| 8605 Arminda Cir Santee, CA | 2.0 | 2.0 | 958 | $2,650 | $2.77 | 1d | 1 | 0.10mi |
| 8609 Arminda Cir #13 Santee, CA | 2.0 | 2.0 | 984 | $3,000 | $3.05 | 1d | 1 | 0.12mi |
| 7962 Arly Ct #12 Santee, CA | 2.0 | 2.0 | 945 | $2,800 | $2.96 | 1d | 1 | 0.66mi |
| 8745 Redwood Dr Santee, CA | 2.0–3.0 | 1.5–2.5 | 1264 | $3,100 | $2.45 | 1d | 1 | 0.74mi |
| 177 Via Montisi Santee, CA | 2.0 | 2.5 | 1239 | $3,450 | $2.78 | 1d | 1 | 0.76mi |
| 69 Via Sovana Santee, CA | 3.0 | 3.0 | 1342 | $3,600 | $2.68 | 1d | 1 | 0.77mi |
| 8434 Kreiner Way Santee, CA | 3.0 | 2.0 | 1305 | $4,213 | $3.23 | 21d | 1 | 0.79mi |
| 8009 Calle Fanita Santee, CA | 2.0 | 1.5 | 1024 | $2,995 | $2.92 | 1d | 1 | 0.95mi |
| 8621 Willow Ter Santee, CA | 3.0 | 2.0 | 1457 | $3,600 | $2.47 | 3d | 1 | 1.25mi |
| 8617 Bushy Hill Dr Santee, CA | 2.0–3.0 | 2.0–3.0 | 1299 | $2,900 | $2.23 | 1d | 1 | 1.28mi |
| 9525 Mission Gorge Rd Santee, CA | 2.0–3.0 | 1.0–2.0 | 901 | $2,795 | $3.10 | 1d | 4 | 1.28mi |
| 9409 Lake Murray Blvd San Diego, CA | 2.0 | 2.5 | 1290 | $3,300 | $2.56 | 17d | 1 | 1.44mi |
| 9661 Carlton Hills Blvd Santee, CA | 3.0 | 2.0 | 1200 | $2,895 | $2.41 | 1d | 4 | 1.50mi |
Listing history 8 events
-
2026-06-18days on market $220,000 Active 9 DOM
-
2026-06-17days on market $220,000 Active 8 DOM
-
2026-06-16days on market $220,000 Active 7 DOM
-
2026-06-15days on market $220,000 Active 6 DOM
-
2026-06-13days on market $220,000 Active 4 DOM
-
2026-06-13days on market $220,000 Active 3 DOM
-
2026-06-10remarks 681-char remark
-
2026-06-10$220,000 Active 1 DOM
ⓘ Source: listings_history table (triggers on properties + properties_extension) + one-shot
backfill from property_details.listing_events for pre-trigger history.
Climate risk First Street
- Flood 1/10 Low FEMA zone X (unshaded) · 0% chance over 30 yrs
- Wildfire 5/10 Major
- Heat 5/10 Major 5 d/yr ≥98°F today · 15 d/yr by 30 yrs out
- Wind 1/10 Low
- Air quality 3/10 Moderate 4 unhealthy d/yr today · 4 by 30 yrs out
Nearby sold comps map
Loading sold comps map…
Walkable amenities ~0.75 mi
Loading nearby amenities…
Taxation est. · year 1
- Rental income
- $37,645
- − Mortgage interest
- −$12,323
- − Property taxes
- −$3,300
- − Insurance
- −$1,100
- − Repairs & maintenance
- −$3,012
- − Management
- −$3,012
- − Depreciation
- −$6,400
- Taxable income
- $8,499
- Est. tax owed @ 24.0%
- −$2,040
- After-tax cash flow
- $9,456/yr
For passive investors: Depreciation is non-cash, so a rental often shows a tax loss while cash-flowing — sheltering income. Rental losses are passive: they offset passive income freely, and up to $25,000/yr can offset ordinary (W-2) income if you actively participate and your MAGI is under $100k (phasing out to $0 by $150k); unused losses carry forward. On sale, claimed depreciation is recaptured at up to 25%, and gains may owe capital-gains tax (a 1031 exchange can defer both). Figures are a year-1 estimate at your 24.0% rate — not tax advice; consult a CPA.
Schools (NCES district)
- District
- Santee
- NCES district ID
- 0635880
- Math proficiency
- 46% ▼ -3.00%
- Reading proficiency
- 54% ▼ -2.00%
- Median HH income
- $73,452
- Composite
- 45.0/100
- National rank
- #2698
- State rank
- #130 of 517 in CA
Livability — Santee
- Score
- 65/100
- State rank
- #361
- US rank
- #12272
Category grades
Schools grade is shown separately in the Schools card above.
Census & demographics
- Census place
- Santee, CA
- County
- San Diego County · 3,178,799 people
- City population
- 59,590
- Metro
- San Diego-Chula Vista-Carlsbad, CA
- Population (ZIP)
- 59,590
- Household income
- $113,618
- Rent vs Own
- Severe rent burden
- 1719.0
Population outlook (San Diego County) Hauer SSP2
- Today (2025)
- 3,678,185 people
- By 2030
- 3,856,546 · +4.8%
- By 2040
- 4,171,407 · +13.4%
- By 2050
- 4,421,607 · +20.2%
- By 2075
- 4,831,599 · +31.4%
- By 2100
- 4,832,502 · +31.4%
Race, ethnicity, and origin ACS 2023
- Neighborhood character
- Majority White (63%)
- Race & ethnicity
- White 63% Hispanic / Latino 22% Two or more races 16% Asian 5% Black 2%
- Hispanic origin (detail)
- Mexican 18%
- Common ancestry
- Slovak 3% Italian 3% Lithuanian 2%
- Foreign-born
- 13% · Canada, Vietnam, China
- Languages at home
- 81% English-only · Spanish 8% Arabic 3% Other Asian/Pacific 1%
Political lean MEDSL · San Diego
- 2024 margin
- D (+16.8) · D 56.9% · R 40.1% · Other 2.9%
- 2008→2024 swing
- +6.6pp toward D · 2008: 10.2pp · 2024: 16.8pp
- All cycles
- 2024: D+16.8 2020: D+22.8 2016: D+17.8 2012: D+5.1 2008: D+10.2
Not yet ingested
- Civics
- —
Market trends
- HPI YoY
- ▼ -607.00%
- Current HPI
- 393.1781
- Rent YoY
- ▲ 0.85%
- Metro
- San Diego-Chula Vista-Carlsbad, CA
- State GDP YoY
- ▲ 3.21%
- F500 in state
- 116
Industry mix (Fortune 500 HQ in CA)
| Industry | F500 HQs | Revenue |
|---|---|---|
| Technology | 27 | $1,492B |
|
||
| Financial Services | 3 | $174B |
|
||
| Retail | 3 | $44B |
|
||
| Insurance | 3 | $26B |
|
||
| Media / Entertainment | 2 | $115B |
|
||
| Pharmaceuticals / Biotech | 2 | $62B |
|
||
Price history
+267.3% since first listed5 events — show timeline
- 2026-05-17 Listed $220,000 CRMLS
- 2010-06-30 Listing Removed — CRMLS
- 2010-06-30 Listing Removed — SDMLS
- 2009-12-29 Listed $59,900 CRMLS
- 2009-12-29 Listed $59,900 SDMLS
Cash-flow waterfall
monthlySold comps — $/sqft
last 12 mo · ≤1 miLoading sold comps…