 Multi-family
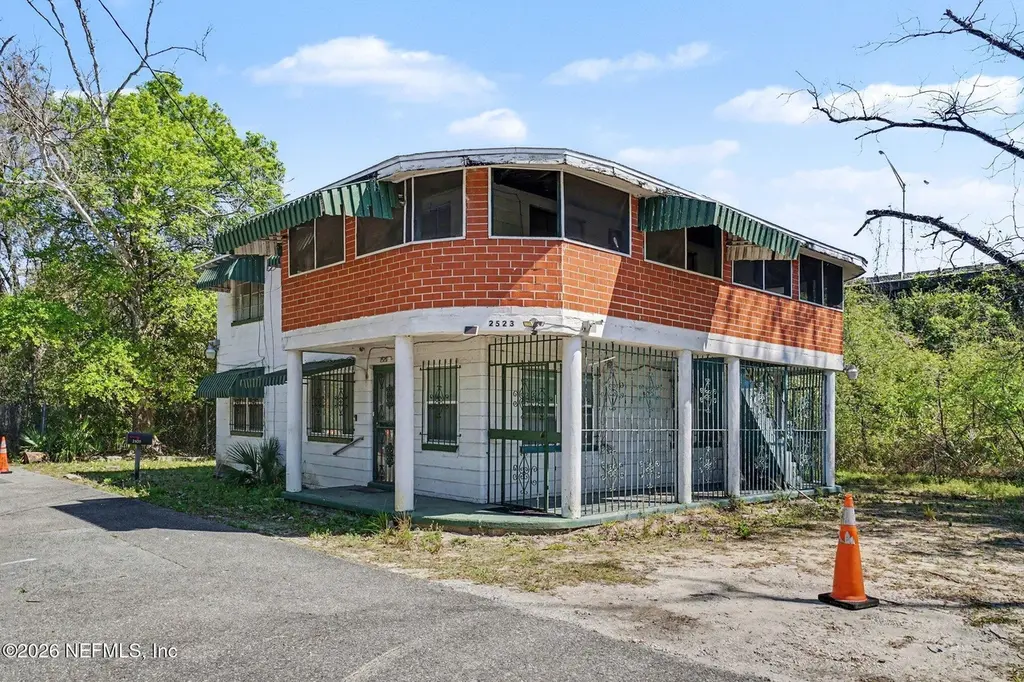
2525 Thames St · Jacksonville, FL
Flood risk 6/10 · Moderate
- FEMA flood zone
- X (unshaded)
- Chance of flooding over 30 yrs
- 0.73%
- Est. flood insurance / yr
- $507 – $1,088
Fire risk 1/10 · Minimal
- Est. fire insurance / yr
- $947 – $1,759
Heat risk 9/10 · Severe
- Hot days now (above 107°F)
- 7 days/yr
- Hot days in 30 yrs
- 18 days/yr
Wind risk 9/10 · Severe
- Chance of severe wind over 30 yrs
- 99.0%
Air-quality risk 4/10 · Minor
- Unhealthy air days now
- 6 days/yr
- Unhealthy air days in 30 yrs
- 6 days/yr
Risk factors via First Street. Map © Google.
Why this score? — see what drove the C+ grade
The composite is a weighted blend of 9 inputs, each scored 0–100. Each bar is that input's sub-score; the figure is the points it added to the 100-point composite (weight × sub-score).
- Cash flow +21.5/30.0
- ARV discount +12.8/15.0
- DSCR +6.9/10.0
- 1% rule +5.4/10.0
- Livability +4.2/5.0
- Schools +3.9/10.0
- Rent growth +3.0/5.0
- Condition / age +2.5/5.0
- Appreciation +0.0/10.0
$200,000
🖨 Deal sheet 📄 Offer letter ✓ Due diligence
Multi-family units
County records classify this as Multi-Family (5+ Unit). Listing-text estimate: 1 unit. estimate disagrees with records
5+ unit building — per-unit beds/baths from public records are typically unavailable; the breakdown below (if shown) is an estimate from the listing text.
Listing remarks
Great investment opportunity in Jacksonville! This multi-family property features approximately 1,890 square feet of living space with 4 bedrooms and 2 bathrooms, offering strong potential for rental income or multi-generational living. Built in 1959, the property sits on a 3,584 sq ft lot and includes two residential units, making it an excellent addition to an investor's portfolio. Conveniently located near major roadways, schools, and local amenities, providing easy access to downtown Jacksonville and surrounding areas. With the right vision and updates, this property has the potential to generate steady income and long-term value. Don't miss this opportunity to own a versatile property
Key facts
- 3,484 sq ft lot
- Built 1959
- Listed 84 days
Property features AI
Finance
- HOA & community: Not a senior community
Exterior
- Parking: Assigned parking
- Utilities: Public sewer; Electricity available and connected; Water available; Sewer available
- Home design: Duplex (multi-family); Two levels; Entry level: 1; Faces west; Property attached
- Construction: Block construction; Shingle roof; 1 building; 2 stories
- Exterior features: City street frontage; Paved road; Lot features: Other
Interior
- Kitchen: Electric oven; Refrigerator
- Bedrooms: 4 bedrooms
- Flooring: Carpet; Laminate
- Bathrooms: 2 full bathrooms
- Heating & cooling: No heating; No cooling
- Interior features: Balcony; Unfurnished
Neighborhood map
What this means for you Summary
Snapshot
- This is a 4-bed/2.0-bath multifamily listed at $200k.
Deal economics
- At list price, monthly cash flow is $300 ($4k/yr) — positive.
- The deal already cash-flows at list — no discount required.
- Meets the 1% rule at list price ($2k rent vs $200k).
- Recommended offer: $188k (6.0% below list) — sets the bar for market timing.
- Cap rate 8.1% vs local median 4.0% in Jacksonville — top-decile yield for the area; either an underpriced asset or a hidden risk that comps aren't pricing in. Stress-test before assuming the spread holds.
Location & tenants
- Location reads 83/100 on livability (#50 in FL, #911 nationally) — a professional / high-income tenant draw. Strengths: amenities A+, commute A+, housing A+.
- Duval (urban): math 46% / reading 45% proficiency, ranked #48 of 73 in FL (top 66%) — families likely to look elsewhere, expect single-tenant / working-renter base with shorter leases.
- Zoned schools: Matthew W. Gilbert Middle School (math 26% / reading 17%, grade F, #553 of 571 statewide, top 97%, 688 students, 86% FRL); William M. Raines High School (math 14% / reading 13%, grade F, #616 of 667 statewide, top 92%, 1,217 students, 78% FRL) — zoned schools average 82% FRL vs 49% district-wide (33 pts higher); higher-poverty schools than district average — tighter screening recommended.
- Zoned-school proficiency averages 18% at this address vs 46% district-wide (-28 pts) — the specific schools serving this property underperform the Duval average; the district grade overstates school quality for this exact location.
- Market conditions: Rents rising (+1.8%/yr); 394 active listings in the ZIP; 32 comparable units currently listed for rent nearby; rentals at typical pace (median 20d on market — plan ~3-4 weeks tenant-placement turnaround); lower-income renter base — watch delinquency; 6,503 units permitted in Duval County in 2024 (1,131 in 5+ unit buildings).
- At $2,071/mo this rent would consume 81% of the median local household income ($31k/yr) (locally 2921% of renters already pay >50% of income on rent) — very limited rent-growth headroom before tenants either downsize or default.
Forward outlook
- Local home prices are declining (-3.0%/yr); year-one equity from $1k of loan paydown is wiped out by about $6k of value loss. Plan a longer hold.
- Duval County population projected at +19% by 2050 — long-run rental-demand tailwind backs the buy-and-hold thesis.
Negotiation context
- It's been on market 84 days — a 6% lower offer ($188k) is reasonable based on typical stale-listing flexibility.
Risks & watch-outs
- Watch-outs: built in 1959 — expect roof / HVAC / electrical / plumbing capex.
- Climate carrying-cost: major flood risk; severe wind risk, 99% chance of damaging wind over 30y; extreme-heat days projected 7→18/yr by 2055 (HVAC capex compounding) — expect insurance premiums to compound above CPI over the hold.
Questions for the listing agent
- It's been on market 84 days. Have you received any prior offers? Is the seller open to a 6% concession, seller financing, or rate buy-down credit?
- Built in 1959 — when were the roof, HVAC, electrical panel, plumbing, and water heater last replaced?
- Why hasn't it sold? Are there any deal-killer items the seller is aware of (foundation, flood, title, zoning, code violations)?
- Is there a deadline driving the sale (1031 exchange, divorce, estate, relocation)? That informs how much negotiation room exists.
- Schools are B-rated — typically a magnet for longer-tenancy family renters. What's the average tenant stay here, and is there a school-zone premium baked into asking?
- What's the average days-on-market for RENTAL listings here right now (not sales)? A rising rental-DOM trend means longer vacancies and softer asking-rent achievability than the comps imply.
- What's the recent tenant-quality profile in this submarket — average credit score on applications, eviction rate, late-payment / NSF rate, and stable-employment percentage? A property-management company in the area should have these aggregated.
- How much new apartment / multifamily construction is in the pipeline within 1–3 miles? Heavy new supply (>2% of stock underway) typically softens rents 12–24 months out; light construction supports rent growth.
Investment metrics
- 1% rule
- 1.04% ✓
- Cap rate
- 8.10%
- Cash-on-cash
- 6.44%
- DSCR
- 1.29
- GRM
- 8.0
CMA / ARV
- ARV (on-the-fly)
- $226,800
- Comps found
- 3
Show comp detail 3 sales within ~0.75 mi
| Address | Dist | Beds/Ba | Sqft | Sold | Price | $/sf | Match |
|---|---|---|---|---|---|---|---|
| 429 W 18 St | 0.52mi | 5/3.0 (+1) | 1,924 (+2%) | 23mo | $230,000 | $120 | 44 |
| 3902 Stuart St | 0.67mi | 4/4.0 | 1,978 (+5%) | 15mo | $169,500 | $86 | 41 |
| 218 W 11th St | 0.73mi | 3/2.0 (-1) | 1,724 (-9%) | 10mo | $350,000 | $203 | 38 |
Match score weights: distance 35% · size 25% · config 20% · recency 20%. Top-matched comps best support the ARV.
Projected returns pro-forma
-3.0% appreciation · 1.81% rent growth · sell at horizon
- IRR
- -7.7%
- Equity multiple
- 0.72×
- Total profit
- $-15,727
- Equity at exit
- $29,821
- IRR
- 0.3%
- Equity multiple
- 1.02×
- Total profit
- $1,130
- Equity at exit
- $17,292
Cash invested: $56,000 (down + closing). Projections, not guarantees.
Landlord ↔ Tenant lean methodology
- Overall (STATE)
- 87 Strongly Landlord-Friendly
- State Florida
- 87 Strongly Landlord-Friendly · R+3
- County
- — inherits STATE
- City
- — inherits STATE
ZIP-level market 32209
- Home prices YoY
- -22.1%
- Rents YoY
- 1.8%
- Active inventory
- 394
- Price-to-rent
- 16.1×
Monthly cashflow live
- Estimated rent
- $2,071 high interval (Pro) →
- Mortgage (P&I)
- −$1,049
- Tax from tax record
- −$204 /mo · $2,443/yr
- Insurance
- −$83
- HOA
- −$0
- Vacancy / Maint / Mgmt
- −$435
- Net cashflow
- $300
Break-even live
2-unit breakdown (identical units grouped — click to expand)
| Units | Beds | Baths | Est. rent |
|---|---|---|---|
| 2× units | 2 | 1 | $2,072 |
| #1 | 2 | 1 | $1,036 |
| #2 | 2 | 1 | $1,036 |
| Total (2 units) | $2,071 | ||
UW: 25.0% down · 7.5% · 30yr · 1.5% tax · 5.0% vac · 8.0% maint · 8.0% mgmt
Financing live
Cash to close
- Down payment
- $50,000
- Closing costs
- $6,000
- Reserves months
- —
- Total cash needed
- —
Loan-product check · same deal, 3 products live
Conventional
25% down · 7.5% · 30yr
- Down + closing
- —
- Monthly P&I
- —
- Monthly cashflow
- —
- DSCR
- —
- Eligible?
- —
Personal DTI + credit; lowest rate.
DSCR
20% down · 8.5% · 30yr
- Down + closing
- —
- Monthly P&I
- —
- Monthly cashflow
- —
- DSCR
- —
- Eligible?
- —
No personal income docs; deal must DSCR.
Hard money
10% down · 12.0% · 12mo
- Down + closing
- —
- Monthly P&I
- —
- Monthly cashflow
- —
- DSCR
- —
- Eligible?
- —
Short-term bridge; refi at stabilization.
Rent comps 32 comps
| Address | Beds | Baths | Sqft | Rent | $/sqft | DOM | Units | Dist |
|---|---|---|---|---|---|---|---|---|
| 1029 W 25th St Unit 1 Jacksonville, FL | 5.0 | 2.0 | 1410 | $2,200 | $1.56 | 23d | 1 | 0.47mi |
| 1025 W 25th St Unit 1 Jacksonville, FL | 5.0 | 2.0 | 1500 | $2,000 | $1.33 | 23d | 1 | 0.47mi |
| 1031 W 26th St Jacksonville, FL | 3.0 | 2.0 | 1261 | $1,445 | $1.15 | 23d | 1 | 0.52mi |
| 1149 W 28th St Jacksonville, FL | 4.0 | 2.0 | 1344 | $1,302 | $0.97 | 23d | 1 | 0.65mi |
| 1511 W 15th St Jacksonville, FL | 5.0 | 3.0 | 1720 | $2,100 | $1.22 | 23d | 1 | 0.68mi |
| 1288 W 28th St Jacksonville, FL | 4.0 | 1.5 | 1449 | $1,267 | $0.87 | 13d | 1 | 0.70mi |
| 1931 Silver St Jacksonville, FL | 3.0 | 2.0 | 2132 | $2,600 | $1.22 | 23d | 1 | 0.82mi |
| 421 Golfair Blvd Jacksonville, FL | 4.0 | 2.5 | 1761 | $1,381 | $0.78 | 16d | 1 | 0.84mi |
| 1355 Grothe St Jacksonville, FL | 4.0 | 1.0 | 1312 | $1,350 | $1.03 | 17d | 1 | 0.84mi |
| 1619 Whitner St Jacksonville, FL | 3.0 | 2.0 | 1547 | $1,150 | $0.74 | 1d | 1 | 0.86mi |
| 30 W 12th St Jacksonville, FL | 4.0 | 3.0 | 1792 | $2,580 | $1.44 | 1d | 1 | 0.87mi |
| 118 W 28th St Jacksonville, FL | 3.0 | 2.0 | 1332 | $1,250 | $0.94 | 23d | 1 | 0.98mi |
| 146 W 6th St Jacksonville, FL | 3.0 | 1.0 | 1600 | $1,475 | $0.92 | 19d | 1 | 0.99mi |
| 1514 Silver St Jacksonville, FL | 3.0 | 2.0 | 1726 | $2,275 | $1.32 | 23d | 1 | 0.99mi |
| 326 Basswood St Jacksonville, FL | 3.0 | 2.0 | 1317 | $1,550 | $1.18 | 23d | 1 | 0.99mi |
| 1730 W 19th St Jacksonville, FL | 3.0 | 2.0 | 1323 | $1,100 | $0.83 | 1d | 1 | 0.99mi |
| 26 W 27th St Jacksonville, FL | 3.0 | 2.0 | 1512 | $1,300 | $0.86 | 23d | 1 | 1.03mi |
| 1708 W 24th St Jacksonville, FL | 3.0 | 2.0 | 1428 | $1,250 | $0.88 | 7d | 1 | 1.03mi |
| 1587 W 30th St Jacksonville, FL | 3.0 | 1.0 | 1363 | $1,450 | $1.06 | 14d | 1 | 1.07mi |
| 55 E 9th St Jacksonville, FL | 3.0 | 1.5 | 1246 | $1,675 | $1.34 | 14d | 1 | 1.07mi |
| 1744 W 28th St Jacksonville, FL | 3.0 | 2.0 | 1556 | $1,750 | $1.12 | 23d | 1 | 1.16mi |
| 643 Linwood Ave Jacksonville, FL | 3.0 | 2.0 | 1232 | $1,325 | $1.08 | 2d | 1 | 1.18mi |
| 28 W 33rd St Jacksonville, FL | 4.0 | 1.0 | 1395 | $898 | $0.64 | 7d | 1 | 1.18mi |
| 1837 W 28th St Jacksonville, FL | 3.0 | 2.0 | 1333 | $1,600 | $1.20 | 23d | 1 | 1.25mi |
| 1781 W 3rd St Jacksonville, FL | 4.0 | 2.0 | 1632 | $650 | $0.40 | 23d | 1 | 1.29mi |
| 1545 Union St W Jacksonville, FL | 3.0 | 2.0 | 1253 | $1,400 | $1.12 | 2d | 1 | 1.33mi |
| 1926 Walnut St Jacksonville, FL | 3.0 | 2.0 | 1338 | $1,418 | $1.06 | 14d | 1 | 1.33mi |
| 331 W 40th St Jacksonville, FL | 4.0 | 2.0 | 1536 | $1,375 | $0.90 | 3d | 1 | 1.34mi |
| 1607 Logan St Jacksonville, FL | 4.0 | 2.0 | 1232 | $1,800 | $1.46 | 23d | 1 | 1.38mi |
| 1348 Crestwood St Jacksonville, FL | 3.0 | 1.0 | 1300 | $1,100 | $0.85 | 23d | 1 | 1.41mi |
| 424 Walnut Ct Jacksonville, FL | 3.0 | 2.0 | 1530 | $1,688 | $1.10 | 14d | 1 | 1.43mi |
| 424 Walnut Ct Jacksonville, FL | 3.0 | 2.0 | 1530 | $1,688 | $1.10 | 14d | 1 | 1.43mi |
Listing history 13 events
-
2026-06-18days on market $200,000 Active 84 DOM
-
2026-06-17days on market $200,000 Active 83 DOM
-
2026-06-16days on market $200,000 Active 82 DOM
-
2026-06-15days on market $200,000 Active 81 DOM
-
2026-06-13pricedays on market $200,000 Active 78 DOM
-
2026-06-10days on market $210,000 Active 75 DOM
-
2026-06-08days on market $210,000 Active 74 DOM
-
2026-06-07days on market $210,000 Active 73 DOM
-
2026-06-03days on market $210,000 Active 69 DOM
-
2026-06-02days on market $210,000 Active 68 DOM
-
2026-06-01days on market $210,000 Active 67 DOM
-
2026-05-31days on market $210,000 Active 66 DOM
-
2026-03-26$210,000 Active
ⓘ Source: listings_history table (triggers on properties + properties_extension) + one-shot
backfill from property_details.listing_events for pre-trigger history.
Tax reassessment forecast FL · Resets to sale price
- Current annual tax
- $2,443 · $204/mo
- Projected year-2 tax
- $2,443 · $204/mo
- Expected delta
- $0/yr ($0/mo · 0.0%)
ⓘ Screening estimate from a state-policy table — verify with the county assessor before closing.
Climate risk First Street
- Flood 6/10 Major FEMA zone X (unshaded) · 73% chance over 30 yrs
- Wildfire 1/10 Low
- Heat 9/10 Extreme 7 d/yr ≥107°F today · 18 d/yr by 30 yrs out
- Wind 9/10 Extreme 99% chance of damaging wind over 30 yrs
- Air quality 4/10 Moderate 6 unhealthy d/yr today · 6 by 30 yrs out
Nearby sold comps map
Loading sold comps map…
Walkable amenities ~0.75 mi
Loading nearby amenities…
Taxation est. · year 1
- Rental income
- $24,852
- − Mortgage interest
- −$11,203
- − Property taxes
- −$2,443
- − Insurance
- −$1,000
- − Repairs & maintenance
- −$1,988
- − Management
- −$1,988
- − Depreciation
- −$5,818
- Taxable income
- $411
- Est. tax owed @ 24.0%
- −$99
- After-tax cash flow
- $3,505/yr
For passive investors: Depreciation is non-cash, so a rental often shows a tax loss while cash-flowing — sheltering income. Rental losses are passive: they offset passive income freely, and up to $25,000/yr can offset ordinary (W-2) income if you actively participate and your MAGI is under $100k (phasing out to $0 by $150k); unused losses carry forward. On sale, claimed depreciation is recaptured at up to 25%, and gains may owe capital-gains tax (a 1031 exchange can defer both). Figures are a year-1 estimate at your 24.0% rate — not tax advice; consult a CPA.
Schools (NCES district)
- District
- Duval
- NCES district ID
- 1200480
- Math proficiency
- 46% ▼ -11.00%
- Reading proficiency
- 45% ▼ -4.00%
- Median HH income
- $48,987
- Composite
- 38.97/100
- National rank
- #4076
- State rank
- #48 of 73 in FL
Livability — Jacksonville
- Score
- 83/100
- State rank
- #50
- US rank
- #911
Category grades
Schools grade is shown separately in the Schools card above.
Census & demographics
- Census place
- Jacksonville, FL
- County
- Duval County · 1,015,274 people
- City population
- 979,034
- Metro
- Jacksonville, FL
- Population (ZIP)
- 34,657
- Household income
- $30,514
- Rent vs Own
- Severe rent burden
- 2921.0
Population outlook (Duval County) Hauer SSP2
- Today (2025)
- 1,013,010 people
- By 2030
- 1,059,228 · +4.6%
- By 2040
- 1,141,439 · +12.7%
- By 2050
- 1,205,258 · +19.0%
- By 2075
- 1,324,282 · +30.7%
- By 2100
- 1,319,620 · +30.3%
Race, ethnicity, and origin ACS 2023
- Neighborhood character
- Predominantly Black (88%)
- Race & ethnicity
- Black 88% White 5% Hispanic / Latino 5% Two or more races 2%
- Hispanic origin (detail)
- Puerto Rican 3%
- Common ancestry
- Hispanic 1% Romanian 1%
- Foreign-born
- 3% · Canada
- Languages at home
- 95% English-only · Spanish 4% French/Haitian/Cajun 1%
Political lean MEDSL · Duval
- 2024 margin
- Toss-up / Even · D 48.7% · R 50.1% · Other 1.2%
- 2008→2024 swing
- +0.4pp no change · 2008: -1.9pp · 2024: -1.5pp
- All cycles
- 2024: R+1.5 2020: D+3.8 2016: R+1.5 2012: R+3.6 2008: R+1.9
Not yet ingested
- Civics
- —
Market trends
- HPI YoY
- ▼ -53.92%
- Current HPI
- 189.5977
- Rent YoY
- ▲ 1.81%
- Metro
- Jacksonville, FL
- State GDP YoY
- ▲ 3.28%
- F500 in state
- 36
Industry mix (Fortune 500 HQ in FL)
| Industry | F500 HQs | Revenue |
|---|---|---|
| Industrial Technology | 2 | $29B |
|
||
| Insurance | 2 | $17B |
|
||
| Retail | 1 | $60B |
|
||
| Technology Distribution | 1 | $58B |
|
||
| Homebuilding | 1 | $35B |
|
||
| Technology Manufacturing | 1 | $35B |
|
||
Price history
1 event — show timeline
- 2026-03-26 Listed $210,000 realMLS
Property tax history
+16.6%/yrLatest (2025): $2,443 · +25.5% YoY. Source: county tax records.
Cash-flow waterfall
monthlySold comps — $/sqft
last 12 mo · ≤1 miLoading sold comps…