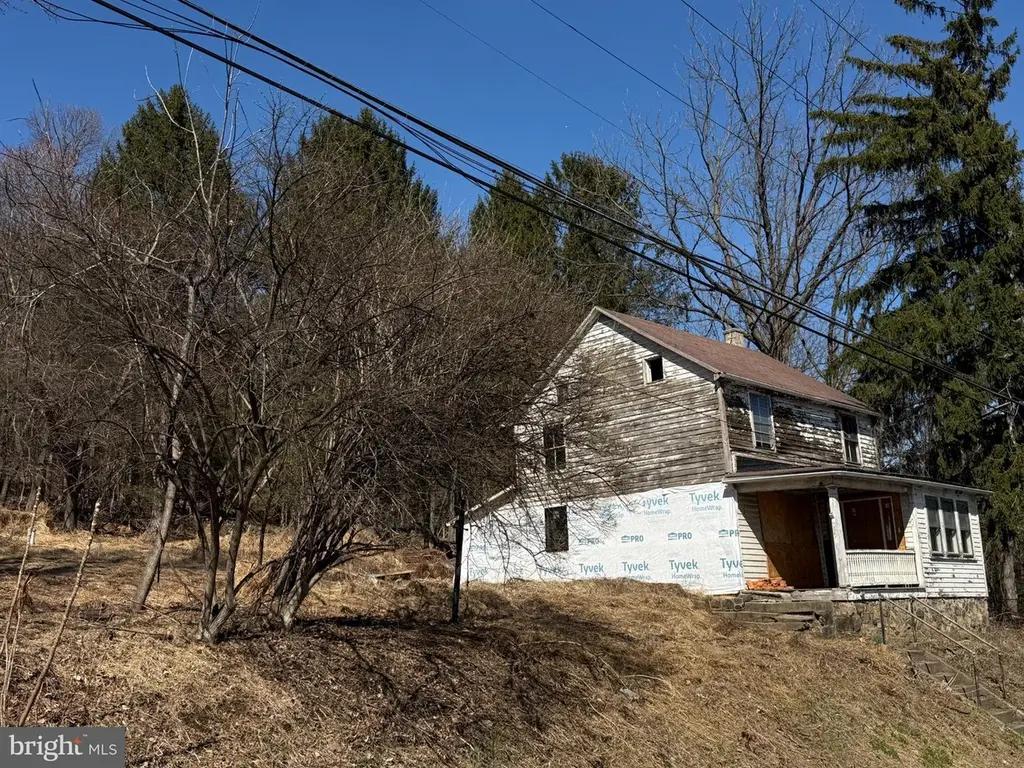
1229 Seidersville Rd · Lower Saucon, PA
Flood risk 1/10 · Minimal
- FEMA flood zone
- X (unshaded)
- Chance of flooding over 30 yrs
- 0.0%
- Est. flood insurance / yr
- $473 – $860
Fire risk 3/10 · Minor
- Est. fire insurance / yr
- $511 – $949
Heat risk 4/10 · Minor
- Hot days now (above 100°F)
- 6 days/yr
- Hot days in 30 yrs
- 13 days/yr
Wind risk 4/10 · Minor
- Chance of severe wind over 30 yrs
- 20.0%
Air-quality risk 4/10 · Minor
- Unhealthy air days now
- 3 days/yr
- Unhealthy air days in 30 yrs
- 6 days/yr
Risk factors via First Street. Map © Google.
Why this score? — see what drove the B- grade
The composite is a weighted blend of 9 inputs, each scored 0–100. Each bar is that input's sub-score; the figure is the points it added to the 100-point composite (weight × sub-score).
- Cash flow +26.6/30.0
- DSCR +9.1/10.0
- 1% rule +7.6/10.0
- ARV discount +7.5/15.0
- Schools +5.4/10.0
- Rent growth +4.3/5.0
- Livability +2.5/5.0
- Condition / age +2.5/5.0
- Appreciation +0.0/10.0
$165,000
🖨 Deal sheet 📄 Offer letter ✓ Due diligence
Listing remarks MLS
This property presents a great opportunity for someone with vision. Situated on 1.5 acres and including an additional 1-acre lot across the street, the total acreage exceeds 2.5 acres, offering ample space for a variety of possibilities. The existing home requires rehabilitation, providing the option to restore it or build new to suit your needs. Ideal for those looking to renovate, build, or invest, this property offers the chance to make full use of a substantial piece of land and create something truly your own.
Key facts
- 1-acre lot
- 1.5 acres
- Total acreage
Tags
Property features AI
Finance
- Financial info: Ownership: Fee simple; Property condition: Major rehab needed
Exterior
- Parking: Off-street parking
- Utilities: Well water; Septic system; Electric available; Cable TV available; Phone service available
- Home design: Detached single-family structure; Three floors in unit; Main entrance faces south
- Construction: Frame construction; Asphalt roof; Foundation: Other; Above-grade other structures present; Year built: estimated
- Exterior features: Paved road frontage (approximately 350 feet); Additional parcel included (Tax ID Q6 3 15 0719 - 1.07 acres)
Interior
- Bedrooms: Two bedrooms on the first upper level; One bedroom on the second upper level
- Bathrooms: One full bathroom (all upper levels)
- Interior features: Full basement with outside entrance; Living area reported as estimated
- Laundry & utility: Laundry located in the basement
Neighborhood map
What this means for you Summary
Snapshot
- This is a 3-bed/1.0-bath single-family listed at $165k.
Deal economics
- At list price, monthly cash flow is $444 ($5k/yr) — positive.
- The deal already cash-flows at list — no discount required.
- Meets the 1% rule at list price ($2k rent vs $165k).
- Recommended offer: $160k (3.0% below list) — sets the bar for market timing.
Location & tenants
- Location reads: area grade B — affects rentability + tenant quality, not the cash-flow math above.
- Saucon Valley SD (suburban): math 57% / reading 66% proficiency, ranked #58 of 539 in PA (top 11%) — acceptable for families but not a draw, mixed tenant base, ~2y average lease; only 18% free/reduced lunch — higher-income household profile.
- Market conditions: Rents rising fast (+7.2%/yr); 156 active listings in the ZIP; 21 comparable units currently listed for rent nearby; rentals at typical pace (median 21d on market — plan ~3-4 weeks tenant-placement turnaround); 567 units permitted in Northampton County in 2024 (151 in 5+ unit buildings).
- This rent runs 41% of the median local income ($61k/yr) — at the standard rent-burdened threshold; future hikes will face affordability resistance.
Forward outlook
- Local home prices are declining (-3.0%/yr); year-one equity from $1k of loan paydown is wiped out by about $5k of value loss. Plan a longer hold.
- At projected returns (-3.0% appreciation + 7.2% rent growth), your $46k cash investment doubles in ~7 years — after that, you're playing with house money.
Negotiation context
- It's been on market 47 days — a 3% lower offer ($160k) is reasonable based on typical stale-listing flexibility.
- 7 sale attempts since 3y ago; this cycle's ask has dropped $15k (8%) from the opening price — seller is motivated, your offer sets the floor, not the list.
- Current owner paid $126k; 31% above their basis — modest negotiation headroom, anchor on the comps not their cost.
Risks & watch-outs
- Watch-outs: built in 1900 — expect roof / HVAC / electrical / plumbing capex.
Questions for the listing agent
- It's been on market 47 days. Have you received any prior offers? Is the seller open to a 3% concession, seller financing, or rate buy-down credit?
- Built in 1900 — when were the roof, HVAC, electrical panel, plumbing, and water heater last replaced?
- Is there a deadline driving the sale (1031 exchange, divorce, estate, relocation)? That informs how much negotiation room exists.
- What's the average days-on-market for RENTAL listings here right now (not sales)? A rising rental-DOM trend means longer vacancies and softer asking-rent achievability than the comps imply.
- What's the recent tenant-quality profile in this submarket — average credit score on applications, eviction rate, late-payment / NSF rate, and stable-employment percentage? A property-management company in the area should have these aggregated.
- How much new for-sale + rental construction is in the pipeline within 1–3 miles? Heavy new supply typically softens prices + rents 12–24 months out; constrained supply supports both.
Investment metrics
- 1% rule
- 1.26% ✓
- Cap rate
- 9.52%
- Cash-on-cash
- 11.53%
- DSCR
- 1.51
- GRM
- 6.6
CMA / ARV
- ARV (median comp)
- $434,999
- List price
- $165,000
- Delta
- -62.07%
- Verdict
- UNDERPRICED
- Comps
- 17 within 1.0 mi
Projected returns pro-forma
-3.0% appreciation · 7.18% rent growth · sell at horizon
- IRR
- 5.7%
- Equity multiple
- 1.23×
- Total profit
- $10,718
- Equity at exit
- $24,602
- IRR
- 18.7%
- Equity multiple
- 2.88×
- Total profit
- $86,784
- Equity at exit
- $14,266
Cash invested: $46,200 (down + closing). Projections, not guarantees.
Landlord ↔ Tenant lean methodology
- Overall (STATE)
- 62 Landlord-Friendly
- State Pennsylvania
- 62 Landlord-Friendly · EVEN
- County
- — inherits STATE
- City
- — inherits STATE
ZIP-level market 18015
- Home prices YoY
- -30.7%
- Rents YoY
- 7.2%
- Active inventory
- 156
- Price-to-rent
- 6.6×
Monthly cashflow live
- Estimated rent
- $2,080 high interval (Pro) →
- Mortgage (P&I)
- −$865
- Tax from tax record
- −$265 /mo · $3,178/yr
- Insurance
- −$69
- HOA
- −$0
- Vacancy / Maint / Mgmt
- −$437
- Net cashflow
- $444
Break-even live
UW: 25.0% down · 7.5% · 30yr · 1.5% tax · 5.0% vac · 8.0% maint · 8.0% mgmt
Financing live
Cash to close
- Down payment
- $41,250
- Closing costs
- $4,950
- Reserves months
- —
- Total cash needed
- —
Loan-product check · same deal, 3 products live
Conventional
25% down · 7.5% · 30yr
- Down + closing
- —
- Monthly P&I
- —
- Monthly cashflow
- —
- DSCR
- —
- Eligible?
- —
Personal DTI + credit; lowest rate.
DSCR
20% down · 8.5% · 30yr
- Down + closing
- —
- Monthly P&I
- —
- Monthly cashflow
- —
- DSCR
- —
- Eligible?
- —
No personal income docs; deal must DSCR.
Hard money
10% down · 12.0% · 12mo
- Down + closing
- —
- Monthly P&I
- —
- Monthly cashflow
- —
- DSCR
- —
- Eligible?
- —
Short-term bridge; refi at stabilization.
Rent comps 21 comps
| Address | Beds | Baths | Sqft | Rent | $/sqft | DOM | Units | Dist |
|---|---|---|---|---|---|---|---|---|
| 824 E 8th St Bethlehem, PA | 2.0 | 1.5 | 952 | $1,400 | $1.47 | 43d | 1 | 1.03mi |
| 406 W 9th St Bethlehem, PA | 3.0 | 1.0 | 1152 | $2,100 | $1.82 | 21d | 1 | 1.04mi |
| 14 Finady Ave Bethlehem, PA | 3.0 | 1.5 | 1500 | $1,600 | $1.07 | 21d | 1 | 1.18mi |
| 740 Laufer St Bethlehem, PA | 3.0 | 1.5 | 910 | $1,650 | $1.81 | 14d | 1 | 1.27mi |
| 612 E 5th St Bethlehem, PA | 4.0 | 2.0 | 1814 | $2,500 | $1.38 | 43d | 1 | 1.29mi |
| 541 Jischke St Bethlehem, PA | 3.0 | 1.0 | 1090 | $1,800 | $1.65 | 23d | 1 | 1.29mi |
| 436 Pierce St Bethlehem, PA | 4.0 | 2.0 | 1452 | $2,250 | $1.55 | 2d | 1 | 1.30mi |
| 521 Hess St Bethlehem, PA | 3.0 | 1.0 | 1120 | $1,500 | $1.34 | 21d | 1 | 1.33mi |
| 938 E 4th St #401 Bethlehem, PA | 2.0 | 1.0 | 928 | $2,150 | $2.32 | 43d | 1 | 1.42mi |
| 938 E 4th St Unit 201 Bethlehem, PA | 2.0 | 1.0 | 982 | $2,350 | $2.39 | 43d | 1 | 1.42mi |
| 1610 Ravena St Bethlehem, PA | 3.0 | 2.5 | 1562 | $2,690 | $1.72 | 2d | 1 | 1.43mi |
| 1217 Broadway Unit 2 Fountain Hill, PA | 2.0 | 1.0 | 1340 | $1,550 | $1.16 | 23d | 1 | 1.44mi |
| 1430 Jadden Ct Bethlehem, PA | 3.0 | 2.5 | 1690 | $2,650 | $1.57 | 23d | 1 | 1.44mi |
| 708 Cherokee St Bethlehem, PA | 3.0 | 1.5 | 1200 | $2,500 | $2.08 | 43d | 1 | 1.45mi |
| 610 E 3rd St Bethlehem, PA | 1.0–2.0 | 1.0–2.0 | 974 | $3,008 | $3.09 | 2d | 8 | 1.45mi |
| 1236 E 7th St Bethlehem, PA | 3.0 | 2.5 | 1424 | $2,350 | $1.65 | 2d | 1 | 1.46mi |
| 311 E 3rd St Bethlehem, PA | 2.0 | 2.0 | 1189 | $2,330 | $1.96 | 2d | 3 | 1.47mi |
| 540 Seneca St Apt 2 Bethlehem, PA | 2.0 | 1.0 | 950 | $1,520 | $1.60 | 2d | 1 | 1.48mi |
| 314 State St Bethlehem, PA | 4.0 | 2.0 | 1654 | $2,650 | $1.60 | 14d | 1 | 1.48mi |
| 1122 E 4th St Bethlehem, PA | 4.0 | 1.0 | 1706 | $1,800 | $1.06 | 14d | 1 | 1.49mi |
| 1113 E 4th St Unit 1 Bethlehem, PA | 2.0 | 1.0 | 1000 | $1,350 | $1.35 | 23d | 1 | 1.50mi |
Listing history 37 events
-
2026-06-16status $165,000 Pending 47 DOM
-
2026-06-15days on market $165,000 Active 47 DOM
Show marketing remark (520 chars)
This property presents a great opportunity for someone with vision. Situated on 1.5 acres and including an additional 1-acre lot across the street, the total acreage exceeds 2.5 acres, offering ample space for a variety of possibilities. The existing home requires rehabilitation, providing the option to restore it or build new to suit your needs. Ideal for those looking to renovate, build, or invest, this property offers the chance to make full use of a substantial piece of land and create something truly your own.
-
2026-06-14days on market $165,000 Active 45 DOM
-
2026-06-10days on market $165,000 Active 42 DOM
-
2026-06-09days on market $165,000 Active 41 DOM
-
2026-06-08days on market $165,000 Active 40 DOM
-
2026-06-07days on market $165,000 Active 39 DOM
-
2026-06-05days on market $165,000 Active 36 DOM
-
2026-06-03days on market $165,000 Active 35 DOM
-
2026-06-03price $165,000 Active 34 DOM
-
2026-06-02days on market $180,000 Active 34 DOM
Show marketing remark (520 chars)
This property presents a great opportunity for someone with vision. Situated on 1.5 acres and including an additional 1-acre lot across the street, the total acreage exceeds 2.5 acres, offering ample space for a variety of possibilities. The existing home requires rehabilitation, providing the option to restore it or build new to suit your needs. Ideal for those looking to renovate, build, or invest, this property offers the chance to make full use of a substantial piece of land and create something truly your own.
-
2026-06-01days on market $180,000 Active 33 DOM
-
2026-05-31days on market $180,000 Active 32 DOM
-
2026-05-31days on market $180,000 Active 31 DOM
-
2026-04-29$180,000 Active 520-char remark
Show marketing remark (520 chars)
This property presents a great opportunity for someone with vision. Situated on 1.5 acres and including an additional 1-acre lot across the street, the total acreage exceeds 2.5 acres, offering ample space for a variety of possibilities. The existing home requires rehabilitation, providing the option to restore it or build new to suit your needs. Ideal for those looking to renovate, build, or invest, this property offers the chance to make full use of a substantial piece of land and create something truly your own.
-
2024-07-08soldstatus $126,000
-
2024-06-03historical
-
2024-06-03soldstatus $126,000 Sold
-
2024-04-26status Pending
-
2024-04-26status Pending
-
2024-04-25historical
-
2024-04-20price $140,000
-
2024-04-04price $140,000
-
2024-04-02$160,000 Active
-
2024-02-20$160,000 Active
-
2024-01-22$160,000 Active
-
2023-12-31historical
-
2023-12-31historical
-
2023-10-23price $179,000
-
2023-10-23price $179,000
-
2023-08-23price $159,500
-
2023-08-23price $159,500
-
2023-06-06price $175,000
-
2023-06-06price $175,000
-
2023-05-29$165,000 Active
-
2023-05-29$165,000 Active
ⓘ Source: listings_history table (triggers on properties + properties_extension) + one-shot
backfill from property_details.listing_events for pre-trigger history.
Tax reassessment forecast PA · Partial reset (capped growth)
- Current annual tax
- $3,178 · $265/mo
- Projected year-2 tax
- $3,178 · $265/mo
- Expected delta
- $0/yr ($0/mo · 0.0%)
ⓘ Screening estimate from a state-policy table — verify with the county assessor before closing.
Climate risk First Street
- Flood 1/10 Low FEMA zone X (unshaded) · 0% chance over 30 yrs
- Wildfire 3/10 Moderate
- Heat 4/10 Moderate 6 d/yr ≥100°F today · 13 d/yr by 30 yrs out
- Wind 4/10 Moderate 20% chance of damaging wind over 30 yrs
- Air quality 4/10 Moderate 3 unhealthy d/yr today · 6 by 30 yrs out
Nearby sold comps map
Loading sold comps map…
Walkable amenities ~0.75 mi
Loading nearby amenities…
Taxation est. · year 1
- Rental income
- $24,954
- − Mortgage interest
- −$9,243
- − Property taxes
- −$3,178
- − Insurance
- −$825
- − Repairs & maintenance
- −$1,996
- − Management
- −$1,996
- − Depreciation
- −$4,800
- Taxable income
- $2,916
- Est. tax owed @ 24.0%
- −$700
- After-tax cash flow
- $4,627/yr
For passive investors: Depreciation is non-cash, so a rental often shows a tax loss while cash-flowing — sheltering income. Rental losses are passive: they offset passive income freely, and up to $25,000/yr can offset ordinary (W-2) income if you actively participate and your MAGI is under $100k (phasing out to $0 by $150k); unused losses carry forward. On sale, claimed depreciation is recaptured at up to 25%, and gains may owe capital-gains tax (a 1031 exchange can defer both). Figures are a year-1 estimate at your 24.0% rate — not tax advice; consult a CPA.
Schools (NCES district)
- District
- Saucon Valley SD
- NCES district ID
- 4211730
- Math proficiency
- 57% ▬ 0.00%
- Reading proficiency
- 66% ▼ -9.00%
- Median HH income
- $67,374
- Composite
- 53.95/100
- National rank
- #1401
- State rank
- #58 of 539 in PA
Livability — Lower Saucon
No livability data for this city. (Only ~50 U.S. cities are tracked.)
Census & demographics
- County
- Northampton County · 236,814 people
- Metro
- Allentown-Bethlehem-Easton, PA-NJ
- Population (ZIP)
- 34,852
- Household income
- $60,800
- Rent vs Own
- Severe rent burden
- 1525.0
Population outlook (Northampton County) Hauer SSP2
- Today (2025)
- 312,227 people
- By 2030
- 314,769 · +0.8%
- By 2040
- 316,914 · +1.5%
- By 2050
- 318,037 · +1.9%
- By 2075
- 334,003 · +7.0%
- By 2100
- 344,696 · +10.4%
Race, ethnicity, and origin ACS 2023
- Neighborhood character
- Diverse neighborhood (Simpson 0.62)
- Race & ethnicity
- White 53% Hispanic / Latino 29% Two or more races 14% Black 10% Asian 5%
- Hispanic origin (detail)
- Mexican 2% Puerto Rican 19% Dominican 3%
- Common ancestry
- Romanian 4% Danish 1% Iranian 1%
- Foreign-born
- 12% · Canada, China, Jamaica
- Languages at home
- 73% English-only · Spanish 21% Chinese 2% Other Indo-European 2%
Political lean MEDSL · Northampton
- 2024 margin
- Toss-up / Even · D 48.6% · R 50.4%
- 2008→2024 swing
- -14.1pp toward R · 2008: 12.3pp · 2024: -1.8pp
- All cycles
- 2024: R+1.8 2020: D+0.7 2016: R+3.8 2012: D+4.6 2008: D+12.3
Not yet ingested
- Civics
- —
Market trends
- HPI YoY
- ▼ -122.95%
- Current HPI
- 277.4721
- Rent YoY
- ▲ 7.18%
- Metro
- Allentown-Bethlehem-Easton, PA-NJ
- State GDP YoY
- ▲ 1.68%
- F500 in state
- 34
Industry mix (Fortune 500 HQ in PA)
| Industry | F500 HQs | Revenue |
|---|---|---|
| Healthcare | 2 | $309B |
|
||
| Insurance | 2 | $27B |
|
||
| Telecommunications / Media | 1 | $124B |
|
||
| Industrial Distribution | 1 | $22B |
|
||
| Financial Services | 1 | $20B |
|
||
| Chemicals / Materials | 1 | $18B |
|
||
Price history
+0.0% since first listed27 events — show timeline
- 2026-06-15 Pending — BRIGHT MLS
- 2026-06-15 Pending — BRIGHT MLS
- 2026-06-02 Price Changed $165,000 BRIGHT MLS
- 2026-06-02 Price Changed $165,000 BRIGHT MLS
- 2026-04-29 Listed $180,000 BRIGHT MLS
- 2026-04-29 Listed $180,000 BRIGHT MLS
- 2024-07-08 Sold (Public Records) $126,000 Public Records
- 2024-06-03 Sold (MLS) $126,000 GLVRMLS
- 2024-06-03 Listing Removed — GLVRMLS
- 2024-04-26 Pending — GLVRMLS
- 2024-04-26 Pending — GLVRMLS
- 2024-04-25 Listing Removed — BRIGHT MLS
- 2024-04-20 Price Changed $140,000 GLVRMLS
- 2024-04-04 Price Changed $140,000 GLVRMLS
- 2024-04-02 Listed $160,000 GLVRMLS
- 2024-02-20 Listed $160,000 BRIGHT MLS
- 2024-01-22 Listed $160,000 GLVRMLS
- 2023-12-31 Listing Removed — GLVRMLS
- 2023-12-31 Listing Removed — GLVRMLS
- 2023-10-23 Price Changed $179,000 GLVRMLS
- 2023-10-23 Price Changed $179,000 GLVRMLS
- 2023-08-23 Price Changed $159,500 GLVRMLS
- 2023-08-23 Price Changed $159,500 GLVRMLS
- 2023-06-06 Price Changed $175,000 GLVRMLS
- 2023-06-06 Price Changed $175,000 GLVRMLS
- 2023-05-29 Listed $165,000 GLVRMLS
- 2023-05-29 Listed $165,000 GLVRMLS
Property tax history
+0.6%/yrLatest (2026): $3,178 · +0.8% YoY. Source: county tax records.
Cash-flow waterfall
monthlySold comps — $/sqft
last 12 mo · ≤1 miLoading sold comps…