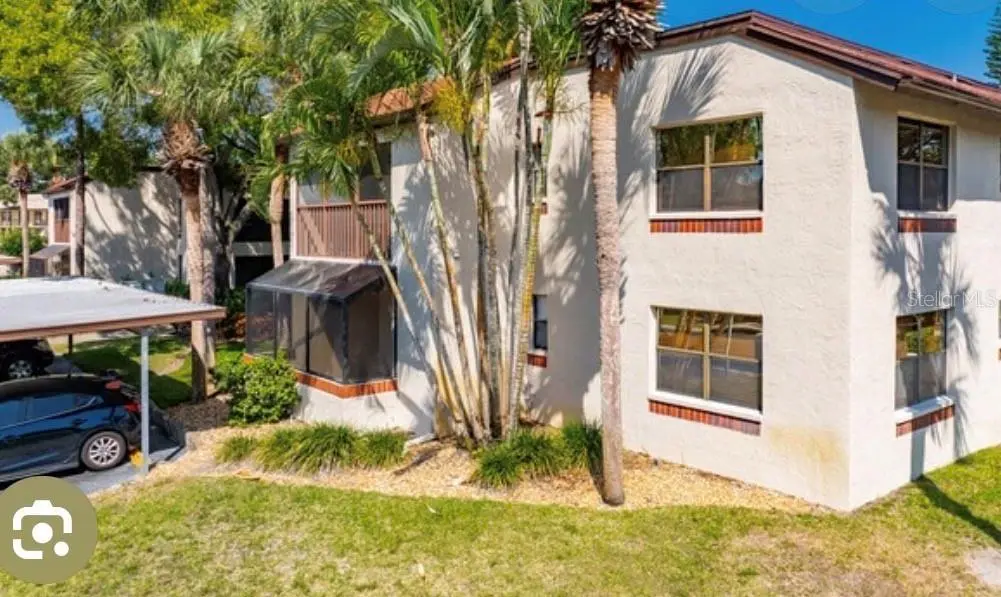
2971 Estancia Blvd #229 · Dunedin, FL
Flood risk 1/10 · Minimal
- FEMA flood zone
- X (unshaded)
- Chance of flooding over 30 yrs
- 0.0%
- Est. flood insurance / yr
- $507 – $1,088
Fire risk 1/10 · Minimal
- Est. fire insurance / yr
- $947 – $1,759
Heat risk 10/10 · Severe
- Hot days now (above 107°F)
- 7 days/yr
- Hot days in 30 yrs
- 28 days/yr
Wind risk 10/10 · Severe
- Chance of severe wind over 30 yrs
- 99.0%
Air-quality risk 3/10 · Minor
- Unhealthy air days now
- 3 days/yr
- Unhealthy air days in 30 yrs
- 3 days/yr
Risk factors via First Street. Map © Google.
Why this score? — see what drove the D grade
The composite is a weighted blend of 9 inputs, each scored 0–100. Each bar is that input's sub-score; the figure is the points it added to the 100-point composite (weight × sub-score).
- 1% rule +9.0/10.0
- Cash flow +8.0/30.0
- ARV discount +7.5/15.0
- Schools +4.3/10.0
- Livability +4.3/5.0
- Rent growth +2.5/5.0
- Condition / age +2.5/5.0
- DSCR +2.0/10.0
- Appreciation +0.0/10.0
$129,900
🖨 Deal sheet 📄 Offer letter ✓ Due diligence
Listing remarks
2/2 condo. Ready for Sale. Fully furnished. Ready for move in.
Key facts
- Corner unit
- $637 HOA
- Parking
Tags
Property features AI
Finance
- Other: Furnished; No lease restrictions indicated
- Financial info: Total monthly fees listed as $637; total annual fees listed as $7,644
- HOA & community: Monthly association fee $637 (includes cable TV); Association name: Resource Property Management; Association approval required; Community amenities: Playground, Pool; Pets allowed with breed restrictions (max 60 lbs)
Exterior
- Parking: Carport (1 space)
- Utilities: Public sewer; Cable connected; No listed water source
- Home design: Residential condominium; 2 stories total; Faces west; Located on 2nd floor
- Construction: Block construction; Membrane and shingle roof; Block foundation; Built as part of a multi-unit building (Building #200)
- Exterior features: In-ground pool; Asphalt road access
Interior
- Kitchen: Dishwasher; Disposal; Freezer; Microwave; Range; Refrigerator
- Bedrooms: 2 bedrooms
- Flooring: Carpet
- Bathrooms: 2 full bathrooms
- Heating & cooling: Central heat; Central air conditioning
- Interior features: Ceiling fans
- Laundry & utility: Washer; Dryer; Electric water heater; Laundry inside
Neighborhood map
What this means for you Summary
Snapshot
- This is a 2-bed/2.0-bath condo listed at $130k.
Deal economics
- At list price, monthly cash flow is $-133 ($-2k/yr) — negative.
- To cash-flow at today's rent, offer at most $106k (18.1% below list).
- Meets the 1% rule at list price ($2k rent vs $130k).
- Recommended offer: $106k (18.1% below list) — sets the bar for cash-flow.
- Cap rate 5.1% vs local median 2.8% in Dunedin — top-decile yield for the area; either an underpriced asset or a hidden risk that comps aren't pricing in. Stress-test before assuming the spread holds.
Location & tenants
- Location reads 86/100 on livability (#15 in FL, #411 nationally) — a professional / high-income tenant draw. Strengths: crime A+, commute A+, housing A+; Watch: employment C-, amenities D.
- Pinellas (suburban): math 51% / reading 51% proficiency, ranked #31 of 73 in FL (top 42%) — acceptable for families but not a draw, mixed tenant base, ~2y average lease.
- Market conditions: Rents flat; 201 active listings in the ZIP; 22 comparable units currently listed for rent nearby; rentals leasing fast (median 12d on market — plan ~1-2 weeks tenant-placement turnaround); 2,676 units permitted in Pinellas County in 2024 (1,422 in 5+ unit buildings).
Forward outlook
- Local home prices are declining (-3.0%/yr); year-one equity from $898 of loan paydown is wiped out by about $4k of value loss. Plan a longer hold.
- Pinellas County population projected at +14% by 2050 — modest demand growth; plan on rents tracking national, not racing it.
Negotiation context
- It's been on market 94 days — a 9% lower offer ($118k) is reasonable based on typical stale-listing flexibility.
- Current owner paid $58k; list at $130k implies a 124% gain — meaningful room to come down on a strong offer.
Risks & watch-outs
- Watch-outs: HOA is 35% of rent.
- Climate carrying-cost: severe wind risk, 99% chance of damaging wind over 30y; extreme-heat days projected 7→28/yr by 2055 (HVAC capex compounding) — expect insurance premiums to compound above CPI over the hold.
Questions for the listing agent
- What do current leases actually rent for vs. the listed asking? Can we see a recent rent roll and the last 12 months of T-12 income?
- It's been on market 94 days. Have you received any prior offers? Is the seller open to a 18% concession, seller financing, or rate buy-down credit?
- What does the HOA fee cover, when was the last increase, and are there any pending special assessments or reserve-fund shortfalls?
- Any open or pending special assessments — roof, HVAC, plumbing, elevator, façade? What's the per-unit balance and payoff schedule, and is the seller paying it off at close or rolling it to the buyer?
- Why hasn't it sold? Are there any deal-killer items the seller is aware of (foundation, flood, title, zoning, code violations)?
- Is there a deadline driving the sale (1031 exchange, divorce, estate, relocation)? That informs how much negotiation room exists.
- Schools are A-rated — typically a magnet for longer-tenancy family renters. What's the average tenant stay here, and is there a school-zone premium baked into asking?
- The area grade is low — what's the realistic commute time and amenity access for the typical tenant pool here? Any planned neighborhood developments (good or bad) we should know about?
- What's the average days-on-market for RENTAL listings here right now (not sales)? A rising rental-DOM trend means longer vacancies and softer asking-rent achievability than the comps imply.
- What's the recent tenant-quality profile in this submarket — average credit score on applications, eviction rate, late-payment / NSF rate, and stable-employment percentage? A property-management company in the area should have these aggregated.
- How much new apartment / multifamily construction is in the pipeline within 1–3 miles? Heavy new supply (>2% of stock underway) typically softens rents 12–24 months out; light construction supports rent growth.
Investment metrics
- 1% rule
- 1.40% ✓
- Cap rate
- 5.06%
- Cash-on-cash
- -4.39%
- DSCR
- 0.80
- GRM
- 6.0
CMA / ARV
No comps found within radius.
Projected returns pro-forma
-3.0% appreciation · 0.11% rent growth · sell at horizon
- IRR
- -29.6%
- Equity multiple
- 0.06×
- Total profit
- $-34,224
- Equity at exit
- $19,369
- IRR
- -72.2%
- Equity multiple
- -0.62×
- Total profit
- $-58,827
- Equity at exit
- $11,231
Cash invested: $36,372 (down + closing). Projections, not guarantees.
Landlord ↔ Tenant lean methodology
- Overall (STATE)
- 87 Strongly Landlord-Friendly
- State Florida
- 87 Strongly Landlord-Friendly · R+3
- County
- — inherits STATE
- City
- — inherits STATE
ZIP-level market 33761
- Rents YoY
- 0.1%
- Active inventory
- 201
- Price-to-rent
- 6.0×
Monthly cashflow live
- Estimated rent
- $1,818 high interval (Pro) →
- Mortgage (P&I)
- −$681
- Tax from tax record
- −$197 /mo · $2,363/yr
- Insurance
- −$54
- HOA
- −$637
- Vacancy / Maint / Mgmt
- −$382
- Net cashflow
- $-133
Break-even live
UW: 25.0% down · 7.5% · 30yr · 1.5% tax · 5.0% vac · 8.0% maint · 8.0% mgmt
Financing live
Cash to close
- Down payment
- $32,475
- Closing costs
- $3,897
- Reserves months
- —
- Total cash needed
- —
Loan-product check · same deal, 3 products live
Conventional
25% down · 7.5% · 30yr
- Down + closing
- —
- Monthly P&I
- —
- Monthly cashflow
- —
- DSCR
- —
- Eligible?
- —
Personal DTI + credit; lowest rate.
DSCR
20% down · 8.5% · 30yr
- Down + closing
- —
- Monthly P&I
- —
- Monthly cashflow
- —
- DSCR
- —
- Eligible?
- —
No personal income docs; deal must DSCR.
Hard money
10% down · 12.0% · 12mo
- Down + closing
- —
- Monthly P&I
- —
- Monthly cashflow
- —
- DSCR
- —
- Eligible?
- —
Short-term bridge; refi at stabilization.
Rent comps 22 comps
| Address | Beds | Baths | Sqft | Rent | $/sqft | DOM | Units | Dist |
|---|---|---|---|---|---|---|---|---|
| 2971 Estancia Blvd #321 Clearwater, FL | 2.0 | 2.0 | 995 | $1,975 | $1.98 | 4d | 1 | 0.01mi |
| 305 Hammock Pine Blvd #305 Clearwater, FL | 1.0 | 1.5 | 760 | $1,500 | $1.97 | 24d | 1 | 0.12mi |
| 2999 Fieldbrook Pl Clearwater, FL | 2.0 | 2.0 | 1164 | $2,300 | $1.98 | 24d | 1 | 0.20mi |
| 2500 Winding Creek Blvd Clearwater, FL | 1.0–2.0 | 1.0–2.0 | 812 | $1,700 | $2.09 | 2d | 3 | 0.21mi |
| 2500 Winding Creek Blvd Clearwater, FL | 2.0 | 2.0 | 946 | $1,675 | $1.77 | 3d | 2 | 0.21mi |
| 2500 Winding Creek Blvd Unit C205 Clearwater, FL | 2.0 | 2.0 | 946 | $1,700 | $1.80 | 4d | 1 | 0.22mi |
| 28488 U.S. 19 Unit 150 Clearwater, FL | 3.0 | 1.5 | 990 | $1,500 | $1.52 | 11d | 1 | 0.33mi |
| 373 Majesty Dr Unit 373 Clearwater, FL | 2.0 | 2.0 | 1200 | $1,600 | $1.33 | 24d | 1 | 0.51mi |
| 2307 Cumberland Cir Clearwater, FL | 1.0–2.0 | 1.0–2.0 | 873 | $2,099 | $2.40 | 3d | 15 | 0.59mi |
| 2780 Cypress Dr Unit A Clearwater, FL | 2.0 | 1.0 | 900 | $1,749 | $1.94 | 22d | 1 | 0.67mi |
| 3052 Park Ln Unit B Dunedin, FL | 2.0 | 1.0 | 821 | $1,700 | $2.07 | 24d | 1 | 0.71mi |
| 3055 Belcher Rd Dunedin, FL | 2.0 | 1.0 | 750 | $1,345 | $1.79 | 22d | 1 | 0.73mi |
| 2780 Park Dr Unit D 4 Clearwater, FL | 2.0 | 1.5 | 900 | $1,625 | $1.81 | 24d | 1 | 0.78mi |
| 2673 Sabal Springs Cir #201 Clearwater, FL | 1.0 | 1.5 | 805 | $2,675 | $3.32 | 7d | 1 | 0.79mi |
| 2228 Richter St Unit A Dunedin, FL | 2.0 | 2.0 | 1225 | $1,900 | $1.55 | 24d | 1 | 0.80mi |
| 2713 Countryside Blvd #108 Clearwater, FL | 2.0 | 2.0 | 1100 | $1,850 | $1.68 | 3d | 1 | 0.96mi |
| 2581 Countryside Blvd Unit 304 Clearwater, FL | 2.0 | 2.0 | 1200 | $2,100 | $1.75 | 24d | 1 | 1.04mi |
| 1430 Heather Ridge Blvd #304 Dunedin, FL | 1.0 | 1.0 | 915 | $1,500 | $1.64 | 24d | 1 | 1.06mi |
| 2524 Alexander Pl Clearwater, FL | 1.0–3.0 | 1.0–2.0 | 991 | $2,090 | $2.11 | 2d | 20 | 1.20mi |
| 2257 Palmwood Dr Dunedin, FL | 3.0 | 2.0 | 1150 | $2,475 | $2.15 | 4d | 1 | 1.21mi |
| 2561 Forest Run Ct Clearwater, FL | 3.0 | 2.0 | 1145 | $2,000 | $1.75 | 3d | 1 | 1.24mi |
| 2690 Enterprise Rd E Clearwater, FL | 1.0–2.0 | 1.0–2.0 | 1051 | $2,564 | $2.44 | 3d | 9 | 1.40mi |
HOA detail condo
- Monthly dues
- $637 · $7,644/yr
- Assessments
- None detected in remarks — confirm with the listing agent.
Listing history 15 events
-
2026-06-18days on market $129,900 Active 94 DOM
-
2026-06-17days on market $129,900 Active 93 DOM
-
2026-06-16days on market $129,900 Active 92 DOM
-
2026-06-15days on market $129,900 Active 91 DOM
-
2026-06-13days on market $129,900 Active 89 DOM
-
2026-06-09days on market $129,900 Active 85 DOM
-
2026-06-08days on market $129,900 Active 84 DOM
-
2026-06-07days on market $129,900 Active 83 DOM
-
2026-06-04days on market $129,900 Active 80 DOM
-
2026-06-03days on market $129,900 Active 79 DOM
-
2026-06-01days on market $129,900 Active 77 DOM
-
2026-05-31days on market $129,900 Active 76 DOM
-
2026-04-28price $129,900
-
2026-03-16$139,900 Active
-
1984-12-01soldstatus $57,900
ⓘ Source: listings_history table (triggers on properties + properties_extension) + one-shot
backfill from property_details.listing_events for pre-trigger history.
Tax reassessment forecast FL · Resets to sale price
- Current annual tax
- $2,363 · $197/mo
- Projected year-2 tax
- $2,363 · $197/mo
- Expected delta
- $0/yr ($0/mo · 0.0%)
ⓘ Screening estimate from a state-policy table — verify with the county assessor before closing.
Climate risk First Street
- Flood 1/10 Low FEMA zone X (unshaded) · 0% chance over 30 yrs
- Wildfire 1/10 Low
- Heat 10/10 Extreme 7 d/yr ≥107°F today · 28 d/yr by 30 yrs out
- Wind 10/10 Extreme 99% chance of damaging wind over 30 yrs
- Air quality 3/10 Moderate 3 unhealthy d/yr today · 3 by 30 yrs out
Nearby sold comps map
Loading sold comps map…
Walkable amenities ~0.75 mi
Loading nearby amenities…
Taxation est. · year 1
- Rental income
- $21,815
- − Mortgage interest
- −$7,276
- − Property taxes
- −$2,363
- − Insurance
- −$650
- − Repairs & maintenance
- −$1,745
- − Management
- −$1,745
- − HOA
- −$7,644
- − Depreciation
- −$3,779
- Taxable loss
- −$3,387
- Est. tax savings @ 24.0%
- +$813
- After-tax cash flow
- $-784/yr
For passive investors: Depreciation is non-cash, so a rental often shows a tax loss while cash-flowing — sheltering income. Rental losses are passive: they offset passive income freely, and up to $25,000/yr can offset ordinary (W-2) income if you actively participate and your MAGI is under $100k (phasing out to $0 by $150k); unused losses carry forward. On sale, claimed depreciation is recaptured at up to 25%, and gains may owe capital-gains tax (a 1031 exchange can defer both). Figures are a year-1 estimate at your 24.0% rate — not tax advice; consult a CPA.
Schools (NCES district)
- District
- Pinellas
- NCES district ID
- 1201560
- Math proficiency
- 51% ▼ -5.00%
- Reading proficiency
- 51% ▼ -3.00%
- Median HH income
- $46,270
- Composite
- 43.27/100
- National rank
- #3046
- State rank
- #31 of 73 in FL
Livability — Dunedin
- Score
- 86/100
- State rank
- #15
- US rank
- #411
Category grades
Schools grade is shown separately in the Schools card above.
Census & demographics
- County
- Pinellas County · 939,478 people
- City population
- 38,171
- Metro
- Tampa-St. Petersburg-Clearwater, FL
- Population (ZIP)
- 18,290
- Household income
- $74,728
- Rent vs Own
- Severe rent burden
- 336.0
Population outlook (Pinellas County) Hauer SSP2
- Today (2025)
- 1,027,532 people
- By 2030
- 1,063,586 · +3.5%
- By 2040
- 1,125,020 · +9.5%
- By 2050
- 1,168,637 · +13.7%
- By 2075
- 1,265,188 · +23.1%
- By 2100
- 1,260,357 · +22.7%
Race, ethnicity, and origin ACS 2023
- Neighborhood character
- Predominantly White (86%)
- Race & ethnicity
- White 86% Hispanic / Latino 7% Two or more races 6% Asian 4%
- Hispanic origin (detail)
- Puerto Rican 1% Cuban 1%
- Common ancestry
- Romanian 5% Lithuanian 4% Italian 2%
- Foreign-born
- 15% · Canada, Jamaica, Vietnam
- Languages at home
- 83% English-only · Spanish 5% Russian/Polish/Slavic 4% Other Indo-European 3%
Political lean MEDSL · Pinellas
- 2024 margin
- Lean R (+5.2) · D 46.9% · R 52.1%
- 2008→2024 swing
- -13.5pp toward R · 2008: 8.3pp · 2024: -5.2pp
- All cycles
- 2024: R+5.2 2020: D+0.2 2016: R+1.1 2012: D+5.6 2008: D+8.3
Not yet ingested
- Civics
- —
Market trends
- HPI YoY
- ▼ -316.31%
- Current HPI
- 281.6948
- Rent YoY
- ▲ 0.11%
- Metro
- Tampa-St. Petersburg-Clearwater, FL
- State GDP YoY
- ▲ 3.28%
- F500 in state
- 36
Industry mix (Fortune 500 HQ in FL)
| Industry | F500 HQs | Revenue |
|---|---|---|
| Industrial Technology | 2 | $29B |
|
||
| Insurance | 2 | $17B |
|
||
| Retail | 1 | $60B |
|
||
| Technology Distribution | 1 | $58B |
|
||
| Homebuilding | 1 | $35B |
|
||
| Technology Manufacturing | 1 | $35B |
|
||
Price history
+124.4% since first listed3 events — show timeline
- 2026-04-28 Price Changed $129,900 Stellar MLS as Distributed by MLS Grid
- 2026-03-16 Listed $139,900 Stellar MLS as Distributed by MLS Grid
- 1984-12-01 Sold (Public Records) $57,900 Public Records
Property tax history
+5.8%/yrLatest (2025): $2,363 · +0.3% YoY. Source: county tax records.
Cash-flow waterfall
monthlySold comps — $/sqft
last 12 mo · ≤1 miLoading sold comps…