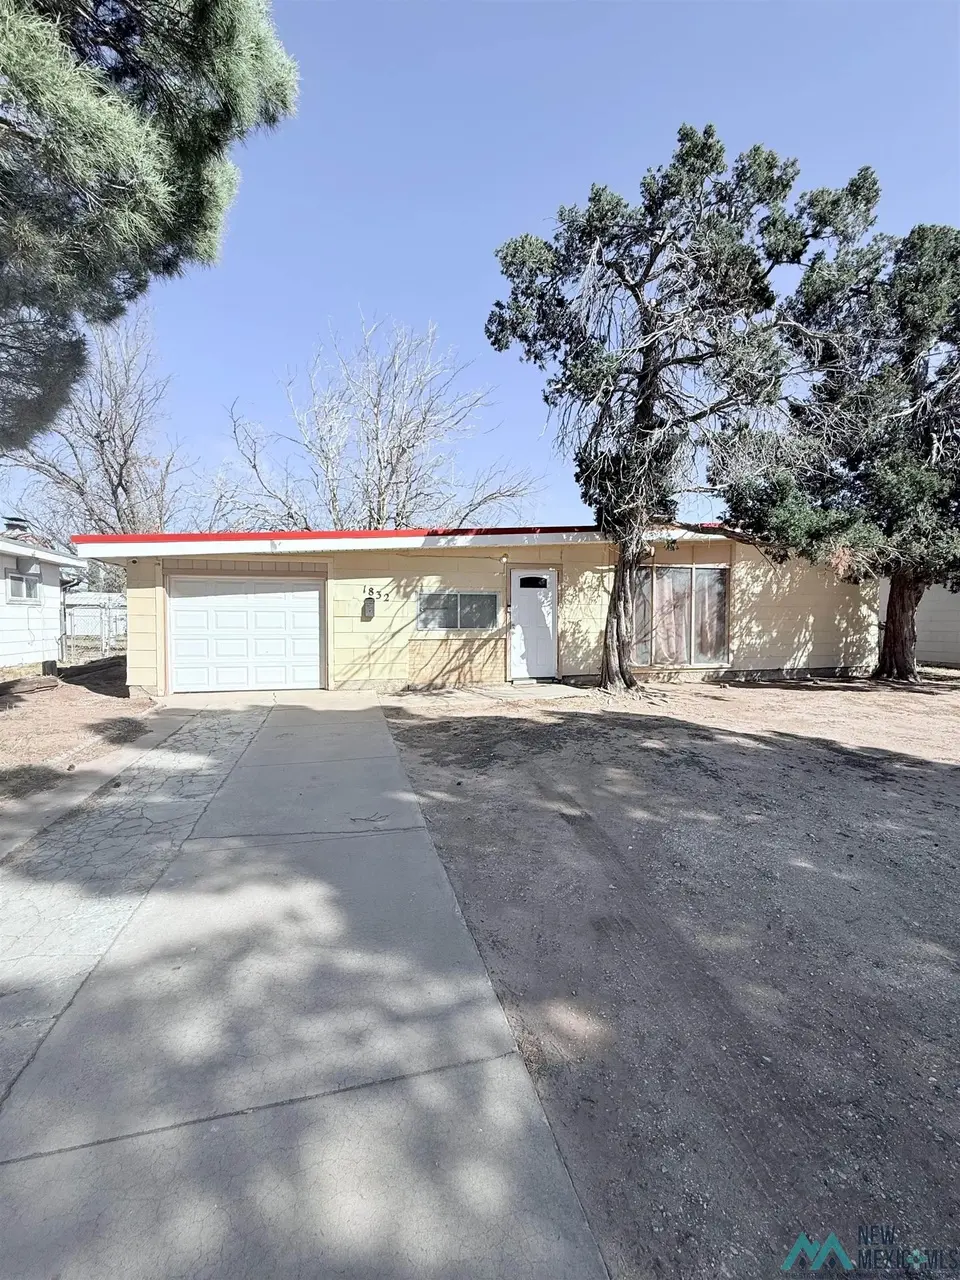
1832 N Penasco Dr · Hobbs, NM
Flood risk 5/10 · Moderate
- FEMA flood zone
- X (unshaded)
- Chance of flooding over 30 yrs
- 0.63%
- Est. flood insurance / yr
- $507 – $1,088
Fire risk 8/10 · Major
- Est. fire insurance / yr
- $706 – $1,312
Heat risk 5/10 · Moderate
- Hot days now (above 100°F)
- 7 days/yr
- Hot days in 30 yrs
- 17 days/yr
Wind risk 2/10 · Minimal
- Chance of severe wind over 30 yrs
- 1.0%
Air-quality risk 2/10 · Minimal
- Unhealthy air days now
- 1 days/yr
- Unhealthy air days in 30 yrs
- 1 days/yr
Risk factors via First Street. Map © Google.
Why this score? — see what drove the D grade
The composite is a weighted blend of 9 inputs, each scored 0–100. Each bar is that input's sub-score; the figure is the points it added to the 100-point composite (weight × sub-score).
- Cash flow +21.2/30.0
- DSCR +6.7/10.0
- 1% rule +4.5/10.0
- Livability +3.3/5.0
- Rent growth +2.5/5.0
- Schools +2.5/10.0
- Condition / age +2.5/5.0
- ARV discount +0.0/15.0
- Appreciation +0.0/10.0
$160,000
🖨 Deal sheet (PDF) 📄 Offer letter ✓ Due diligence
Listing remarks MLS
Check out this home in an established neighborhood, near Hobbs High and with a large backyard. Home has 3 bedrooms, 1 bathroom, 1 car garage and 2 l living areas. It has a metal roof and central heating and cooling. Call to make this your first home or investment.
Key facts
- Metal roof
- Large backyard
- 7,500 sq ft lot
Tags
Neighborhood map
What this means for you Summary
Snapshot
- This is a 3-bed/1.0-bath single-family listed at $160k.
Deal economics
- At list price, monthly cash flow is $230 ($3k/yr) — positive.
- The deal already cash-flows at list — no discount required.
- To meet the 1% rule (rent ≥ 1% of price), the offer needs to be $152k (5.2% below list).
- Recommended offer: $150k (6.0% below list) — sets the bar for market timing.
Location & tenants
- Location reads 66/100 on livability (#37 in NM) — a middle-class / working-renter tenant base. Strengths: cost of living A+, housing A+; Watch: employment D+, crime F, commute F.
- Hobbs Municipal Schools (town): math 17% / reading 31% proficiency, ranked #45 of 95 in NM (top 47%) — low school quality limits family demand, transient renter base, plan for 1-2y turnover.
- Zoned schools: Taylor Elementary (421 students, 100% FRL); Highland Middle School (840 students, 100% FRL); Hobbs High (math 22% / reading 52%, grade F, #70 of 110 statewide, top 63%, 2,216 students, 100% FRL) — zoned schools average 100% FRL vs 52% district-wide (48 pts higher); higher-poverty schools than district average — tighter screening recommended.
- Zoned-school proficiency averages 37% at this address vs 24% district-wide (+13 pts) — the actual schools serving this property are materially stronger than the Hobbs Municipal Schools average implies; a family-tenant draw the district grade alone would hide.
- Market conditions: 235 active listings in the ZIP; 1 comparable units currently listed for rent nearby; 172 units permitted in Lea County in 2024 (0 in 5+ unit buildings).
Forward outlook
- Local home prices are declining (-3.0%/yr); year-one equity from $1k of loan paydown is wiped out by about $5k of value loss. Plan a longer hold.
- Lea County population projected at +50% by 2050 — long-run rental-demand tailwind backs the buy-and-hold thesis.
Negotiation context
- It's been on market 74 days — a 6% lower offer ($150k) is reasonable based on typical stale-listing flexibility.
- 2 sale attempts since 10y ago with the ask held roughly flat each time — persistent listings suggest the price (not the market) is what's stuck; bring a comps-based counter.
Risks & watch-outs
- Watch-outs: built in 1955 — expect roof / HVAC / electrical / plumbing capex.
- Climate carrying-cost: moderate flood risk; severe wildfire risk; extreme-heat days projected 7→17/yr by 2055 (HVAC capex compounding) — expect insurance premiums to compound above CPI over the hold.
Questions for the listing agent
- It's been on market 74 days. Have you received any prior offers? Is the seller open to a 6% concession, seller financing, or rate buy-down credit?
- Built in 1955 — when were the roof, HVAC, electrical panel, plumbing, and water heater last replaced?
- Why hasn't it sold? Are there any deal-killer items the seller is aware of (foundation, flood, title, zoning, code violations)?
- Is there a deadline driving the sale (1031 exchange, divorce, estate, relocation)? That informs how much negotiation room exists.
- Schools are F-rated, which usually means shorter tenancies and higher turnover. Who's the typical renter profile here, and what's been the actual vacancy rate?
- Crime grade is F in this area — have there been break-ins, vandalism, or insurance claims at this property in the last 3 years? What carrier currently insures it and at what premium?
- The area grade is low — what's the realistic commute time and amenity access for the typical tenant pool here? Any planned neighborhood developments (good or bad) we should know about?
- What's the average days-on-market for RENTAL listings here right now (not sales)? A rising rental-DOM trend means longer vacancies and softer asking-rent achievability than the comps imply.
- What's the recent tenant-quality profile in this submarket — average credit score on applications, eviction rate, late-payment / NSF rate, and stable-employment percentage? A property-management company in the area should have these aggregated.
- How much new for-sale + rental construction is in the pipeline within 1–3 miles? Heavy new supply typically softens prices + rents 12–24 months out; constrained supply supports both.
Investment metrics
- 1% rule
- 0.95% ✗
- Cap rate
- 8.02%
- Cash-on-cash
- 6.16%
- DSCR
- 1.27
- GRM
- 8.8
CMA / ARV
- ARV (median comp)
- $116,380
- List price
- $160,000
- Delta
- 37.48%
- Verdict
- OVERPRICED
- Comps
- 2 within 1.0 mi
Show comp detail 1 sale within ~0.75 mi
| Address | Dist | Beds/Ba | Sqft | Sold | Price | $/sf | Match |
|---|---|---|---|---|---|---|---|
| 1900 N Penasco Dr | 0.02mi | 3/2.0 | 1,319 (+12%) | 6mo | $120,000 | $91 | 70 |
Match score weights: distance 35% · size 25% · config 20% · recency 20%. Top-matched comps best support the ARV.
Projected returns pro-forma
-3.0% appreciation · 3.0% rent growth · sell at horizon
- IRR
- -6.8%
- Equity multiple
- 0.75×
- Total profit
- $-11,343
- Equity at exit
- $23,857
- IRR
- 2.7%
- Equity multiple
- 1.19×
- Total profit
- $8,730
- Equity at exit
- $13,834
Cash invested: $44,800 (down + closing). Projections, not guarantees.
Landlord ↔ Tenant lean methodology
- Overall (STATE)
- 55 Moderately Landlord-Leaning
- State New Mexico
- 55 Moderately Landlord-Leaning · D+3
- County
- — inherits STATE
- City
- — inherits STATE
ZIP-level market 88240
- Active inventory
- 235
- Price-to-rent
- 8.8×
Monthly cashflow live
- Estimated rent
- $1,516 medium interval (Pro) →
- Mortgage (P&I)
- −$839
- Tax from tax record
- −$62 /mo · $748/yr
- Insurance
- −$67
- HOA
- −$0
- Vacancy / Maint / Mgmt
- −$318
- Net cashflow
- $230
Break-even live
Sensitivity live
| Price | -10% $321 | -5% $275 | +0% $230 | +5% $185 | +10% $139 |
|---|---|---|---|---|---|
| Rent | -10% $110 | -5% $170 | +0% $230 | +5% $290 | +10% $350 |
| Rate | -1.0pp $311 | -0.5pp $271 | base $230 | +0.5pp $188 | +1.0pp $146 |
UW: 25.0% down · 7.5% · 30yr · 1.5% tax · 5.0% vac · 8.0% maint · 8.0% mgmt
Financing live
Cash to close
- Down payment
- $40,000
- Closing costs
- $4,800
- Reserves months
- —
- Total cash needed
- —
Loan-product check · same deal, 3 products live
Conventional
25% down · 7.5% · 30yr
- Down + closing
- —
- Monthly P&I
- —
- Monthly cashflow
- —
- DSCR
- —
- Eligible?
- —
Personal DTI + credit; lowest rate.
DSCR
20% down · 8.5% · 30yr
- Down + closing
- —
- Monthly P&I
- —
- Monthly cashflow
- —
- DSCR
- —
- Eligible?
- —
No personal income docs; deal must DSCR.
Hard money
10% down · 12.0% · 12mo
- Down + closing
- —
- Monthly P&I
- —
- Monthly cashflow
- —
- DSCR
- —
- Eligible?
- —
Short-term bridge; refi at stabilization.
Rent comps 1 comps
| Address | Beds | Baths | Sqft | Rent | $/sqft | DOM | Units | Dist |
|---|---|---|---|---|---|---|---|---|
| 1122 3 E Broadway St Unit B-302 Hobbs, NM | 3.0 | 2.0 | 976 | $1,200 | $1.23 | 45d | 1 | 1.37mi |
Listing history 4 events
-
2026-03-09$160,000 Active 264-char remark
Show marketing remark (264 chars)
Check out this home in an established neighborhood, near Hobbs High and with a large backyard. Home has 3 bedrooms, 1 bathroom, 1 car garage and 2 l living areas. It has a metal roof and central heating and cooling. Call to make this your first home or investment.
-
2017-03-13soldstatus 237-char remark
Show marketing remark (237 chars)
Beautiful home with a lot of recent upgrades. Home has new kitchen tile, blinds, interior doors, and closet doors. New metal roof will be installed before closing. Seller is offering one year home warranty contract with acceptable offer.
-
2016-08-04$82,000 237-char remark
Show marketing remark (237 chars)
Beautiful home with a lot of recent upgrades. Home has new kitchen tile, blinds, interior doors, and closet doors. New metal roof will be installed before closing. Seller is offering one year home warranty contract with acceptable offer.
-
2006-10-31soldstatus
ⓘ Source: listings_history table (triggers on properties + properties_extension) + one-shot
backfill from property_details.listing_events for pre-trigger history.
Tax reassessment forecast NM · Resets to sale price
- Current annual tax
- $748 · $62/mo
- Projected year-2 tax
- $1,280 · $107/mo
- Expected delta
- +$532/yr (+$44/mo · 71.0%)
ⓘ Screening estimate from a state-policy table — verify with the county assessor before closing.
Climate risk First Street
- Flood 5/10 Major FEMA zone X (unshaded) · 63% chance over 30 yrs
- Wildfire 8/10 Severe
- Heat 5/10 Major 7 d/yr ≥100°F today · 17 d/yr by 30 yrs out
- Wind 2/10 Low 100% chance of damaging wind over 30 yrs
- Air quality 2/10 Low 1 unhealthy d/yr today · 1 by 30 yrs out
Nearby sold comps map
Loading sold comps map…
Walkable amenities ~0.75 mi
Loading nearby amenities…
Taxation est. · year 1
- Rental income
- $18,198
- − Mortgage interest
- −$8,962
- − Property taxes
- −$748
- − Insurance
- −$800
- − Repairs & maintenance
- −$1,456
- − Management
- −$1,456
- − Depreciation
- −$4,655
- Taxable income
- $121
- Est. tax owed @ 24.0%
- −$29
- After-tax cash flow
- $2,730/yr
For passive investors: Depreciation is non-cash, so a rental often shows a tax loss while cash-flowing — sheltering income. Rental losses are passive: they offset passive income freely, and up to $25,000/yr can offset ordinary (W-2) income if you actively participate and your MAGI is under $100k (phasing out to $0 by $150k); unused losses carry forward. On sale, claimed depreciation is recaptured at up to 25%, and gains may owe capital-gains tax (a 1031 exchange can defer both). Figures are a year-1 estimate at your 24.0% rate — not tax advice; consult a CPA.
Schools (NCES district)
- District
- Hobbs Municipal Schools
- NCES district ID
- 3501260
- Math proficiency
- 17% —
- Reading proficiency
- 31% —
- Median HH income
- $52,575
- Composite
- 24.53/100
- National rank
- #13068
- State rank
- #45 of 95 in NM
Livability — Hobbs
- Score
- 66/100
- State rank
- #37
- US rank
- #11817
Category grades
Schools grade is shown separately in the Schools card above.
Census & demographics
- Census place
- Hobbs, NM
- County
- Lea County · 41,557 people
- City population
- 41,557
- Metro
- Hobbs, NM
- Population (ZIP)
- 41,557
- Household income
- $63,270
- Rent vs Own
- Severe rent burden
- 968.0
Population outlook (Lea County) Hauer SSP2
- Today (2025)
- 84,268 people
- By 2030
- 91,695 · +8.8%
- By 2040
- 108,366 · +28.6%
- By 2050
- 126,264 · +49.8%
- By 2075
- 170,606 · +102.5%
- By 2100
- 199,235 · +136.4%
Race, ethnicity, and origin ACS 2023
- Neighborhood character
- Majority Hispanic (63%)
- Race & ethnicity
- Hispanic / Latino 63% Two or more races 32% White 29% Black 5%
- Hispanic origin (detail)
- Mexican 55%
- Common ancestry
- Italian 2% Lithuanian 1% Slovak 1%
- Foreign-born
- 18% · Canada
- Languages at home
- 57% English-only · Spanish 41% German/W. Germanic 1%
Political lean MEDSL · Lea
- 2024 margin
- Solid R (+61.6) · D 18.5% · R 80.1% · Other 1.3%
- 2008→2024 swing
- -17.4pp toward R · 2008: -44.2pp · 2024: -61.6pp
- All cycles
- 2024: R+61.6 2020: R+59.6 2016: R+48.5 2012: R+49.7 2008: R+44.2
Not yet ingested
- Civics
- —
Market trends
- HPI YoY
- ▼ -246.71%
- Current HPI
- 100.9905
- Rent YoY
- —
- Metro
- Hobbs, NM
- State GDP YoY
- —
- F500 in state
- 0
Price history
+95.1% since first listed4 events — show timeline
- 2026-03-09 Listed $160,000 NMMLS
- 2017-03-13 Sold (MLS) — NMMLS
- 2016-08-04 Listed $82,000 NMMLS
- 2006-10-31 Sold (Public Records) — Public Records
Property tax history
+3.8%/yrLatest (2025): $748 · +1.7% YoY. Source: county tax records.
Cash-flow waterfall
monthlySold comps — $/sqft
last 12 mo · ≤1 miLoading sold comps…