 Duplex
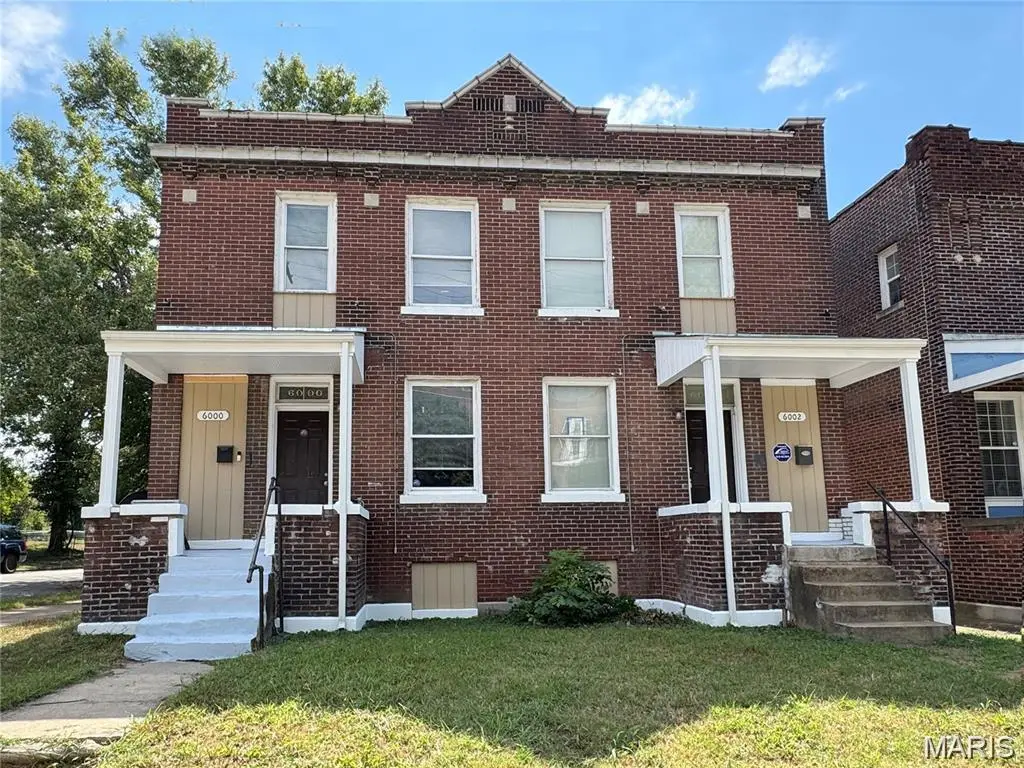
6000-6002 Etzel Ave · St. Louis, MO
Flood risk 1/10 · Minimal
- FEMA flood zone
- X (unshaded)
- Chance of flooding over 30 yrs
- 0.0%
- Est. flood insurance / yr
- $473 – $860
Fire risk 1/10 · Minimal
- Est. fire insurance / yr
- $1,054 – $1,958
Heat risk 5/10 · Moderate
- Hot days now (above 107°F)
- 7 days/yr
- Hot days in 30 yrs
- 21 days/yr
Wind risk 2/10 · Minimal
- Chance of severe wind over 30 yrs
- 1.0%
Air-quality risk 4/10 · Minor
- Unhealthy air days now
- 4 days/yr
- Unhealthy air days in 30 yrs
- 5 days/yr
Risk factors via First Street. Map © Google.
Why this score? — see what drove the B- grade
The composite is a weighted blend of 9 inputs, each scored 0–100. Each bar is that input's sub-score; the figure is the points it added to the 100-point composite (weight × sub-score).
- Cash flow +30.0/30.0
- 1% rule +10.0/10.0
- DSCR +10.0/10.0
- ARV discount +7.5/15.0
- Condition / age +4.0/5.0
- Rent growth +3.1/5.0
- Livability +2.5/5.0
- Schools +1.2/10.0
- Appreciation +0.0/10.0
$270,000
🖨 Deal sheet 📄 Offer letter ✓ Due diligence
Multi-family units
County records classify this as Multi-Family (2-4 Unit). Listing-text estimate: 2 units. confirmed
Listing remarks MLS
This fully updated duplex presents an excellent opportunity for investors and owner-occupants alike. One unit is already leased to a Section 8 tenant at $1,710 per month, offering immediate, dependable income. The second unit is vacant and ready for occupancy and perfect for an owner-occupant or for leasing at an estimated $1,500-$1,600 per month. The occupied unit features four generously sized bedrooms and two full bathrooms, while the vacant unit includes three bedrooms and one and a half bathrooms. Both thoughtfully designed for comfortable living. Each unit offers first-floor laundry, updated kitchens and bathrooms with modern finishes, and brand-new dishwashers. Additional recent upgrades include new flooring in kitchens and baths, along with newer central air systems. Ideally located just minutes from the Delmar Loop, Forest Park, and Washington University, this property provides easy access to top dining, shopping, entertainment, and major employment hubs. The vacant unit at 6002 Etzel is available for showings, while the occupied unit at 6000 Etzel may be viewed with an accepted contract.
Key facts
- 4,591 sq ft lot
- Built 1915
- Listed 74 days
Neighborhood map
What this means for you Summary
Snapshot
- This is a 1×4bd/2.5ba + 1×3bd/1.5ba units multifamily listed at $270k. Condition is rated good.
Deal economics
- At list price, monthly cash flow is $2k ($18k/yr) — positive. Per door: $759/mo.
- The deal already cash-flows at list — no discount required.
- Meets the 1% rule at list price ($4k rent vs $270k).
- Recommended offer: $254k (6.0% below list) — sets the bar for market timing.
- Cap rate 13.0% vs local median 5.0% in St. Louis — top-decile yield for the area; either an underpriced asset or a hidden risk that comps aren't pricing in. Stress-test before assuming the spread holds.
Location & tenants
- Location reads: area grade B — affects rentability + tenant quality, not the cash-flow math above.
- St. Louis City (urban): math 10% / reading 18% proficiency, ranked #312 of 324 in MO (top 96%) — low school quality limits family demand, transient renter base, plan for 1-2y turnover; 80% free/reduced lunch — lower-income household profile, screen leases tightly.
- Market conditions: Rents rising (+2.4%/yr); 118 active listings in the ZIP; 294 units permitted in St. Louis city in 2024 (227 in 5+ unit buildings).
- At $4,283/mo this rent would consume 113% of the median local household income ($46k/yr) (locally 1457% of renters already pay >50% of income on rent) — very limited rent-growth headroom before tenants either downsize or default.
Forward outlook
- Local home prices are declining (-3.0%/yr); year-one equity from $2k of loan paydown is wiped out by about $8k of value loss. Plan a longer hold.
- St. Louis County population projected to shrink 6% by 2050 — rents likely to lag national; underwrite the cash flow, not the appreciation.
- At projected returns (-3.0% appreciation + 2.4% rent growth), your $76k cash investment doubles in ~6 years — after that, you're playing with house money.
Negotiation context
- It's been on market 75 days — a 6% lower offer ($254k) is reasonable based on typical stale-listing flexibility.
Risks & watch-outs
- Watch-outs: built in 1915 — expect roof / HVAC / electrical / plumbing capex.
- Climate carrying-cost: extreme-heat days projected 7→21/yr by 2055 (HVAC capex compounding) — expect insurance premiums to compound above CPI over the hold.
Questions for the listing agent
- It's been on market 75 days. Have you received any prior offers? Is the seller open to a 6% concession, seller financing, or rate buy-down credit?
- Can we see the unit-by-unit rent roll, current vacancy, and any below-market leases? What's the average tenancy length?
- What capital expenditures (roof, boiler, parking lot, exteriors) have been made in the last 5 years, and what's planned in the next 2?
- Built in 1915 — when were the roof, HVAC, electrical panel, plumbing, and water heater last replaced?
- Why hasn't it sold? Are there any deal-killer items the seller is aware of (foundation, flood, title, zoning, code violations)?
- Is there a deadline driving the sale (1031 exchange, divorce, estate, relocation)? That informs how much negotiation room exists.
- What's the average days-on-market for RENTAL listings here right now (not sales)? A rising rental-DOM trend means longer vacancies and softer asking-rent achievability than the comps imply.
- What's the recent tenant-quality profile in this submarket — average credit score on applications, eviction rate, late-payment / NSF rate, and stable-employment percentage? A property-management company in the area should have these aggregated.
- How much new apartment / multifamily construction is in the pipeline within 1–3 miles? Heavy new supply (>2% of stock underway) typically softens rents 12–24 months out; light construction supports rent growth.
Investment metrics
- 1% rule
- 1.59% ✓
- Cap rate
- 13.04%
- Cash-on-cash
- 24.09%
- DSCR
- 2.07
- GRM
- 5.3
CMA / ARV
- ARV (median comp)
- $149,672
- List price
- $270,000
- Delta
- 80.39%
- Verdict
- OVERPRICED
- Comps
- 20 within 1.0 mi
Show comp detail 4 sales within ~0.75 mi
| Address | Dist | Beds/Ba | Sqft | Sold | Price | $/sf | Match |
|---|---|---|---|---|---|---|---|
| 6312 Cates Ave | 0.73mi | 8/4.0 | 3,740 (-0%) | 11mo | $532,000 | $142 | 53 |
| 908 Eastgate Ave | 0.60mi | 8/4.0 | 3,852 (+3%) | 19mo | $545,000 | $141 | 47 |
| 6262 North Dr | 0.64mi | 8/4.0 | 3,972 (+6%) | 18mo | $589,000 | $148 | 41 |
| 914 Eastgate Ave | 0.59mi | 8/4.0 | 3,456 (-8%) | 23mo | $599,000 | $173 | 36 |
Match score weights: distance 35% · size 25% · config 20% · recency 20%. Top-matched comps best support the ARV.
Projected returns pro-forma
-3.0% appreciation · 2.39% rent growth · sell at horizon
- IRR
- 16.7%
- Equity multiple
- 1.67×
- Total profit
- $50,361
- Equity at exit
- $40,258
- IRR
- 24.8%
- Equity multiple
- 3.09×
- Total profit
- $157,991
- Equity at exit
- $23,345
Cash invested: $75,600 (down + closing). Projections, not guarantees.
Landlord ↔ Tenant lean methodology
- Overall (STATE)
- 81 Strongly Landlord-Friendly
- State Missouri
- 81 Strongly Landlord-Friendly · R+10
- County
- — inherits STATE
- City
- — inherits STATE
ZIP-level market 63112
- Rents YoY
- 2.4%
- Active inventory
- 118
- Price-to-rent
- 10.1×
Monthly cashflow live
- Estimated rent
- $4,283 high interval (Pro) →
- Mortgage (P&I)
- −$1,416
- Tax est. 1.5%
- −$338 /mo · $4,050/yr
- Insurance
- −$112
- HOA
- −$0
- Vacancy / Maint / Mgmt
- −$899
- Net cashflow
- $1,518
Break-even live
2-unit breakdown (identical units grouped — click to expand)
| Units | Beds | Baths | Est. rent |
|---|---|---|---|
| 1× unit | 4 | 2.5 | $2,228 |
| 1× unit | 3 | 1.5 | $2,055 |
| Total (2 units) | $4,283 | ||
UW: 25.0% down · 7.5% · 30yr · 1.5% tax · 5.0% vac · 8.0% maint · 8.0% mgmt
Financing live
Cash to close
- Down payment
- $67,500
- Closing costs
- $8,100
- Reserves months
- —
- Total cash needed
- —
Loan-product check · same deal, 3 products live
Conventional
25% down · 7.5% · 30yr
- Down + closing
- —
- Monthly P&I
- —
- Monthly cashflow
- —
- DSCR
- —
- Eligible?
- —
Personal DTI + credit; lowest rate.
DSCR
20% down · 8.5% · 30yr
- Down + closing
- —
- Monthly P&I
- —
- Monthly cashflow
- —
- DSCR
- —
- Eligible?
- —
No personal income docs; deal must DSCR.
Hard money
10% down · 12.0% · 12mo
- Down + closing
- —
- Monthly P&I
- —
- Monthly cashflow
- —
- DSCR
- —
- Eligible?
- —
Short-term bridge; refi at stabilization.
Listing history 15 events
-
2026-06-18days on market $270,000 Active 75 DOM
-
2026-06-17days on market $270,000 Active 74 DOM
-
2026-06-16days on market $270,000 Active 73 DOM
-
2026-06-15days on market $270,000 Active 72 DOM
-
2026-06-13days on market $270,000 Active 70 DOM
-
2026-06-09days on market $270,000 Active 66 DOM
-
2026-06-08days on market $270,000 Active 65 DOM
-
2026-06-08days on market $270,000 Active 64 DOM
-
2026-06-05days on market $270,000 Active 61 DOM
-
2026-06-03days on market $270,000 Active 60 DOM
-
2026-06-02days on market $270,000 Active 59 DOM
-
2026-06-01days on market $270,000 Active 58 DOM
-
2026-05-31days on market $270,000 Active 57 DOM
-
2026-04-05$270,000 Active 1114-char remark
Show marketing remark (1114 chars)
This fully updated duplex presents an excellent opportunity for investors and owner-occupants alike. One unit is already leased to a Section 8 tenant at $1,710 per month, offering immediate, dependable income. The second unit is vacant and ready for occupancy and perfect for an owner-occupant or for leasing at an estimated $1,500-$1,600 per month. The occupied unit features four generously sized bedrooms and two full bathrooms, while the vacant unit includes three bedrooms and one and a half bathrooms. Both thoughtfully designed for comfortable living. Each unit offers first-floor laundry, updated kitchens and bathrooms with modern finishes, and brand-new dishwashers. Additional recent upgrades include new flooring in kitchens and baths, along with newer central air systems. Ideally located just minutes from the Delmar Loop, Forest Park, and Washington University, this property provides easy access to top dining, shopping, entertainment, and major employment hubs. The vacant unit at 6002 Etzel is available for showings, while the occupied unit at 6000 Etzel may be viewed with an accepted contract.
-
2026-03-31historical $270,000 1114-char remark
Show marketing remark (1114 chars)
This fully updated duplex presents an excellent opportunity for investors and owner-occupants alike. One unit is already leased to a Section 8 tenant at $1,710 per month, offering immediate, dependable income. The second unit is vacant and ready for occupancy and perfect for an owner-occupant or for leasing at an estimated $1,500-$1,600 per month. The occupied unit features four generously sized bedrooms and two full bathrooms, while the vacant unit includes three bedrooms and one and a half bathrooms. Both thoughtfully designed for comfortable living. Each unit offers first-floor laundry, updated kitchens and bathrooms with modern finishes, and brand-new dishwashers. Additional recent upgrades include new flooring in kitchens and baths, along with newer central air systems. Ideally located just minutes from the Delmar Loop, Forest Park, and Washington University, this property provides easy access to top dining, shopping, entertainment, and major employment hubs. The vacant unit at 6002 Etzel is available for showings, while the occupied unit at 6000 Etzel may be viewed with an accepted contract.
ⓘ Source: listings_history table (triggers on properties + properties_extension) + one-shot
backfill from property_details.listing_events for pre-trigger history.
Climate risk First Street
- Flood 1/10 Low FEMA zone X (unshaded) · 0% chance over 30 yrs
- Wildfire 1/10 Low
- Heat 5/10 Major 7 d/yr ≥107°F today · 21 d/yr by 30 yrs out
- Wind 2/10 Low 100% chance of damaging wind over 30 yrs
- Air quality 4/10 Moderate 4 unhealthy d/yr today · 5 by 30 yrs out
Nearby sold comps map
Loading sold comps map…
Walkable amenities ~0.75 mi
Loading nearby amenities…
Taxation est. · year 1
- Rental income
- $51,396
- − Mortgage interest
- −$15,124
- − Property taxes
- −$4,050
- − Insurance
- −$1,350
- − Repairs & maintenance
- −$4,112
- − Management
- −$4,112
- − Depreciation
- −$7,855
- Taxable income
- $14,794
- Est. tax owed @ 24.0%
- −$3,551
- After-tax cash flow
- $14,661/yr
For passive investors: Depreciation is non-cash, so a rental often shows a tax loss while cash-flowing — sheltering income. Rental losses are passive: they offset passive income freely, and up to $25,000/yr can offset ordinary (W-2) income if you actively participate and your MAGI is under $100k (phasing out to $0 by $150k); unused losses carry forward. On sale, claimed depreciation is recaptured at up to 25%, and gains may owe capital-gains tax (a 1031 exchange can defer both). Figures are a year-1 estimate at your 24.0% rate — not tax advice; consult a CPA.
Condition & rehab AI · 12 photos
This fully updated duplex presents an excellent opportunity for investors and owner-occupants alike. Both units are move-in ready with modern finishes and updated kitchens and bathrooms.
Value-add opportunities
- Both Paint exterior — Enhances curb appeal and resale value
- Both Replace ceiling fans — Improves energy efficiency and aesthetics
Renovation cost estimate screening
Value-add ROI direction
- Both Paint exterior — Enhances curb appeal and resale value ↑
- Both Replace ceiling fans — Improves energy efficiency and aesthetics ↑
ⓘ Cost ranges are severity-bucket heuristics (US national rule-of-thumb). Get contractor quotes + a written scope before underwriting a rehab budget.
Schools (NCES district)
- District
- St. Louis City
- NCES district ID
- 2929280
- Math proficiency
- 10% ▼ -6.00%
- Reading proficiency
- 18% ▼ -3.00%
- Median HH income
- $35,685
- Composite
- 11.54/100
- National rank
- #9699
- State rank
- #312 of 324 in MO
Livability — St. Louis
No livability data for this city. (Only ~50 U.S. cities are tracked.)
Census & demographics
- Census place
- St. Louis, MO
- County
- Saint Louis City · 254,015 people
- City population
- 283,259
- Metro
- St. Louis, MO-IL
- Population (ZIP)
- 17,985
- Household income
- $45,542
- Rent vs Own
- Severe rent burden
- 1457.0
Population outlook (St. Louis County) Hauer SSP2
- Today (2025)
- 315,737 people
- By 2030
- 313,865 · -0.6%
- By 2040
- 305,439 · -3.3%
- By 2050
- 296,529 · -6.1%
- By 2075
- 271,028 · -14.2%
- By 2100
- 255,359 · -19.1%
Race, ethnicity, and origin ACS 2023
- Neighborhood character
- Majority Black (63%)
- Race & ethnicity
- Black 63% White 24% Asian 6% Two or more races 5% Hispanic / Latino 4%
- Common ancestry
- Lithuanian 1% Scotch-Irish 1% Romanian 1%
- Foreign-born
- 9% · China, South Korea, Canada
- Languages at home
- 88% English-only · Spanish 3% Chinese 2% Korean 2%
Political lean MEDSL · St. Louis
- 2024 margin
- Solid D (+64.7) · D 81.4% · R 16.7% · Other 2.0%
- 2008→2024 swing
- -3.5pp toward R · 2008: 68.2pp · 2024: 64.7pp
- All cycles
- 2024: D+64.7 2020: D+66.2 2016: D+63.7 2012: D+66.6 2008: D+68.2
Not yet ingested
- Civics
- —
Market trends
- HPI YoY
- ▼ -158.94%
- Current HPI
- 115.1863
- Rent YoY
- ▲ 2.39%
- Metro
- St. Louis, MO-IL
- State GDP YoY
- ▲ 1.84%
- F500 in state
- 20
Industry mix (Fortune 500 HQ in MO)
| Industry | F500 HQs | Revenue |
|---|---|---|
| Healthcare | 1 | $163B |
|
||
| Insurance | 1 | $21B |
|
||
| Industrial Technology | 1 | $17B |
|
||
| Retail | 1 | $16B |
|
||
| Industrial Distribution | 1 | $10B |
|
||
| Utilities | 1 | $9B |
|
||
Price history
+0.0% since first listed2 events — show timeline
- 2026-04-05 Listed $270,000 MARIS as Distributed by MLS Grid
- 2026-03-31 Coming Soon $270,000 MARIS as Distributed by MLS Grid
Cash-flow waterfall
monthlySold comps — $/sqft
last 12 mo · ≤1 miLoading sold comps…