 Triplex
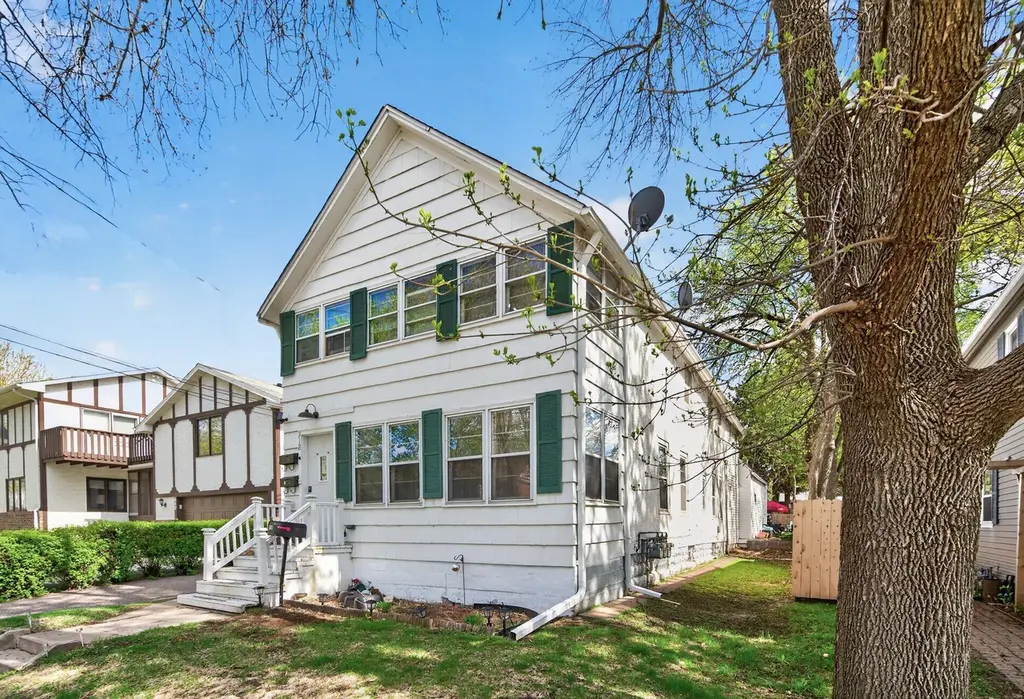
318 7th Ave NE · Minneapolis, MN
Flood risk 1/10 · Minimal
- FEMA flood zone
- X (unshaded)
- Chance of flooding over 30 yrs
- 0.0%
- Est. flood insurance / yr
- $473 – $860
Fire risk 1/10 · Minimal
- Est. fire insurance / yr
- $888 – $1,650
Heat risk 2/10 · Minimal
- Hot days now (above 100°F)
- 7 days/yr
- Hot days in 30 yrs
- 14 days/yr
Wind risk 2/10 · Minimal
- Chance of severe wind over 30 yrs
- —
Air-quality risk 2/10 · Minimal
- Unhealthy air days now
- 1 days/yr
- Unhealthy air days in 30 yrs
- 1 days/yr
Risk factors via First Street. Map © Google.
Why this score? — see what drove the C+ grade
The composite is a weighted blend of 9 inputs, each scored 0–100. Each bar is that input's sub-score; the figure is the points it added to the 100-point composite (weight × sub-score).
- Cash flow +30.0/30.0
- 1% rule +10.0/10.0
- DSCR +10.0/10.0
- Livability +3.9/5.0
- Rent growth +3.6/5.0
- Schools +3.5/10.0
- Condition / age +2.5/5.0
- ARV discount +0.0/15.0
- Appreciation +0.0/10.0
$475,000
🖨 Deal sheet 📄 Offer letter ✓ Due diligence
Multi-family units
County records classify this as Multi-Family (2-4 Unit). Listing-text estimate: 3 units. confirmed
Listing remarks MLS
Fantastic location in St. Anthony. Both units rented out. Updated interior in both units. Granite, stainless steel, new cabinets, updated bathrooms, carpet, paint. Each unit has brand new forced air furnace. Newer roof, detached garage. Property used to be a triplex. Back studio could be brough back to third unit. 24 hr. notice for showings.
Key facts
- Newer roof
- Triplex
- Updated kitchens
Tags
Property features AI
Finance
- Other: Neighborhood number 72
- Financial info: Property type: Residential income (triplex) with 3 units; Gross income reported at $43,200; Owner pays sewer, taxes, and trash collection; Water/sewer expense listed at $1,320; Trash expense listed at $600; Tenants pay cable TV, electricity, fuel, heat, lawn care, and water
- HOA & community: No HOA information provided
Exterior
- Parking: Gravel parking; Detached garage with 2 spaces (garage approx. 20 x 15)
- Security: No security features provided
- Utilities: City water connected; City sewer connected; Natural gas
- Home design: Residential income property (triplex); Two-story building; Above-grade finished area approximately 1,900 square feet
- Construction: Asphalt roof; Foundation is block; Building area total approximately 1,900 square feet; foundation area about 950
- Exterior features: Stucco and wood exterior; Lot dimensions about 40 x 132; Lot size approximately 0.12 acres
Interior
- Kitchen: Kitchens present in each unit (standard apartment kitchens)
- Bedrooms: Total of 5 bedrooms across units (individual unit breakdown below); Unit A: 2 bedrooms; Unit B: 2 bedrooms; Unit C: 1 bedroom
- Flooring: No flooring details provided
- Bathrooms: Unit A: 1 full bathroom; Unit B: 1 full bathroom plus 1 three-quarter bathroom; Unit C: 1 full bathroom
- Heating & cooling: Forced air heating
- Interior features: Full basement; Block foundation; Two levels
- Laundry & utility: No specific laundry details provided
Neighborhood map
What this means for you Summary
Snapshot
- This is a 3 × 5-bed/3.0-bath units multifamily listed at $475k.
Deal economics
- At list price, monthly cash flow is $4k ($43k/yr) — positive. Per door: $1k/mo.
- The deal already cash-flows at list — no discount required.
- Meets the 1% rule at list price ($9k rent vs $475k).
- Recommended offer: $461k (3.0% below list) — sets the bar for market timing.
- Cap rate 15.4% vs local median 3.1% in Minneapolis — top-decile yield for the area; either an underpriced asset or a hidden risk that comps aren't pricing in. Stress-test before assuming the spread holds.
Location & tenants
- Location reads 78/100 on livability (#110 in MN, #2,525 nationally) — a middle-class / working-renter tenant base. Strengths: amenities A+, commute A+, housing A+; Watch: cost of living C-, crime F.
- Minneapolis Public School District (urban): math 35% / reading 46% proficiency, ranked #217 of 301 in MN (top 72%) — families likely to look elsewhere, expect single-tenant / working-renter base with shorter leases.
- Market conditions: Rents rising fast (+4.6%/yr); 66 active listings in the ZIP; 37 comparable units currently listed for rent nearby; rentals leasing fast (median 2d on market — plan ~1-2 weeks tenant-placement turnaround); solid renter incomes; 4,651 units permitted in Hennepin County in 2024 (2,443 in 5+ unit buildings).
- At $8,607/mo this rent would consume 121% of the median local household income ($85k/yr) (locally 661% of renters already pay >50% of income on rent) — very limited rent-growth headroom before tenants either downsize or default.
Forward outlook
- Local home prices are declining (-3.0%/yr); year-one equity from $3k of loan paydown is wiped out by about $14k of value loss. Plan a longer hold.
- Hennepin County population projected at +30% by 2050 — long-run rental-demand tailwind backs the buy-and-hold thesis.
- At projected returns (-3.0% appreciation + 4.6% rent growth), your $133k cash investment doubles in ~4 years — after that, you're playing with house money.
Negotiation context
- It's been on market 42 days — a 3% lower offer ($461k) is reasonable based on typical stale-listing flexibility.
- 4 sale attempts since 11y ago with the ask held roughly flat each time — persistent listings suggest the price (not the market) is what's stuck; bring a comps-based counter.
Risks & watch-outs
- Watch-outs: built in 1900 — expect roof / HVAC / electrical / plumbing capex.
Questions for the listing agent
- It's been on market 42 days. Have you received any prior offers? Is the seller open to a 3% concession, seller financing, or rate buy-down credit?
- Can we see the unit-by-unit rent roll, current vacancy, and any below-market leases? What's the average tenancy length?
- What capital expenditures (roof, boiler, parking lot, exteriors) have been made in the last 5 years, and what's planned in the next 2?
- Built in 1900 — when were the roof, HVAC, electrical panel, plumbing, and water heater last replaced?
- Is there a deadline driving the sale (1031 exchange, divorce, estate, relocation)? That informs how much negotiation room exists.
- Crime grade is F in this area — have there been break-ins, vandalism, or insurance claims at this property in the last 3 years? What carrier currently insures it and at what premium?
- What's the average days-on-market for RENTAL listings here right now (not sales)? A rising rental-DOM trend means longer vacancies and softer asking-rent achievability than the comps imply.
- What's the recent tenant-quality profile in this submarket — average credit score on applications, eviction rate, late-payment / NSF rate, and stable-employment percentage? A property-management company in the area should have these aggregated.
- How much new apartment / multifamily construction is in the pipeline within 1–3 miles? Heavy new supply (>2% of stock underway) typically softens rents 12–24 months out; light construction supports rent growth.
Investment metrics
- 1% rule
- 1.81% ✓
- Cap rate
- 15.42%
- Cash-on-cash
- 32.59%
- DSCR
- 2.45
- GRM
- 4.6
CMA / ARV
- ARV (median comp)
- $343,708
- List price
- $475,000
- Delta
- 38.20%
- Verdict
- OVERPRICED
- Comps
- 4 within 1.0 mi
Projected returns pro-forma
-3.0% appreciation · 4.59% rent growth · sell at horizon
- IRR
- 29.5%
- Equity multiple
- 2.26×
- Total profit
- $167,141
- Equity at exit
- $70,824
- IRR
- 37.7%
- Equity multiple
- 4.77×
- Total profit
- $501,353
- Equity at exit
- $41,069
Cash invested: $133,000 (down + closing). Projections, not guarantees.
Landlord ↔ Tenant lean methodology
- Overall (CITY)
- 34 Tenant-Leaning
- State Minnesota
- 46 Balanced · D+2
- County
- — inherits STATE
- City Minneapolis
- 34 Tenant-Leaning · D+50
ZIP-level market 55413
- Home prices YoY
- -26.4%
- Rents YoY
- 4.6%
- Active inventory
- 66
- Price-to-rent
- 13.8×
Monthly cashflow live
- Estimated rent
- $8,607 medium interval (Pro) →
- Mortgage (P&I)
- −$2,491
- Tax from tax record
- −$499 /mo · $5,983/yr
- Insurance
- −$198
- HOA
- −$0
- Vacancy / Maint / Mgmt
- −$1,807
- Net cashflow
- $3,612
Break-even live
3-unit breakdown (identical units grouped — click to expand)
| Units | Beds | Baths | Est. rent |
|---|---|---|---|
| 3× units | 5 | 3 | $8,607 |
| #1 | 5 | 3 | $2,869 |
| #2 | 5 | 3 | $2,869 |
| #3 | 5 | 3 | $2,869 |
| Total (3 units) | $8,607 | ||
UW: 25.0% down · 7.5% · 30yr · 1.5% tax · 5.0% vac · 8.0% maint · 8.0% mgmt
Financing live
Cash to close
- Down payment
- $118,750
- Closing costs
- $14,250
- Reserves months
- —
- Total cash needed
- —
Loan-product check · same deal, 3 products live
Conventional
25% down · 7.5% · 30yr
- Down + closing
- —
- Monthly P&I
- —
- Monthly cashflow
- —
- DSCR
- —
- Eligible?
- —
Personal DTI + credit; lowest rate.
DSCR
20% down · 8.5% · 30yr
- Down + closing
- —
- Monthly P&I
- —
- Monthly cashflow
- —
- DSCR
- —
- Eligible?
- —
No personal income docs; deal must DSCR.
Hard money
10% down · 12.0% · 12mo
- Down + closing
- —
- Monthly P&I
- —
- Monthly cashflow
- —
- DSCR
- —
- Eligible?
- —
Short-term bridge; refi at stabilization.
Rent comps 37 comps
| Address | Beds | Baths | Sqft | Rent | $/sqft | DOM | Units | Dist |
|---|---|---|---|---|---|---|---|---|
| 623 Spring St NE Unit 623 Minneapolis, MN | 3.0 | 2.0 | 1650 | $2,600 | $1.58 | 43d | 1 | 0.20mi |
| 110 6th Ave NE Minneapolis, MN | 2.0 | 1.0–2.0 | 831 | $3,109 | $3.74 | 3d | 8 | 0.21mi |
| 401 1st Ave NE Minneapolis, MN | 2.0 | 1.0–2.0 | 922 | $3,733 | $4.05 | 2d | 9 | 0.49mi |
| 20 6th St NE Minneapolis, MN | 2.0 | 1.0–2.0 | 858 | $2,936 | $3.42 | 1d | 9 | 0.58mi |
| 1428 Marshall St NE Minneapolis, MN | 3.0 | 2.5 | 1800 | $3,300 | $1.83 | 1d | 1 | 0.66mi |
| 900 14th Ave NE Minneapolis, MN | 2.0 | 1.0–2.0 | 876 | $1,610 | $1.84 | 2d | 13 | 0.71mi |
| 432 N 1st St Minneapolis, MN | 1.0–2.0 | 1.0–2.0 | 1067 | $2,175 | $2.04 | 2d | 6 | 0.78mi |
| 200 University Ave SE Minneapolis, MN | 3.0 | 1.0–3.0 | 1554 | $5,957 | $3.83 | 1d | 25 | 0.80mi |
| 110 N 1st St Minneapolis, MN | 1.0–2.0 | 1.0–2.0 | 885 | $3,799 | $4.29 | 2d | 20 | 0.83mi |
| 626 NE Taylor St Unit 1 Minneapolis, MN | 3.0 | 1.0 | 1250 | $1,875 | $1.50 | 43d | 1 | 0.84mi |
| 2035 W River Rd Minneapolis, MN | 1.0–4.0 | 2.0 | 1034 | $1,730 | $1.67 | 4d | 10 | 0.87mi |
| 120 N 2nd St Minneapolis, MN | 1.0–2.0 | 1.0–2.5 | 1039 | $3,428 | $3.30 | 1d | 19 | 0.91mi |
| 120 Hennepin Ave Minneapolis, MN | 2.0 | 1.0–2.0 | 960 | $3,665 | $3.82 | 7d | 10 | 0.91mi |
| 636 22nd Ave NE Minneapolis, MN | 3.0–4.0 | 2.5 | 1625 | $3,090 | $1.90 | 1d | 3 | 0.98mi |
| 222 Hennepin Ave Minneapolis, MN | 1.0–2.0 | 1.0–2.0 | 994 | $4,175 | $4.20 | 2d | 12 | 1.00mi |
| 915 Washington Ave N Minneapolis, MN | 2.0 | 2.0–2.5 | 1215 | $2,549 | $2.10 | 1d | 5 | 1.05mi |
| 360 N 5th Ave Minneapolis, MN | 2.0 | 1.0–2.5 | 1185 | $7,325 | $6.18 | 2d | 85 | 1.05mi |
| 721 N 3rd St Minneapolis, MN | 3.0 | 1.0–2.0 | 972 | $3,544 | $3.65 | 2d | 10 | 1.07mi |
| 270 Hennepin Ave Minneapolis, MN | 3.0 | 1.0–3.0 | 1505 | $6,755 | $4.49 | 2d | 54 | 1.10mi |
| 815 SE 9th St Minneapolis, MN | 1.0–4.0 | 1.0–4.0 | 1149 | $1,938 | $1.69 | 2d | 13 | 1.13mi |
| 207 24th Ave NE Minneapolis, MN | 3.0 | 3.0 | 1575 | $2,995 | $1.90 | 43d | 1 | 1.15mi |
| 711 4th St SE Minneapolis, MN | 4.0 | 1.0–2.0 | 1667 | $2,000 | $1.20 | 43d | 51 | 1.16mi |
| 365 Nicollet Mall Minneapolis, MN | 3.0 | 1.0–3.5 | 1656 | $7,058 | $4.26 | 3d | 33 | 1.20mi |
| 400 Marquette Ave Minneapolis, MN | 3.0 | 1.0–2.0 | 1103 | $4,260 | $3.86 | 2d | 14 | 1.23mi |
| 250 Portland Ave Minneapolis, MN | 1.0–2.0 | 1.0–2.0 | 902 | $3,372 | $3.74 | 2d | 11 | 1.25mi |
| 465 Nicollet Mall Minneapolis, MN | 2.0 | 1.0–3.0 | 1153 | $4,620 | $4.01 | 2d | 14 | 1.26mi |
| 240 Park Ave Minneapolis, MN | 1.0–2.0 | 1.0–2.0 | 1047 | $3,875 | $3.70 | 3d | 2 | 1.28mi |
| 101 S 5th St Minneapolis, MN | 3.0 | 1.0–2.0 | 1249 | $3,169 | $2.54 | 2d | 35 | 1.31mi |
| 511 S 4th St Minneapolis, MN | 2.0 | 1.0–2.0 | 882 | $2,945 | $3.34 | 2d | 11 | 1.36mi |
| 212 10th Ave S Minneapolis, MN | 3.0 | 1.0–2.5 | 1490 | $6,415 | $4.31 | 1d | 10 | 1.36mi |
| 1000 University Ave SE Minneapolis, MN | 2.0–4.0 | 1.0–2.0 | 1136 | $1,880 | $1.65 | 24d | 9 | 1.38mi |
| 700 S 4th St Minneapolis, MN | 2.0 | 1.0–2.0 | 897 | $3,995 | $4.45 | 1d | 26 | 1.39mi |
| 608 2nd Ave S Minneapolis, MN | 2.0 | 1.0–2.0 | 999 | $2,300 | $2.30 | 2d | 34 | 1.41mi |
| 1120 S 2nd St #213 Minneapolis, MN | 2.0 | 2.0 | 1532 | $3,895 | $2.54 | 14d | 1 | 1.43mi |
| 600 5th Ave S Minneapolis, MN | 1.0–2.0 | 1.0–2.0 | 915 | $3,315 | $3.62 | 1d | 9 | 1.47mi |
| 1220 Brook Ave SE Minneapolis, MN | 3.0 | 1.0–3.0 | 807 | $1,932 | $2.39 | 3d | 32 | 1.48mi |
| 815 13th Ave SE Minneapolis, MN | 1.0–4.0 | 1.0–2.0 | 1171 | $1,583 | $1.35 | 43d | 46 | 1.49mi |
Listing history 30 events
-
2026-06-18days on market $475,000 Active 42 DOM
-
2026-06-17days on market $475,000 Active 41 DOM
-
2026-06-16days on market $475,000 Active 40 DOM
-
2026-06-15days on market $475,000 Active 39 DOM
-
2026-06-13days on market $475,000 Active 37 DOM
-
2026-06-09days on market $475,000 Active 33 DOM
-
2026-06-08days on market $475,000 Active 32 DOM
-
2026-06-07days on market $475,000 Active 31 DOM
-
2026-06-04days on market $475,000 Active 28 DOM
-
2026-06-03days on market $475,000 Active 27 DOM
-
2026-06-02days on market $475,000 Active 26 DOM
-
2026-06-01days on market $475,000 Active 25 DOM
-
2026-05-31days on market $475,000 Active 24 DOM
-
2026-05-07$475,000 Active 376-char remark
-
2024-03-01soldstatus $461,000
-
2024-01-01historical
-
2023-06-15$484,600 Active
-
2023-06-14historical
-
2017-07-28soldstatus $330,000
-
2017-06-23soldstatus $330,000 Sold
Show marketing remark (343 chars)
Fantastic location in St. Anthony. Both units rented out. Updated interior in both units. Granite, stainless steel, new cabinets, updated bathrooms, carpet, paint. Each unit has brand new forced air furnace. Newer roof, detached garage. Property used to be a triplex. Back studio could be brough back to third unit. 24 hr. notice for showings.
-
2017-05-22status Pending
Show marketing remark (343 chars)
Fantastic location in St. Anthony. Both units rented out. Updated interior in both units. Granite, stainless steel, new cabinets, updated bathrooms, carpet, paint. Each unit has brand new forced air furnace. Newer roof, detached garage. Property used to be a triplex. Back studio could be brough back to third unit. 24 hr. notice for showings.
-
2017-05-15price $324,900
Show marketing remark (343 chars)
Fantastic location in St. Anthony. Both units rented out. Updated interior in both units. Granite, stainless steel, new cabinets, updated bathrooms, carpet, paint. Each unit has brand new forced air furnace. Newer roof, detached garage. Property used to be a triplex. Back studio could be brough back to third unit. 24 hr. notice for showings.
-
2017-04-12$349,000 Active
Show marketing remark (343 chars)
Fantastic location in St. Anthony. Both units rented out. Updated interior in both units. Granite, stainless steel, new cabinets, updated bathrooms, carpet, paint. Each unit has brand new forced air furnace. Newer roof, detached garage. Property used to be a triplex. Back studio could be brough back to third unit. 24 hr. notice for showings.
-
2016-06-21soldstatus $175,000
-
2015-12-23historical
-
2015-12-15historical Contingent - Inspection
-
2015-11-11price $179,900
-
2015-10-28price $189,900
-
2015-10-08$199,900 Active
-
1996-08-09soldstatus $47,500
ⓘ Source: listings_history table (triggers on properties + properties_extension) + one-shot
backfill from property_details.listing_events for pre-trigger history.
Tax reassessment forecast MN · Partial reset (capped growth)
- Current annual tax
- $5,983 · $499/mo
- Projected year-2 tax
- $5,983 · $499/mo
- Expected delta
- $0/yr ($0/mo · 0.0%)
ⓘ Screening estimate from a state-policy table — verify with the county assessor before closing.
Climate risk First Street
- Flood 1/10 Low FEMA zone X (unshaded) · 0% chance over 30 yrs
- Wildfire 1/10 Low
- Heat 2/10 Low 7 d/yr ≥100°F today · 14 d/yr by 30 yrs out
- Wind 2/10 Low
- Air quality 2/10 Low 1 unhealthy d/yr today · 1 by 30 yrs out
Nearby sold comps map
Loading sold comps map…
Walkable amenities ~0.75 mi
Loading nearby amenities…
Taxation est. · year 1
- Rental income
- $103,284
- − Mortgage interest
- −$26,607
- − Property taxes
- −$5,983
- − Insurance
- −$2,375
- − Repairs & maintenance
- −$8,263
- − Management
- −$8,263
- − Depreciation
- −$13,818
- Taxable income
- $37,975
- Est. tax owed @ 24.0%
- −$9,114
- After-tax cash flow
- $34,231/yr
For passive investors: Depreciation is non-cash, so a rental often shows a tax loss while cash-flowing — sheltering income. Rental losses are passive: they offset passive income freely, and up to $25,000/yr can offset ordinary (W-2) income if you actively participate and your MAGI is under $100k (phasing out to $0 by $150k); unused losses carry forward. On sale, claimed depreciation is recaptured at up to 25%, and gains may owe capital-gains tax (a 1031 exchange can defer both). Figures are a year-1 estimate at your 24.0% rate — not tax advice; consult a CPA.
Schools (NCES district)
- District
- Minneapolis Public School District
- NCES district ID
- 2721240
- Math proficiency
- 35% ▼ -7.00%
- Reading proficiency
- 46% ▼ -1.00%
- Median HH income
- $50,521
- Composite
- 34.92/100
- National rank
- #5067
- State rank
- #217 of 301 in MN
Livability — Minneapolis
- Score
- 78/100
- State rank
- #110
- US rank
- #2525
Category grades
Schools grade is shown separately in the Schools card above.
Census & demographics
- Census place
- Minneapolis, MN
- County
- Hennepin County · 1,150,272 people
- City population
- 417,555
- Metro
- Minneapolis-St. Paul-Bloomington, MN-WI
- Population (ZIP)
- 14,655
- Household income
- $85,282
- Rent vs Own
- Severe rent burden
- 661.0
Population outlook (Hennepin County) Hauer SSP2
- Today (2025)
- 1,405,227 people
- By 2030
- 1,492,650 · +6.2%
- By 2040
- 1,660,157 · +18.1%
- By 2050
- 1,823,498 · +29.8%
- By 2075
- 2,221,283 · +58.1%
- By 2100
- 2,509,976 · +78.6%
Race, ethnicity, and origin ACS 2023
- Neighborhood character
- Predominantly White (71%)
- Race & ethnicity
- White 71% Black 12% Two or more races 8% Hispanic / Latino 6% Asian 4%
- Hispanic origin (detail)
- Mexican 4%
- Common ancestry
- Portuguese 11% Romanian 6% Lithuanian 3%
- Foreign-born
- 13% · Canada, Vietnam, South Korea
- Languages at home
- 84% English-only · Spanish 4% Russian/Polish/Slavic 1% Vietnamese 1%
Political lean MEDSL · Hennepin
- 2024 margin
- Solid D (+42.6) · D 70.2% · R 27.5% · Other 2.3%
- 2008→2024 swing
- +14.0pp toward D · 2008: 28.6pp · 2024: 42.6pp
- All cycles
- 2024: D+42.6 2020: D+43.2 2016: D+35.3 2012: D+27.1 2008: D+28.6
Not yet ingested
- Civics
- —
Market trends
- HPI YoY
- ▼ -95.68%
- Current HPI
- 266.9323
- Rent YoY
- ▲ 4.59%
- Metro
- Minneapolis-St. Paul-Bloomington, MN-WI
- State GDP YoY
- ▲ 2.41%
- F500 in state
- 34
Industry mix (Fortune 500 HQ in MN)
| Industry | F500 HQs | Revenue |
|---|---|---|
| Healthcare | 2 | $407B |
|
||
| Retail | 2 | $150B |
|
||
| Consumer Goods | 2 | $32B |
|
||
| Industrial Machinery | 2 | $6B |
|
||
| Agriculture | 1 | $40B |
|
||
| Healthcare / Medical Devices | 1 | $32B |
|
||
Price history
+900.0% since first listed17 events — show timeline
- 2026-05-07 Listed $475,000 NORTHSTARMLS as Distributed by MLS Grid
- 2024-03-01 Sold (Public Records) $461,000 Public Records
- 2024-01-01 Listing Removed — NORTHSTARMLS as Distributed by MLS Grid
- 2023-06-15 Listed $484,600 NORTHSTARMLS as Distributed by MLS Grid
- 2023-06-14 Coming Soon — NORTHSTARMLS as Distributed by MLS Grid
- 2017-07-28 Sold (Public Records) $330,000 Public Records
- 2017-06-23 Sold (MLS) $330,000 NORTHSTARMLS as Distributed by MLS Grid
- 2017-05-22 Pending — NORTHSTARMLS as Distributed by MLS Grid
- 2017-05-15 Price Changed $324,900 NORTHSTARMLS as Distributed by MLS Grid
- 2017-04-12 Listed $349,000 NORTHSTARMLS as Distributed by MLS Grid
- 2016-06-21 Sold (Public Records) $175,000 Public Records
- 2015-12-23 Listing Removed — NORTHSTARMLS as Distributed by MLS Grid
- 2015-12-15 Contingent — NORTHSTARMLS as Distributed by MLS Grid
- 2015-11-11 Price Changed $179,900 NORTHSTARMLS as Distributed by MLS Grid
- 2015-10-28 Price Changed $189,900 NORTHSTARMLS as Distributed by MLS Grid
- 2015-10-08 Listed $199,900 NORTHSTARMLS as Distributed by MLS Grid
- 1996-08-09 Sold (Public Records) $47,500 Public Records
Property tax history
+5.0%/yrLatest (2025): $5,983 · +9.9% YoY. Source: county tax records.
Cash-flow waterfall
monthlySold comps — $/sqft
last 12 mo · ≤1 miLoading sold comps…