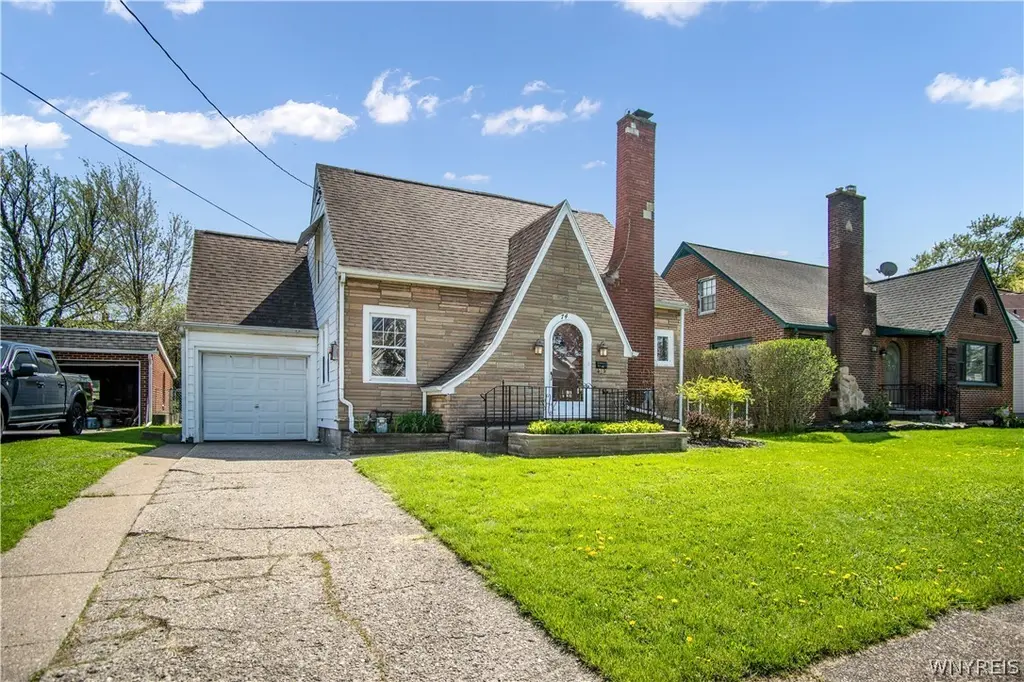
74 Linwood Ave · Tonawanda, NY
Flood risk 1/10 · Minimal
- FEMA flood zone
- X (unshaded)
- Chance of flooding over 30 yrs
- 0.0%
- Est. flood insurance / yr
- $473 – $860
Fire risk 1/10 · Minimal
- Est. fire insurance / yr
- $691 – $1,283
Heat risk 3/10 · Minor
- Hot days now (above 93°F)
- 7 days/yr
- Hot days in 30 yrs
- 15 days/yr
Wind risk 1/10 · Minimal
- Chance of severe wind over 30 yrs
- —
Air-quality risk 3/10 · Minor
- Unhealthy air days now
- 3 days/yr
- Unhealthy air days in 30 yrs
- 4 days/yr
Risk factors via First Street. Map © Google.
Why this score? — see what drove the C- grade
The composite is a weighted blend of 9 inputs, each scored 0–100. Each bar is that input's sub-score; the figure is the points it added to the 100-point composite (weight × sub-score).
- ARV discount +15.0/15.0
- Cash flow +13.2/30.0
- Livability +4.5/5.0
- Rent growth +4.2/5.0
- DSCR +4.0/10.0
- 1% rule +3.7/10.0
- Schools +3.5/10.0
- Condition / age +2.5/5.0
- Appreciation +0.0/10.0
$199,888
🖨 Deal sheet 📄 Offer letter ✓ Due diligence
Listing remarks
OUTSTANDING CONDITION & VALUE! * BRICK FACED * VINYL & ALUM SIDED CAPE COD * FEATURES NATURAL WOODWORK & NUMEROUS UPDATES * INCL FOYER & ENTRY FLRING UPDATED 2026 * LIV/RM W/ ELECTRIC FIREPLACE 2023 * LIVING RM & DINNING RM HAS UPDATED CARPETING 2025 * (HRDWDS UNDER CARPET) * LARGE FAMILY RM W/ SEPERATE ENTRANCE (IN-LAW POSSIBILITIES) OVERLOOKING FULLY FENCED YARD * EAT-IN KITCH W/ UPDATED APPLIANCES * B/I ELEC RANGE 2022 * B/I OVEN 2022 * REFRIGERATOR 2022 * DISHWSHR * C/T BACKSPLSH 2022 * EAT-IN AREA * 2ND FLOOR * TWO LARGE BEDROOMS * BOTH FEATURE GLEAMING HARDWOODS * ONE HAS WALK IN CLOSET AND A WALK THROUGH FLEX RM *
Key facts
- 6,565 sq ft lot
- Garage
- Built 1940
Property features AI
Exterior
- Parking: Attached garage with storage; 1 garage space
- Utilities: Public water connected; Sewer connected; Electricity connected (circuit breakers); High-speed internet available; Cable available
- Home design: 2-story house; Existing/resale property
- Construction: Aluminum siding; Vinyl siding; Brick; Blown-in insulation; Copper plumbing; Asphalt shingle roof; Poured foundation
- Exterior features: Open porch; Awning(s); Concrete driveway; Fully fenced yard; Shed(s) / exterior storage; Other storage; Near public transit; Rectangular residential lot; City street frontage
Interior
- Kitchen: Built-in range; Built-in oven; Electric cooktop; Microwave; Refrigerator; Dishwasher; Pantry; Eat-in kitchen
- Bedrooms: Bedroom 1 on second level; Bedroom 2 on second level; Convertible bedroom (additional flexible room)
- Flooring: Hardwood; Carpet; Tile; Linoleum; Luxury vinyl; Vinyl; Varied flooring
- Bathrooms: 1 full bathroom
- Heating & cooling: Gas forced-air heating
- Interior features: Ceiling fans; Separate/formal dining room; Entrance foyer; Eat-in kitchen; Separate/formal living room; Pantry; Natural woodwork; Convertible bedroom; In-law floorplan; Workshop; See remarks
- Laundry & utility: Washer; Dryer; Laundry located in basement; Gas water heater; Tankless water heater; Sump pump in basement
Neighborhood map
What this means for you Summary
Snapshot
- This is a 2-bed/1.0-bath single-family listed at $200k.
Deal economics
- At list price, monthly cash flow is $-3 ($-33/yr) — negative.
- To cash-flow at today's rent, offer at most $199k (0.2% below list).
- To meet the 1% rule (rent ≥ 1% of price), the offer needs to be $174k (13.2% below list).
- Recommended offer: $174k (13.2% below list) — sets the bar for 1% rule.
Location & tenants
- Location reads 89/100 on livability (#8 in NY, #169 nationally) — a professional / high-income tenant draw. Strengths: amenities A+, commute A+, cost of living A+.
- Tonawanda City School District (suburban): math 39% / reading 43% proficiency, ranked #508 of 590 in NY (top 86%) — families likely to look elsewhere, expect single-tenant / working-renter base with shorter leases.
- Market conditions: Rents rising fast (+6.8%/yr); 191 active listings in the ZIP; 8 comparable units currently listed for rent nearby; rentals leasing fast (median 3d on market — plan ~1-2 weeks tenant-placement turnaround); 1,244 units permitted in Erie County in 2024 (563 in 5+ unit buildings).
Forward outlook
- Local home prices are declining (-3.0%/yr); year-one equity from $1k of loan paydown is wiped out by about $6k of value loss. Plan a longer hold.
Negotiation context
- Only 8 days on market — expect competitive offers; lowballing is unlikely to land.
- 2 sale attempts with the ask held roughly flat each time — persistent listings suggest the price (not the market) is what's stuck; bring a comps-based counter.
- Current owner paid $75k; list at $200k implies a 167% gain — meaningful room to come down on a strong offer.
Risks & watch-outs
- Watch-outs: built in 1940 — expect roof / HVAC / electrical / plumbing capex.
Questions for the listing agent
- What do current leases actually rent for vs. the listed asking? Can we see a recent rent roll and the last 12 months of T-12 income?
- Built in 1940 — when were the roof, HVAC, electrical panel, plumbing, and water heater last replaced?
- Is there a deadline driving the sale (1031 exchange, divorce, estate, relocation)? That informs how much negotiation room exists.
- Schools are B-rated — typically a magnet for longer-tenancy family renters. What's the average tenant stay here, and is there a school-zone premium baked into asking?
- What's the average days-on-market for RENTAL listings here right now (not sales)? A rising rental-DOM trend means longer vacancies and softer asking-rent achievability than the comps imply.
- What's the recent tenant-quality profile in this submarket — average credit score on applications, eviction rate, late-payment / NSF rate, and stable-employment percentage? A property-management company in the area should have these aggregated.
- How much new for-sale + rental construction is in the pipeline within 1–3 miles? Heavy new supply typically softens prices + rents 12–24 months out; constrained supply supports both.
Investment metrics
- 1% rule
- 0.87% ✗
- Cap rate
- 6.28%
- Cash-on-cash
- -0.06%
- DSCR
- 1.00
- GRM
- 9.6
CMA / ARV
- ARV (median comp)
- $279,528
- List price
- $199,888
- Delta
- -28.49%
- Verdict
- UNDERPRICED
- Comps
- 20 within 1.0 mi
Show comp detail 6 sales within ~0.75 mi
| Address | Dist | Beds/Ba | Sqft | Sold | Price | $/sf | Match |
|---|---|---|---|---|---|---|---|
| 320 Joseph Dr | 0.59mi | 3/1.0 (+1) | 1,344 (-6%) | 12mo | $251,000 | $187 | 48 |
| 127 Bannard Ave | 0.45mi | 3/1.0 (+1) | 1,263 (-12%) | 9mo | $240,000 | $190 | 47 |
| 17 Nicholas Dr N | 0.61mi | 3/1.0 (+1) | 1,281 (-10%) | 10mo | $250,000 | $195 | 41 |
| 23 Nicholas Ct | 0.75mi | 3/1.5 (+1) | 1,458 (+2%) | 24mo | $282,000 | $193 | 35 |
| 71 Bannard Ave | 0.46mi | 3/2.0 (+1) | 1,607 (+12%) | 18mo | $222,500 | $138 | 34 |
| 11 Nicholas Ct | 0.72mi | 3/2.0 (+1) | 1,638 (+15%) | 24mo | $325,000 | $198 | 13 |
Match score weights: distance 35% · size 25% · config 20% · recency 20%. Top-matched comps best support the ARV.
Projected returns pro-forma
-3.0% appreciation · 6.75% rent growth · sell at horizon
- IRR
- -12.3%
- Equity multiple
- 0.54×
- Total profit
- $-25,748
- Equity at exit
- $29,804
- IRR
- 1.6%
- Equity multiple
- 1.14×
- Total profit
- $7,563
- Equity at exit
- $17,283
Cash invested: $55,969 (down + closing). Projections, not guarantees.
Landlord ↔ Tenant lean methodology
- Overall (STATE)
- 15 Strongly Tenant-Friendly
- State New York
- 15 Strongly Tenant-Friendly · D+10
- County
- — inherits STATE
- City
- — inherits STATE
ZIP-level market 14150
- Rents YoY
- 6.8%
- Active inventory
- 191
- Price-to-rent
- 9.6×
Monthly cashflow live
- Estimated rent
- $1,735 high interval (Pro) →
- Mortgage (P&I)
- −$1,048
- Tax from tax record
- −$242 /mo · $2,905/yr
- Insurance
- −$83
- HOA
- −$0
- Vacancy / Maint / Mgmt
- −$364
- Net cashflow
- $-3
Break-even live
UW: 25.0% down · 7.5% · 30yr · 1.5% tax · 5.0% vac · 8.0% maint · 8.0% mgmt
Financing live
Cash to close
- Down payment
- $49,972
- Closing costs
- $5,997
- Reserves months
- —
- Total cash needed
- —
Loan-product check · same deal, 3 products live
Conventional
25% down · 7.5% · 30yr
- Down + closing
- —
- Monthly P&I
- —
- Monthly cashflow
- —
- DSCR
- —
- Eligible?
- —
Personal DTI + credit; lowest rate.
DSCR
20% down · 8.5% · 30yr
- Down + closing
- —
- Monthly P&I
- —
- Monthly cashflow
- —
- DSCR
- —
- Eligible?
- —
No personal income docs; deal must DSCR.
Hard money
10% down · 12.0% · 12mo
- Down + closing
- —
- Monthly P&I
- —
- Monthly cashflow
- —
- DSCR
- —
- Eligible?
- —
Short-term bridge; refi at stabilization.
Rent comps 8 comps
| Address | Beds | Baths | Sqft | Rent | $/sqft | DOM | Units | Dist |
|---|---|---|---|---|---|---|---|---|
| 53 Winkler Dr Tonawanda, NY | 3.0 | 1.0 | 1060 | $2,100 | $1.98 | 11d | 1 | 0.49mi |
| 86 Scott St Tonawanda, NY | 2.0 | 1.0 | 1584 | $1,450 | $0.92 | 1d | 1 | 0.64mi |
| 115 Klinger Ave Tonawanda, NY | 3.0 | 1.0 | 1200 | $1,450 | $1.21 | 3d | 1 | 0.89mi |
| 149 Adam St Tonawanda, NY | 1.0 | 2.5 | 1772 | $1,500 | $0.85 | 43d | 1 | 1.08mi |
| 330 E Niagara St Tonawanda, NY | 1.0–2.0 | 1.0–2.0 | 975 | $1,900 | $1.95 | 1d | 1 | 1.19mi |
| 184 Sweeney St North Tonawanda, NY | 2.0 | 2.0 | 1155 | $2,000 | $1.73 | 1d | 1 | 1.19mi |
| 1835 Military Rd Buffalo, NY | 2.0 | 1.0 | 1064 | $2,175 | $2.04 | 17d | 1 | 1.45mi |
| 103 Raintree Is Tonawanda, NY | 1.0–2.0 | 1.0 | 700 | $1,800 | $2.57 | 1d | 35 | 1.47mi |
Listing history 7 events
-
2026-05-14status Pending 1375-char remark
-
2026-05-06$199,888 Active 1375-char remark
-
2025-12-07historical
-
2025-11-04price $256,500
-
2025-09-08price $258,900
-
2025-08-07$263,900 Active
-
2001-08-07soldstatus $74,900
ⓘ Source: listings_history table (triggers on properties + properties_extension) + one-shot
backfill from property_details.listing_events for pre-trigger history.
Tax reassessment forecast NY · Partial reset (capped growth)
- Current annual tax
- $2,905 · $242/mo
- Projected year-2 tax
- $3,142 · $262/mo
- Expected delta
- +$236/yr (+$20/mo · 8.1%)
ⓘ Screening estimate from a state-policy table — verify with the county assessor before closing.
Climate risk First Street
- Flood 1/10 Low FEMA zone X (unshaded) · 0% chance over 30 yrs
- Wildfire 1/10 Low
- Heat 3/10 Moderate 7 d/yr ≥93°F today · 15 d/yr by 30 yrs out
- Wind 1/10 Low
- Air quality 3/10 Moderate 3 unhealthy d/yr today · 4 by 30 yrs out
Nearby sold comps map
Loading sold comps map…
Walkable amenities ~0.75 mi
Loading nearby amenities…
Taxation est. · year 1
- Rental income
- $20,824
- − Mortgage interest
- −$11,197
- − Property taxes
- −$2,905
- − Insurance
- −$999
- − Repairs & maintenance
- −$1,666
- − Management
- −$1,666
- − Depreciation
- −$5,815
- Taxable loss
- −$3,424
- Est. tax savings @ 24.0%
- +$822
- After-tax cash flow
- $789/yr
For passive investors: Depreciation is non-cash, so a rental often shows a tax loss while cash-flowing — sheltering income. Rental losses are passive: they offset passive income freely, and up to $25,000/yr can offset ordinary (W-2) income if you actively participate and your MAGI is under $100k (phasing out to $0 by $150k); unused losses carry forward. On sale, claimed depreciation is recaptured at up to 25%, and gains may owe capital-gains tax (a 1031 exchange can defer both). Figures are a year-1 estimate at your 24.0% rate — not tax advice; consult a CPA.
Schools (NCES district)
- District
- Tonawanda City School District
- NCES district ID
- 3628740
- Math proficiency
- 39% ▼ -19.00%
- Reading proficiency
- 43% ▼ -7.00%
- Median HH income
- $47,061
- Composite
- 35.03/100
- National rank
- #5041
- State rank
- #508 of 590 in NY
Livability — Tonawanda
- Score
- 89/100
- State rank
- #8
- US rank
- #169
Category grades
Schools grade is shown separately in the Schools card above.
Census & demographics
- Census place
- Tonawanda, NY
- County
- Erie County · 714,559 people
- City population
- 41,260
- Metro
- Buffalo-Cheektowaga, NY
- Population (ZIP)
- 41,260
- Household income
- $71,406
- Rent vs Own
- Severe rent burden
- 1427.0
Population outlook (Erie County) Hauer SSP2
- Today (2025)
- 933,037 people
- By 2030
- 935,181 · +0.2%
- By 2040
- 928,531 · -0.5%
- By 2050
- 905,725 · -2.9%
- By 2075
- 834,037 · -10.6%
- By 2100
- 708,033 · -24.1%
Race, ethnicity, and origin ACS 2023
- Neighborhood character
- Predominantly White (87%)
- Race & ethnicity
- White 87% Two or more races 5% Hispanic / Latino 5% Black 4% Asian 2%
- Common ancestry
- Romanian 13% Lithuanian 3% Slovak 2%
- Foreign-born
- 6% · Canada, Philippines, Vietnam
- Languages at home
- 94% English-only · Other Indo-European 2% Spanish 1% Russian/Polish/Slavic 1%
Political lean MEDSL · Erie
- 2024 margin
- Lean D (+9.7) · D 54.8% · R 45.2%
- 2008→2024 swing
- -7.9pp toward R · 2008: 17.5pp · 2024: 9.7pp
- All cycles
- 2024: D+9.7 2020: D+14.7 2016: D+4.8 2012: D+15.6 2008: D+17.5
Not yet ingested
- Civics
- —
Market trends
- HPI YoY
- ▼ -260.43%
- Current HPI
- 334.5893
- Rent YoY
- ▲ 6.75%
- Metro
- Buffalo-Cheektowaga, NY
- State GDP YoY
- ▲ 2.60%
- F500 in state
- 92
Industry mix (Fortune 500 HQ in NY)
| Industry | F500 HQs | Revenue |
|---|---|---|
| Financial Services | 10 | $950B |
|
||
| Consumer Goods | 9 | $162B |
|
||
| Insurance | 4 | $225B |
|
||
| Telecommunications | 2 | $144B |
|
||
| Pharmaceuticals | 2 | $112B |
|
||
| Media / Entertainment | 2 | $69B |
|
||
Price history
+166.9% since first listed7 events — show timeline
- 2026-05-14 Pending — WNYREIS
- 2026-05-06 Listed $199,888 WNYREIS
- 2025-12-07 Listing Removed — WNYREIS
- 2025-11-04 Price Changed $256,500 WNYREIS
- 2025-09-08 Price Changed $258,900 WNYREIS
- 2025-08-07 Listed $263,900 WNYREIS
- 2001-08-07 Sold (Public Records) $74,900 Public Records
Property tax history
+5.3%/yrLatest (2025): $2,905 · +18.9% YoY. Source: county tax records.
Cash-flow waterfall
monthlySold comps — $/sqft
last 12 mo · ≤1 miLoading sold comps…