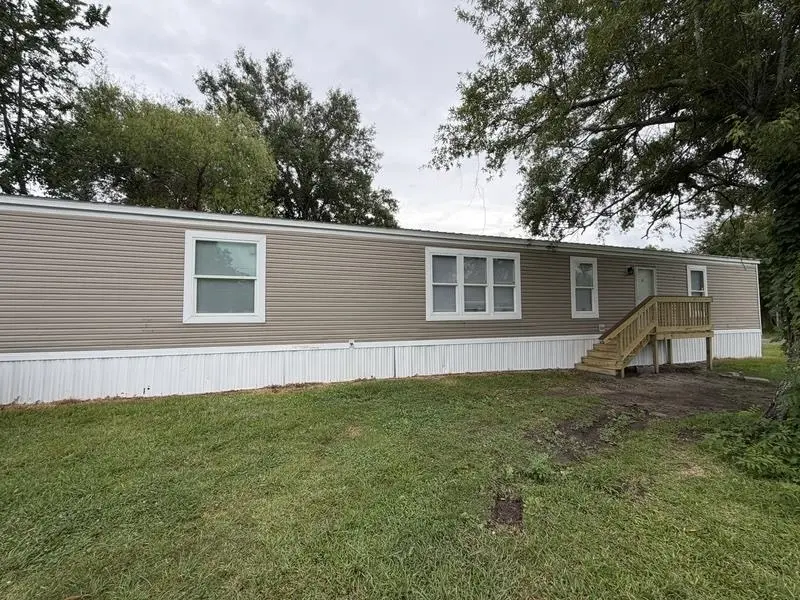
410 W Hickory Ave · Orange, TX
Flood risk 7/10 · Major
- FEMA flood zone
- X (shaded)
- Chance of flooding over 30 yrs
- 0.73%
- Est. flood insurance / yr
- $507 – $1,088
Fire risk 2/10 · Minimal
- Est. fire insurance / yr
- $1,222 – $2,270
Heat risk 9/10 · Severe
- Hot days now (above 109°F)
- 7 days/yr
- Hot days in 30 yrs
- 21 days/yr
Wind risk 9/10 · Severe
- Chance of severe wind over 30 yrs
- 99.0%
Air-quality risk 3/10 · Minor
- Unhealthy air days now
- 2 days/yr
- Unhealthy air days in 30 yrs
- 3 days/yr
Risk factors via First Street. Map © Google.
Why this score? — see what drove the C grade
The composite is a weighted blend of 9 inputs, each scored 0–100. Each bar is that input's sub-score; the figure is the points it added to the 100-point composite (weight × sub-score).
- Cash flow +21.1/30.0
- ARV discount +7.5/15.0
- DSCR +6.7/10.0
- Appreciation +5.5/10.0
- 1% rule +4.4/10.0
- Rent growth +3.9/5.0
- Livability +3.6/5.0
- Schools +3.3/10.0
- Condition / age +2.5/5.0
$129,900
🖨 Deal sheet 📄 Offer letter ✓ Due diligence
Listing remarks MLS
A rare opportunity, a vacant land where mobile homes are welcome within city limits. Owner finance is available. The land has access to all utilities, is flat clean, 2 driveways (culverts), and has access to an electrical pole, selling as is.
Key facts
- Dual vanity
- Thermopane windows
- Kitchen island
Tags
Property features AI
Exterior
- Utilities: Public water; Public sewer
- Home design: Residential manufactured home
- Construction: Manufactured construction
- Exterior features: Composition roof
Interior
- Bathrooms: 2 full bathrooms
- Heating & cooling: Central heating (electric); Central air; Ceiling fans
- Interior features: Electric water heater; 5 total rooms
Neighborhood map
What this means for you Summary
Snapshot
- This is a 3-bed/2.0-bath manufactured listed at $130k.
Deal economics
- At list price, monthly cash flow is $120 ($1k/yr) — positive.
- The deal already cash-flows at list — no discount required.
- To meet the 1% rule (rent ≥ 1% of price), the offer needs to be $122k (6.4% below list).
- Recommended offer: $122k (6.4% below list) — sets the bar for 1% rule.
- Cap rate 8.0% vs local median 3.9% in Orange — top-decile yield for the area; either an underpriced asset or a hidden risk that comps aren't pricing in. Stress-test before assuming the spread holds.
Location & tenants
- Location reads 71/100 on livability (#286 in TX) — a middle-class / working-renter tenant base. Strengths: cost of living A+, housing A+, health & safety A+; Watch: crime D+, employment D+, schools D-.
- Little Cypress-Mauriceville CISD (rural): math 35% / reading 40% proficiency, ranked #435 of 826 in TX (top 53%) — families likely to look elsewhere, expect single-tenant / working-renter base with shorter leases.
- Market conditions: Rents rising fast (+5.7%/yr); 337 active listings in the ZIP; 17 comparable units currently listed for rent nearby; rentals leasing fast (median 14d on market — plan ~1-2 weeks tenant-placement turnaround); 235 units permitted in Orange County in 2024 (50 in 5+ unit buildings).
Forward outlook
- In year one you build about $2k of equity ($898 loan paydown + $1k appreciation (1.0% local appreciation)).
- Orange County population projected at +6% by 2050 — modest demand growth; plan on rents tracking national, not racing it.
- At projected returns (1.0% appreciation + 5.7% rent growth), your $36k cash investment doubles in ~7 years — after that, you're playing with house money.
Negotiation context
- It's been on market 23 days — a 2% lower offer ($128k) is reasonable based on typical stale-listing flexibility.
- 2 sale attempts since 3y ago with the ask held roughly flat each time — persistent listings suggest the price (not the market) is what's stuck; bring a comps-based counter.
Risks & watch-outs
- Watch-outs: flood insurance adds $66/mo.
- Climate carrying-cost: major flood risk; severe wind risk, 99% chance of damaging wind over 30y; extreme-heat days projected 7→21/yr by 2055 (HVAC capex compounding) — expect insurance premiums to compound above CPI over the hold.
Questions for the listing agent
- What's the actual annual flood-insurance premium (NFIP or private), and is the property in a SFHA with mandatory coverage?
- Is there a deadline driving the sale (1031 exchange, divorce, estate, relocation)? That informs how much negotiation room exists.
- Schools are D-rated, which usually means shorter tenancies and higher turnover. Who's the typical renter profile here, and what's been the actual vacancy rate?
- Crime grade is D in this area — have there been break-ins, vandalism, or insurance claims at this property in the last 3 years? What carrier currently insures it and at what premium?
- What's the average days-on-market for RENTAL listings here right now (not sales)? A rising rental-DOM trend means longer vacancies and softer asking-rent achievability than the comps imply.
- What's the recent tenant-quality profile in this submarket — average credit score on applications, eviction rate, late-payment / NSF rate, and stable-employment percentage? A property-management company in the area should have these aggregated.
- How much new for-sale + rental construction is in the pipeline within 1–3 miles? Heavy new supply typically softens prices + rents 12–24 months out; constrained supply supports both.
Investment metrics
- 1% rule
- 0.94% ✗
- Cap rate
- 8.02%
- Cash-on-cash
- 6.15%
- DSCR
- 1.27
- GRM
- 8.9
CMA / ARV
No comps found within radius.
Projected returns pro-forma
1.01% appreciation · 5.71% rent growth · sell at horizon
- IRR
- 7.2%
- Equity multiple
- 1.37×
- Total profit
- $13,525
- Equity at exit
- $44,413
- IRR
- 12.9%
- Equity multiple
- 2.67×
- Total profit
- $60,795
- Equity at exit
- $59,073
Cash invested: $36,372 (down + closing). Projections, not guarantees.
Landlord ↔ Tenant lean methodology
- Overall (STATE)
- 87 Strongly Landlord-Friendly
- State Texas
- 87 Strongly Landlord-Friendly · R+5
- County
- — inherits STATE
- City
- — inherits STATE
ZIP-level market 77630
- Home prices YoY
- 0.4%
- Rents YoY
- 5.7%
- Active inventory
- 337
- Price-to-rent
- 8.9×
Monthly cashflow live
- Estimated rent
- $1,216 high interval (Pro) →
- Mortgage (P&I)
- −$681
- Tax from tax record
- −$39 /mo · $464/yr
- Insurance
- −$54
- Flood insurance flood zone
- −$66 /mo · $798/yr
- HOA
- −$0
- Vacancy / Maint / Mgmt
- −$255
- Net cashflow
- $120
Break-even live
UW: 25.0% down · 7.5% · 30yr · 1.5% tax · 5.0% vac · 8.0% maint · 8.0% mgmt
Financing live
Cash to close
- Down payment
- $32,475
- Closing costs
- $3,897
- Reserves months
- —
- Total cash needed
- —
Loan-product check · same deal, 3 products live
Conventional
25% down · 7.5% · 30yr
- Down + closing
- —
- Monthly P&I
- —
- Monthly cashflow
- —
- DSCR
- —
- Eligible?
- —
Personal DTI + credit; lowest rate.
DSCR
20% down · 8.5% · 30yr
- Down + closing
- —
- Monthly P&I
- —
- Monthly cashflow
- —
- DSCR
- —
- Eligible?
- —
No personal income docs; deal must DSCR.
Hard money
10% down · 12.0% · 12mo
- Down + closing
- —
- Monthly P&I
- —
- Monthly cashflow
- —
- DSCR
- —
- Eligible?
- —
Short-term bridge; refi at stabilization.
Rent comps 17 comps
| Address | Beds | Baths | Sqft | Rent | $/sqft | DOM | Units | Dist |
|---|---|---|---|---|---|---|---|---|
| 2309 7th St Orange, TX | 3.0 | 1.0 | 1036 | $995 | $0.96 | 13d | 1 | 0.35mi |
| 206 W Dewey Ave Orange, TX | 2.0 | 1.0 | 800 | $777 | $0.97 | 43d | 1 | 0.38mi |
| 2511 N 8th St Unit Left Orange, TX | 2.0 | 1.0 | 750 | $900 | $1.20 | 13d | 1 | 0.46mi |
| 1885 E Farragut Ave Orange, TX | 1.0–3.0 | 1.0–2.5 | 1023 | $1,049 | $1.02 | 13d | 9 | 0.46mi |
| 1019 Ruby Ln Orange, TX | 2.0 | 1.0 | 1243 | $1,100 | $0.88 | 13d | 1 | 0.56mi |
| 310 S Farragut Ave Orange, TX | 2.0 | 1.0 | 725 | $1,150 | $1.59 | 43d | 1 | 0.59mi |
| 1030 Clairmont Dr Orange, TX | 3.0 | 2.0 | 1372 | $1,850 | $1.35 | 21d | 1 | 0.65mi |
| 2318 Pacific St Orange, TX | 2.0 | 1.0 | 800 | $800 | $1.00 | 13d | 1 | 0.78mi |
| 3 Pacific Cir Orange, TX | 4.0 | 1.0 | 1361 | $1,500 | $1.10 | 21d | 1 | 0.82mi |
| 9 W Eads Ave Orange, TX | 3.0 | 2.0 | 1255 | $1,400 | $1.12 | 43d | 1 | 0.84mi |
| 1500 Link Ave Orange, TX | 1.0–2.0 | 1.0–1.5 | 1082 | $1,050 | $0.97 | 13d | 1 | 0.95mi |
| 2208 Monterrey Dr Orange, TX | 3.0 | 1.0 | 1132 | $1,200 | $1.06 | 43d | 1 | 1.25mi |
| 3901 Beverly Ave Orange, TX | 3.0 | 2.0 | 1359 | $1,500 | $1.10 | 13d | 1 | 1.25mi |
| 1907 Walnut Ave Orange, TX | 3.0 | 1.5 | 1360 | $1,475 | $1.08 | 13d | 1 | 1.26mi |
| 605 N 4th St Unit A Orange, TX | 2.0 | 1.0 | 860 | $900 | $1.05 | 13d | 1 | 1.34mi |
| 605 4th St Orange, TX | 3.0 | 1.0 | 800 | $800 | $1.00 | 13d | 1 | 1.34mi |
| 1010 N 16th St Orange, TX | 3.0 | 1.5 | 1100 | $1,500 | $1.36 | 43d | 1 | 1.39mi |
Listing history 19 events
-
2026-06-18days on market $129,900 Active 23 DOM
-
2026-06-17days on market $129,900 Active 22 DOM
-
2026-06-16days on market $129,900 Active 21 DOM
-
2026-06-15days on market $129,900 Active 20 DOM
-
2026-06-14days on market $129,900 Active 18 DOM
-
2026-06-13days on market $129,900 Active 17 DOM
-
2026-06-10days on market $129,900 Active 15 DOM
-
2026-06-09days on market $129,900 Active 14 DOM
-
2026-06-08days on market $129,900 Active 13 DOM
-
2026-06-07days on market $129,900 Active 12 DOM
-
2026-06-03days on market $129,900 Active 8 DOM
-
2026-06-02days on market $129,900 Active 7 DOM
-
2026-06-01days on market $129,900 Active 6 DOM
-
2026-05-31days on market $129,900 Active 5 DOM
-
2026-05-30days on market $129,900 Active 4 DOM
-
2026-05-23$129,900 Active
-
2024-02-15soldstatus Closed 242-char remark
Show marketing remark (242 chars)
A rare opportunity, a vacant land where mobile homes are welcome within city limits. Owner finance is available. The land has access to all utilities, is flat clean, 2 driveways (culverts), and has access to an electrical pole, selling as is.
-
2023-10-27status Pending 242-char remark
Show marketing remark (242 chars)
A rare opportunity, a vacant land where mobile homes are welcome within city limits. Owner finance is available. The land has access to all utilities, is flat clean, 2 driveways (culverts), and has access to an electrical pole, selling as is.
-
2023-10-13$14,999 Active 242-char remark
Show marketing remark (242 chars)
A rare opportunity, a vacant land where mobile homes are welcome within city limits. Owner finance is available. The land has access to all utilities, is flat clean, 2 driveways (culverts), and has access to an electrical pole, selling as is.
ⓘ Source: listings_history table (triggers on properties + properties_extension) + one-shot
backfill from property_details.listing_events for pre-trigger history.
Tax reassessment forecast TX · Resets to sale price
- Current annual tax
- $464 · $39/mo
- Projected year-2 tax
- $2,377 · $198/mo
- Expected delta
- +$1,913/yr (+$159/mo · 411.8%)
ⓘ Screening estimate from a state-policy table — verify with the county assessor before closing.
Climate risk First Street
- Flood 7/10 Severe FEMA zone X (shaded) · 73% chance over 30 yrs
- Wildfire 2/10 Low
- Heat 9/10 Extreme 7 d/yr ≥109°F today · 21 d/yr by 30 yrs out
- Wind 9/10 Extreme 99% chance of damaging wind over 30 yrs
- Air quality 3/10 Moderate 2 unhealthy d/yr today · 3 by 30 yrs out
Nearby sold comps map
Loading sold comps map…
Walkable amenities ~0.75 mi
Loading nearby amenities…
Taxation est. · year 1
- Rental income
- $14,590
- − Mortgage interest
- −$7,276
- − Property taxes
- −$464
- − Insurance
- −$1,447
- − Repairs & maintenance
- −$1,167
- − Management
- −$1,167
- − Depreciation
- −$3,779
- Taxable loss
- −$711
- Est. tax savings @ 24.0%
- +$171
- After-tax cash flow
- $1,611/yr
For passive investors: Depreciation is non-cash, so a rental often shows a tax loss while cash-flowing — sheltering income. Rental losses are passive: they offset passive income freely, and up to $25,000/yr can offset ordinary (W-2) income if you actively participate and your MAGI is under $100k (phasing out to $0 by $150k); unused losses carry forward. On sale, claimed depreciation is recaptured at up to 25%, and gains may owe capital-gains tax (a 1031 exchange can defer both). Figures are a year-1 estimate at your 24.0% rate — not tax advice; consult a CPA.
Schools (NCES district)
- District
- Little Cypress-Mauriceville CISD
- NCES district ID
- 4827690
- Math proficiency
- 35% ▼ -5.00%
- Reading proficiency
- 40% ▲ 1.00%
- Median HH income
- $60,483
- Composite
- 33.41/100
- National rank
- #5473
- State rank
- #435 of 826 in TX
Livability — Orange
- Score
- 71/100
- State rank
- #286
- US rank
- #6456
Category grades
Schools grade is shown separately in the Schools card above.
Census & demographics
- Census place
- Orange, TX
- County
- Orange County · 87,112 people
- City population
- 22,976
- Metro
- Beaumont-Port Arthur, TX
- Population (ZIP)
- 28,983
- Household income
- $64,373
- Rent vs Own
- Severe rent burden
- 1018.0
Population outlook (Orange County) Hauer SSP2
- Today (2025)
- 88,065 people
- By 2030
- 89,591 · +1.7%
- By 2040
- 91,982 · +4.4%
- By 2050
- 93,023 · +5.6%
- By 2075
- 94,871 · +7.7%
- By 2100
- 88,155 · +0.1%
Race, ethnicity, and origin ACS 2023
- Neighborhood character
- Majority White (64%)
- Race & ethnicity
- White 64% Black 21% Hispanic / Latino 11% Two or more races 9%
- Hispanic origin (detail)
- Mexican 7%
- Common ancestry
- Lithuanian 13% Italian 1% Slovak 1%
- Foreign-born
- 5% · Canada
- Languages at home
- 91% English-only · Spanish 7% French/Haitian/Cajun 1% Other Asian/Pacific 1%
Political lean MEDSL · Orange
- 2024 margin
- Solid R (+66.8) · D 16.4% · R 83.1%
- 2008→2024 swing
- -19.6pp toward R · 2008: -47.1pp · 2024: -66.8pp
- All cycles
- 2024: R+66.8 2020: R+63.4 2016: R+61.9 2012: R+54.3 2008: R+47.1
Not yet ingested
- Civics
- —
Market trends
- HPI YoY
- ▲ 1.01%
- Current HPI
- 264.14
- Rent YoY
- ▲ 5.71%
- Metro
- Beaumont-Port Arthur, TX
- State GDP YoY
- ▲ 3.95%
- F500 in state
- 110
Industry mix (Fortune 500 HQ in TX)
| Industry | F500 HQs | Revenue |
|---|---|---|
| Energy | 16 | $1,198B |
|
||
| Technology | 5 | $198B |
|
||
| Engineering / Construction | 4 | $72B |
|
||
| Energy Services | 3 | $60B |
|
||
| Utilities | 3 | $41B |
|
||
| Healthcare | 2 | $330B |
|
||
Price history
+766.1% since first listed4 events — show timeline
- 2026-05-23 Listed $129,900 LAAR
- 2024-02-15 Sold (MLS) — BBOR
- 2023-10-27 Pending — BBOR
- 2023-10-13 Listed $14,999 BBOR
Property tax history
-1.7%/yrLatest (2021): $464 · +5.9% YoY. Source: county tax records.
Cash-flow waterfall
monthlySold comps — $/sqft
last 12 mo · ≤1 miLoading sold comps…