1610 Kanunu St #902 · Urban Honolulu, HI
Flood risk 9/10 · Severe
- FEMA flood zone
- X (unshaded)
- Chance of flooding over 30 yrs
- 0.99%
- Est. flood insurance / yr
- $507 – $1,088
Fire risk No data
- Est. fire insurance / yr
- —
Heat risk No data
- Hot days now (above threshold)
- —
- Hot days in 30 yrs
- —
Wind risk No data
- Chance of severe wind over 30 yrs
- —
Air-quality risk 1/10 · Minimal
- Unhealthy air days now
- —
- Unhealthy air days in 30 yrs
- —
Risk factors via First Street. Map © Google.
Why this score? — see what drove the D- grade
The composite is a weighted blend of 9 inputs, each scored 0–100. Each bar is that input's sub-score; the figure is the points it added to the 100-point composite (weight × sub-score).
- Cash flow +11.0/30.0
- Appreciation +6.0/10.0
- 1% rule +5.0/10.0
- Schools +3.7/10.0
- Rent growth +3.3/5.0
- DSCR +3.2/10.0
- Livability +2.5/5.0
- Condition / age +2.5/5.0
- ARV discount +0.0/15.0
$439,000
🖨 Deal sheet 📄 Offer letter ✓ Due diligence
Listing remarks MLS
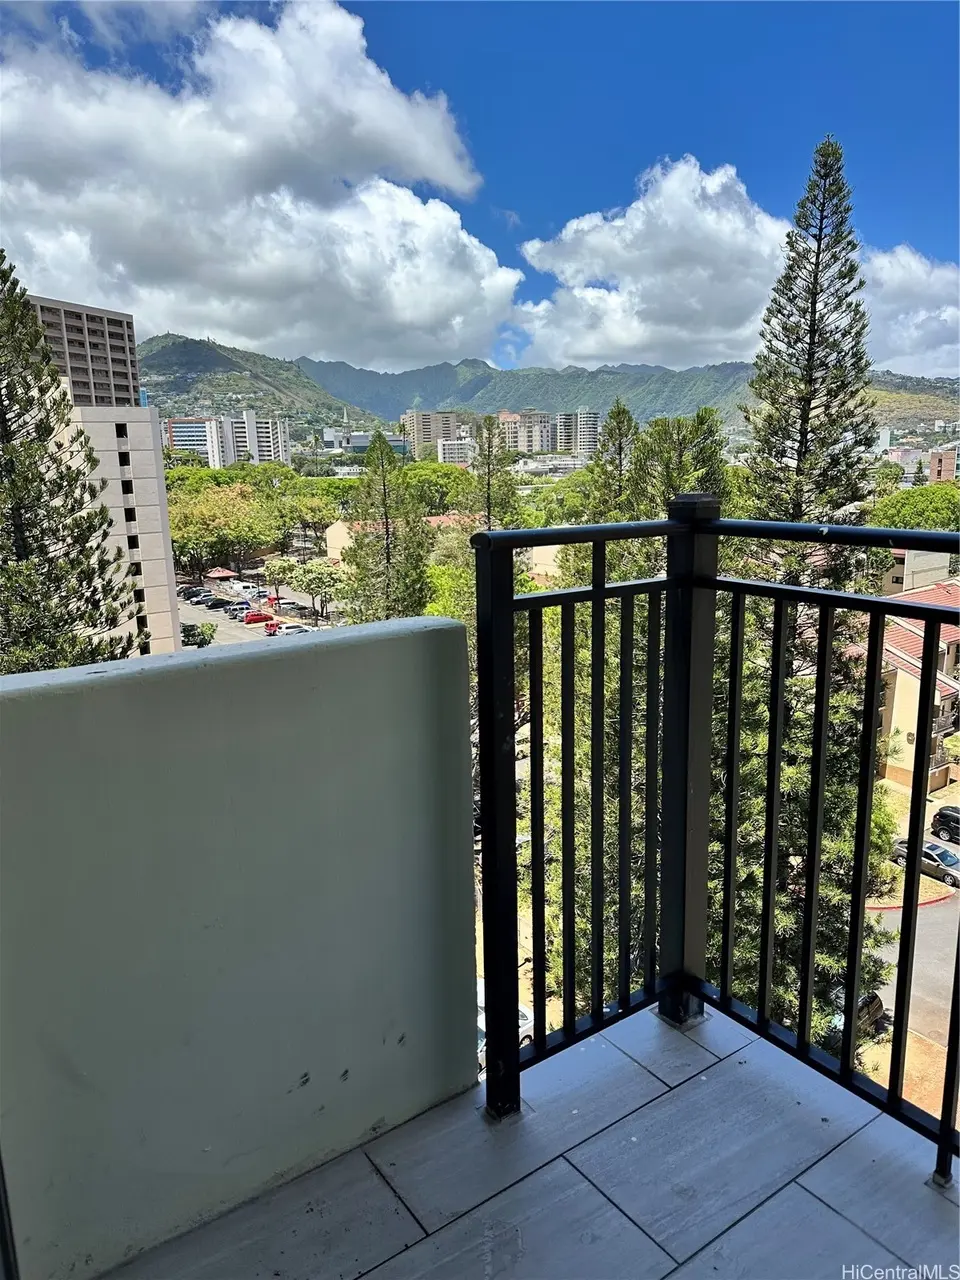
PRICE REDUCED!! Prime Location in the Heart of Honolulu! Upgraded 2BR/1BA condo with 1 parking stall in Kapiolani Tower. Over $40,000 in improvements! Enjoy cool trade winds and mountain views from the spacious lanai on the preferred side of the building. Centrally located next to Don Quijote, and within walking distance to Ala Moana Shopping Center, Ala Moana Beach Park, and Waikiki. Just minutes to UH, Chaminade, HPU, and Downtown. A rare opportunity to own in a highly walkable neighborhood. Well-maintained, older building with unbeatable convenience.
Key facts
- Spacious lanai
- Mountain views
- $1,080 HOA
Tags
Neighborhood map
What this means for you Summary
Snapshot
- This is a 2-bed/1.0-bath condo listed at $439k.
Deal economics
- At list price, monthly cash flow is $-255 ($-3k/yr) — negative.
- To cash-flow at today's rent, offer at most $394k (10.3% below list).
- Meets the 1% rule at list price ($4k rent vs $439k).
- Recommended offer: $386k (12.0% below list) — sets the bar for market timing.
- Cap rate 5.8% vs local median 1.5% in Urban Honolulu — top-decile yield for the area; either an underpriced asset or a hidden risk that comps aren't pricing in. Stress-test before assuming the spread holds.
Location & tenants
- Location reads: area grade D — affects rentability + tenant quality, not the cash-flow math above.
- Hawaii Department Of Education (suburban): math 32% / reading 50% proficiency, ranked #1 of 1 in HI (top 100%) — families likely to look elsewhere, expect single-tenant / working-renter base with shorter leases.
- Market conditions: Rents rising (+3.1%/yr); 549 active listings in the ZIP; 40 comparable units currently listed for rent nearby; rentals at typical pace (median 24d on market — plan ~3-4 weeks tenant-placement turnaround); 40% of comp listings sitting > 30 days — soft ceiling on asking rent; solid renter incomes; 1,638 units permitted in Honolulu County in 2024 (793 in 5+ unit buildings).
- At $4,403/mo this rent would consume 68% of the median local household income ($78k/yr) (locally 1641% of renters already pay >50% of income on rent) — very limited rent-growth headroom before tenants either downsize or default.
Forward outlook
- In year one you build about $12k of equity ($3k loan paydown + $9k appreciation (2.0% local appreciation)).
- Honolulu County population projected at +17% by 2050 — long-run rental-demand tailwind backs the buy-and-hold thesis.
- By year 4, paydown + projected appreciation supports a ~$40k cash-out refi (75% LTV) — recoverable capital for the next deal without selling this one.
Negotiation context
- It's been on market 332 days — a 12% lower offer ($386k) is reasonable based on typical stale-listing flexibility.
- 11 sale attempts since 19y ago with the ask held roughly flat each time — persistent listings suggest the price (not the market) is what's stuck; bring a comps-based counter.
Risks & watch-outs
- Watch-outs: flood insurance adds $66/mo; HOA is 25% of rent.
- Climate carrying-cost: severe flood risk — expect insurance premiums to compound above CPI over the hold.
Questions for the listing agent
- What do current leases actually rent for vs. the listed asking? Can we see a recent rent roll and the last 12 months of T-12 income?
- It's been on market 332 days. Have you received any prior offers? Is the seller open to a 12% concession, seller financing, or rate buy-down credit?
- Built in 1966 — when were the roof, HVAC, electrical panel, plumbing, and water heater last replaced?
- What's the actual annual flood-insurance premium (NFIP or private), and is the property in a SFHA with mandatory coverage?
- What does the HOA fee cover, when was the last increase, and are there any pending special assessments or reserve-fund shortfalls?
- Any open or pending special assessments — roof, HVAC, plumbing, elevator, façade? What's the per-unit balance and payoff schedule, and is the seller paying it off at close or rolling it to the buyer?
- Why hasn't it sold? Are there any deal-killer items the seller is aware of (foundation, flood, title, zoning, code violations)?
- Is there a deadline driving the sale (1031 exchange, divorce, estate, relocation)? That informs how much negotiation room exists.
- The area grade is low — what's the realistic commute time and amenity access for the typical tenant pool here? Any planned neighborhood developments (good or bad) we should know about?
- What's the average days-on-market for RENTAL listings here right now (not sales)? A rising rental-DOM trend means longer vacancies and softer asking-rent achievability than the comps imply.
- What's the recent tenant-quality profile in this submarket — average credit score on applications, eviction rate, late-payment / NSF rate, and stable-employment percentage? A property-management company in the area should have these aggregated.
- How much new apartment / multifamily construction is in the pipeline within 1–3 miles? Heavy new supply (>2% of stock underway) typically softens rents 12–24 months out; light construction supports rent growth.
Investment metrics
- 1% rule
- 1.00% ✓
- Cap rate
- 5.78%
- Cash-on-cash
- -1.84%
- DSCR
- 0.92
- GRM
- 8.3
CMA / ARV
- ARV (median comp)
- $373,565
- List price
- $439,000
- Delta
- 17.52%
- Verdict
- OVERPRICED
- Comps
- 20 within 1.0 mi
Projected returns pro-forma
1.98% appreciation · 3.1% rent growth · sell at horizon
- IRR
- 2.1%
- Equity multiple
- 1.12×
- Total profit
- $14,270
- Equity at exit
- $172,594
- IRR
- 6.3%
- Equity multiple
- 1.86×
- Total profit
- $105,198
- Equity at exit
- $248,108
Cash invested: $122,920 (down + closing). Projections, not guarantees.
Landlord ↔ Tenant lean methodology
- Overall (STATE)
- 37 Tenant-Leaning
- State Hawaii
- 37 Tenant-Leaning · D+13
- County
- — inherits STATE
- City
- — inherits STATE
ZIP-level market 96814
- Home prices YoY
- 0.5%
- Rents YoY
- 3.1%
- Active inventory
- 549
- Price-to-rent
- 8.3×
Monthly cashflow live
- Estimated rent
- $4,403 high interval (Pro) →
- Mortgage (P&I)
- −$2,302
- Tax from tax record
- −$102 /mo · $1,225/yr
- Insurance
- −$183
- Flood insurance flood zone
- −$66 /mo · $798/yr
- HOA
- −$1,080
- Vacancy / Maint / Mgmt
- −$925
- Net cashflow
- $-255
Break-even live
UW: 25.0% down · 7.5% · 30yr · 1.5% tax · 5.0% vac · 8.0% maint · 8.0% mgmt
Financing live
Cash to close
- Down payment
- $109,750
- Closing costs
- $13,170
- Reserves months
- —
- Total cash needed
- —
Loan-product check · same deal, 3 products live
Conventional
25% down · 7.5% · 30yr
- Down + closing
- —
- Monthly P&I
- —
- Monthly cashflow
- —
- DSCR
- —
- Eligible?
- —
Personal DTI + credit; lowest rate.
DSCR
20% down · 8.5% · 30yr
- Down + closing
- —
- Monthly P&I
- —
- Monthly cashflow
- —
- DSCR
- —
- Eligible?
- —
No personal income docs; deal must DSCR.
Hard money
10% down · 12.0% · 12mo
- Down + closing
- —
- Monthly P&I
- —
- Monthly cashflow
- —
- DSCR
- —
- Eligible?
- —
Short-term bridge; refi at stabilization.
Rent comps 40 comps
| Address | Beds | Baths | Sqft | Rent | $/sqft | DOM | Units | Dist |
|---|---|---|---|---|---|---|---|---|
| 1500 Rycroft St Unit 2306R Honolulu, HI | 1.0 | 1.0 | 563 | $4,000 | $7.10 | 44d | 1 | 0.15mi |
| 1500 Rycroft St Unit 2607R Honolulu, HI | 1.0 | 1.0 | 618 | $3,500 | $5.66 | 24d | 1 | 0.15mi |
| 1500 Rycroft St Unit 2519R Honolulu, HI | 2.0 | 2.0 | 1074 | $5,300 | $4.93 | 44d | 1 | 0.15mi |
| 1500 Rycroft St Unit 1904 Honolulu, HI | 1.0 | 1.0 | 564 | $3,400 | $6.03 | 17d | 1 | 0.15mi |
| 1500 Rycroft St Unit 800R Honolulu, HI | 2.0 | 2.0 | 942 | $4,700 | $4.99 | 44d | 1 | 0.15mi |
| 1500 Rycroft St Unit 4419R Honolulu, HI | 2.0 | 2.0 | 1074 | $6,000 | $5.59 | 44d | 1 | 0.15mi |
| 1500 Rycroft St Unit 3903 Honolulu, HI | 1.0 | 1.0 | 571 | $3,750 | $6.57 | 24d | 1 | 0.15mi |
| 1500 Rycroft St Unit 4116R Honolulu, HI | 2.0 | 2.0 | 872 | $5,000 | $5.73 | 24d | 1 | 0.15mi |
| 1500 Rycroft St Unit 2304 Honolulu, HI | 1.0 | 1.0 | 569 | $3,200 | $5.62 | 24d | 1 | 0.15mi |
| 1515 Liona St Unit 4401L Honolulu, HI | 2.0 | 2.0 | 990 | $4,900 | $4.95 | 44d | 1 | 0.16mi |
| 1515 Liona St Unit 4216L Honolulu, HI | 2.0 | 2.0 | 872 | $4,500 | $5.16 | 14d | 1 | 0.16mi |
| 1515 Liona St Unit 4216L Honolulu, HI | 2.0 | 2.0 | 872 | $4,500 | $5.16 | 17d | 1 | 0.16mi |
| 1515 Liona St #4407 Honolulu, HI | 1.0 | 1.0 | 606 | $3,750 | $6.19 | 3d | 1 | 0.16mi |
| 629 Keeaumoku St Honolulu, HI | 1.0–2.0 | 1.0–2.0 | 919 | $6,300 | $6.86 | 44d | 2 | 0.19mi |
| 629 Keeaumoku St Honolulu, HI | 1.0–2.0 | 1.0–2.0 | 923 | $6,300 | $6.82 | 17d | 2 | 0.19mi |
| 629 Keeaumoku St Honolulu, HI | 1.0 | 1.0 | 618 | $3,350 | $5.42 | 2d | 2 | 0.19mi |
| 1555 Kapiolani Blvd Honolulu, HI | 1.0–3.0 | 1.0–3.0 | 1719 | $12,750 | $7.42 | 3d | 4 | 0.25mi |
| 1555 Kapiolani Blvd Honolulu, HI | 1.0–2.0 | 1.0–2.0 | 1006 | $9,500 | $9.44 | 44d | 4 | 0.25mi |
| 1631 Kapiolani Blvd #3511 Honolulu, HI | 2.0 | 2.0 | 895 | $3,750 | $4.19 | 44d | 1 | 0.26mi |
| 1631 Kapiolani Blvd #3301 Honolulu, HI | 2.0 | 2.0 | 892 | $3,675 | $4.12 | 3d | 1 | 0.26mi |
| 1314 Kalakaua Ave Honolulu, HI | 2.0 | 1.0–2.0 | 773 | $4,675 | $6.04 | 24d | 3 | 0.29mi |
| 1314 Kalakaua Ave Honolulu, HI | 2.0 | 1.0–2.0 | 802 | $4,900 | $6.11 | 3d | 2 | 0.29mi |
| 1314 Kalakaua Ave #1202 Honolulu, HI | 2.0 | 2.0 | 832 | $5,000 | $6.01 | 20d | 1 | 0.29mi |
| 1314 Kalakaua Ave #407 Honolulu, HI | 2.0 | 1.0 | 772 | $4,800 | $6.22 | 44d | 1 | 0.29mi |
| 1267 Rycroft St Honolulu, HI | 2.0 | 1.0 | 816 | $2,750 | $3.37 | 24d | 1 | 0.29mi |
| 1388 Kapiolani Blvd Unit 3910 Honolulu, HI | 1.0 | 1.0 | 619 | $4,000 | $6.46 | 3d | 1 | 0.30mi |
| 1388 Kapiolani Blvd Honolulu, HI | 2.0 | 2.0 | 901 | $5,500 | $6.10 | 44d | 1 | 0.30mi |
| 1388 Kapiolani Blvd #2901 Honolulu, HI | 2.0 | 2.0 | 901 | $4,800 | $5.33 | 44d | 1 | 0.30mi |
| 1388 Kapiolani Blvd #1611 Honolulu, HI | 2.0 | 2.0 | 801 | $4,550 | $5.68 | 44d | 1 | 0.30mi |
| 1388 Kapiolani Blvd #1606 Honolulu, HI | 2.0 | 2.0 | 809 | $4,500 | $5.56 | 12d | 1 | 0.30mi |
| 1388 Kapiolani Blvd #2903 Honolulu, HI | 1.0 | 1.0 | 574 | $3,500 | $6.10 | 10d | 1 | 0.30mi |
| 1388 Kapiolani Blvd #1606 Honolulu, HI | 2.0 | 2.0 | 809 | $4,500 | $5.56 | 44d | 1 | 0.30mi |
| 1388 Kapiolani Blvd #2201 Honolulu, HI | 2.0 | 2.0 | 901 | $5,800 | $6.44 | 44d | 1 | 0.30mi |
| 1388 Kapiolani Blvd #2703 Honolulu, HI | 1.0 | 1.0 | 574 | $3,500 | $6.10 | 24d | 1 | 0.30mi |
| 1388 Kapiolani Blvd #4205 Honolulu, HI | 1.0 | 1.0 | 567 | $4,500 | $7.94 | 44d | 1 | 0.30mi |
| 1388 Kapiolani Blvd #4111 Honolulu, HI | 2.0 | 2.0 | 816 | $6,500 | $7.97 | 44d | 1 | 0.30mi |
| 1315 Liona St Honolulu, HI | 1.0 | 1.0 | 606 | $3,950 | $6.52 | 20d | 1 | 0.30mi |
| 1374 Kapiolani Blvd Unit 1327705P Honolulu, HI | 2.0 | 2.0 | 796 | $5,740 | $7.21 | 2d | 1 | 0.31mi |
| 1391 Kapiolani Blvd Honolulu, HI | 1.0–3.0 | 1.0–2.0 | 971 | $4,750 | $4.89 | 3d | 2 | 0.33mi |
| 1114 Punahou St Unit 9A Honolulu, HI | 3.0 | 2.0 | 1037 | $3,600 | $3.47 | 17d | 1 | 0.33mi |
HOA detail condo
- Monthly dues
- $1,080 · $12,960/yr
- Assessments
- None detected in remarks — confirm with the listing agent.
Listing history 48 events
-
2026-06-18days on market $439,000 Active 332 DOM
-
2026-06-17days on market $439,000 Active 331 DOM
-
2026-06-15days on market $439,000 Active 329 DOM
-
2026-06-13days on market $439,000 Active 327 DOM
-
2026-06-13days on market $439,000 Active 326 DOM
-
2026-06-10days on market $439,000 Active 324 DOM
-
2026-06-09days on market $439,000 Active 323 DOM
-
2026-06-08days on market $439,000 Active 322 DOM
-
2026-06-07days on market $439,000 Active 321 DOM
-
2026-06-05days on market $439,000 Active 318 DOM
-
2026-06-03days on market $439,000 Active 317 DOM
-
2026-06-02days on market $439,000 Active 316 DOM
-
2026-06-01days on market $439,000 Active 315 DOM
-
2026-05-31days on market $439,000 Active 314 DOM
-
2025-09-08price $439,000 560-char remark
Show marketing remark (560 chars)
PRICE REDUCED!! Prime Location in the Heart of Honolulu! Upgraded 2BR/1BA condo with 1 parking stall in Kapiolani Tower. Over $40,000 in improvements! Enjoy cool trade winds and mountain views from the spacious lanai on the preferred side of the building. Centrally located next to Don Quijote, and within walking distance to Ala Moana Shopping Center, Ala Moana Beach Park, and Waikiki. Just minutes to UH, Chaminade, HPU, and Downtown. A rare opportunity to own in a highly walkable neighborhood. Well-maintained, older building with unbeatable convenience.
-
2025-07-20$459,000 Active 560-char remark
Show marketing remark (560 chars)
PRICE REDUCED!! Prime Location in the Heart of Honolulu! Upgraded 2BR/1BA condo with 1 parking stall in Kapiolani Tower. Over $40,000 in improvements! Enjoy cool trade winds and mountain views from the spacious lanai on the preferred side of the building. Centrally located next to Don Quijote, and within walking distance to Ala Moana Shopping Center, Ala Moana Beach Park, and Waikiki. Just minutes to UH, Chaminade, HPU, and Downtown. A rare opportunity to own in a highly walkable neighborhood. Well-maintained, older building with unbeatable convenience.
-
2023-05-12historical
-
2023-05-01price $440,000
-
2023-04-21$425,000 Active
-
2023-04-16historical
-
2023-01-21price $425,000
-
2022-10-30price $449,000
-
2022-10-21$469,000 Active
-
2021-09-03soldstatus $385,000 Sold
-
2021-06-08status Pending
-
2021-06-02$389,000 Active
-
2021-05-30historical
-
2021-05-29status Active
-
2021-05-07status Pending
-
2021-02-18price $399,000
-
2021-01-13$405,000 Active
-
2020-11-04historical
-
2020-07-10price $395,000
-
2019-12-30price $410,000
-
2019-09-06$430,000 Active
-
2019-08-19historical
-
2019-07-03price $430,000
-
2019-06-03$450,000 Active
-
2017-02-17historical Hold
-
2017-01-18$45,700 Active
-
2017-01-17price $457,000
-
2014-10-17soldstatus $355,000
-
2014-10-17soldstatus $355,000
-
2014-05-12$360,000
-
2007-02-21soldstatus $405,000
-
2007-02-21soldstatus $405,000
-
2007-01-08$405,000
-
1971-09-01soldstatus $37,500
ⓘ Source: listings_history table (triggers on properties + properties_extension) + one-shot
backfill from property_details.listing_events for pre-trigger history.
Tax reassessment forecast HI · Partial reset (capped growth)
- Current annual tax
- $1,225 · $102/mo
- Projected year-2 tax
- $1,227 · $102/mo
- Expected delta
- +$2/yr ($0/mo · 0.2%)
ⓘ Screening estimate from a state-policy table — verify with the county assessor before closing.
Climate risk First Street
- Flood 9/10 Extreme FEMA zone X (unshaded) · 99% chance over 30 yrs
- Air quality 1/10 Low
Nearby sold comps map
Loading sold comps map…
Walkable amenities ~0.75 mi
Loading nearby amenities…
Taxation est. · year 1
- Rental income
- $52,839
- − Mortgage interest
- −$24,591
- − Property taxes
- −$1,225
- − Insurance
- −$2,992
- − Repairs & maintenance
- −$4,227
- − Management
- −$4,227
- − HOA
- −$12,960
- − Depreciation
- −$12,771
- Taxable loss
- −$10,154
- Est. tax savings @ 24.0%
- +$2,437
- After-tax cash flow
- $-623/yr
For passive investors: Depreciation is non-cash, so a rental often shows a tax loss while cash-flowing — sheltering income. Rental losses are passive: they offset passive income freely, and up to $25,000/yr can offset ordinary (W-2) income if you actively participate and your MAGI is under $100k (phasing out to $0 by $150k); unused losses carry forward. On sale, claimed depreciation is recaptured at up to 25%, and gains may owe capital-gains tax (a 1031 exchange can defer both). Figures are a year-1 estimate at your 24.0% rate — not tax advice; consult a CPA.
Schools (NCES district)
- District
- Hawaii Department Of Education
- NCES district ID
- 1500030
- Math proficiency
- 32% ▼ -10.00%
- Reading proficiency
- 50% ▼ -3.00%
- Median HH income
- $69,005
- Composite
- 37.07/100
- National rank
- #4504
- State rank
- #1 of 1 in HI
Livability — Urban Honolulu
No livability data for this city. (Only ~50 U.S. cities are tracked.)
Census & demographics
- Census place
- Urban Honolulu, HI
- County
- Honolulu County · 963,448 people
- City population
- 309,956
- Metro
- Urban Honolulu, HI
- Population (ZIP)
- 24,689
- Household income
- $77,768
- Rent vs Own
- Severe rent burden
- 1641.0
Population outlook (Honolulu County) Hauer SSP2
- Today (2025)
- 1,072,641 people
- By 2030
- 1,110,460 · +3.5%
- By 2040
- 1,181,593 · +10.2%
- By 2050
- 1,257,584 · +17.2%
- By 2075
- 1,501,120 · +39.9%
- By 2100
- 1,764,430 · +64.5%
Race, ethnicity, and origin ACS 2023
- Neighborhood character
- Diverse neighborhood (Simpson 0.58)
- Race & ethnicity
- Asian 64% Two or more races 14% White 13% Pacific Islander 6% Hispanic / Latino 5% Black 1%
- Hispanic origin (detail)
- Mexican 2% Puerto Rican 2%
- Common ancestry
- Russian 1% Lithuanian 1% Italian 1%
- Foreign-born
- 35% · China, South Korea, Vietnam
- Languages at home
- 58% English-only · Other Asian/Pacific 15% Chinese 10% Korean 9%
Political lean MEDSL · Honolulu
- 2024 margin
- Strong D (+21.6) · D 59.9% · R 38.3% · Other 1.8%
- 2008→2024 swing
- -19.4pp toward R · 2008: 41.1pp · 2024: 21.6pp
- All cycles
- 2024: D+21.6 2020: D+26.9 2016: D+29.9 2012: D+39.1 2008: D+41.1
Not yet ingested
- Civics
- —
Market trends
- HPI YoY
- ▲ 1.98%
- Current HPI
- 376.4197
- Rent YoY
- ▲ 3.10%
- Metro
- Urban Honolulu, HI
- State GDP YoY
- —
- F500 in state
- 0
Price history
+1070.7% since first listed34 events — show timeline
- 2025-09-08 Price Changed $439,000 HiCentral MLS
- 2025-07-20 Listed $459,000 HiCentral MLS
- 2023-05-12 Listing Removed — HiCentral MLS
- 2023-05-01 Price Changed $440,000 HiCentral MLS
- 2023-04-21 Listed $425,000 HiCentral MLS
- 2023-04-16 Listing Removed — HiCentral MLS
- 2023-01-21 Price Changed $425,000 HiCentral MLS
- 2022-10-30 Price Changed $449,000 HiCentral MLS
- 2022-10-21 Listed $469,000 HiCentral MLS
- 2021-09-03 Sold (MLS) $385,000 HiCentral MLS
- 2021-06-08 Pending — HiCentral MLS
- 2021-06-02 Listed $389,000 HiCentral MLS
- 2021-05-30 Listing Removed — HiCentral MLS
- 2021-05-29 Relisted — HiCentral MLS
- 2021-05-07 Pending — HiCentral MLS
- 2021-02-18 Price Changed $399,000 HiCentral MLS
- 2021-01-13 Listed $405,000 HiCentral MLS
- 2020-11-04 Listing Removed — HiCentral MLS
- 2020-07-10 Price Changed $395,000 HiCentral MLS
- 2019-12-30 Price Changed $410,000 HiCentral MLS
- 2019-09-06 Listed $430,000 HiCentral MLS
- 2019-08-19 Listing Removed — HiCentral MLS
- 2019-07-03 Price Changed $430,000 HiCentral MLS
- 2019-06-03 Listed $450,000 HiCentral MLS
- 2017-02-17 Delisted — HiCentral MLS
- 2017-01-18 Listed $45,700 HiCentral MLS
- 2017-01-17 Price Changed $457,000 HiCentral MLS
- 2014-10-17 Sold (Public Records) $355,000 Public Records
- 2014-10-17 Sold (MLS) $355,000 HiCentral MLS
- 2014-05-12 Listed $360,000 HiCentral MLS
- 2007-02-21 Sold (Public Records) $405,000 Public Records
- 2007-02-21 Sold (MLS) $405,000 HiCentral MLS
- 2007-01-08 Listed $405,000 HiCentral MLS
- 1971-09-01 Sold (Public Records) $37,500 Public Records
Property tax history
+2.7%/yrLatest (2022): $1,225 · +14.1% YoY. Source: county tax records.
Cash-flow waterfall
monthlySold comps — $/sqft
last 12 mo · ≤1 miLoading sold comps…