229 Gilead St Lot 15 St · Cardington, OH
Flood risk 8/10 · Major
- FEMA flood zone
- X (unshaded)
- Chance of flooding over 30 yrs
- 0.97%
- Est. flood insurance / yr
- $507 – $1,088
Fire risk 1/10 · Minimal
- Est. fire insurance / yr
- $713 – $1,323
Heat risk 3/10 · Minor
- Hot days now (above 98°F)
- 7 days/yr
- Hot days in 30 yrs
- 17 days/yr
Wind risk 2/10 · Minimal
- Chance of severe wind over 30 yrs
- 0.0%
Air-quality risk 2/10 · Minimal
- Unhealthy air days now
- 1 days/yr
- Unhealthy air days in 30 yrs
- 2 days/yr
Risk factors via First Street. Map © Google.
Why this score? — see what drove the D+ grade
The composite is a weighted blend of 9 inputs, each scored 0–100. Each bar is that input's sub-score; the figure is the points it added to the 100-point composite (weight × sub-score).
- Cash flow +15.0/30.0
- ARV discount +7.5/15.0
- 1% rule +5.0/10.0
- DSCR +5.0/10.0
- Schools +4.5/10.0
- Livability +3.7/5.0
- Rent growth +2.5/5.0
- Condition / age +2.5/5.0
- Appreciation +0.0/10.0
$19,900
🖨 Deal sheet 📄 Offer letter ✓ Due diligence
Listing remarks MLS
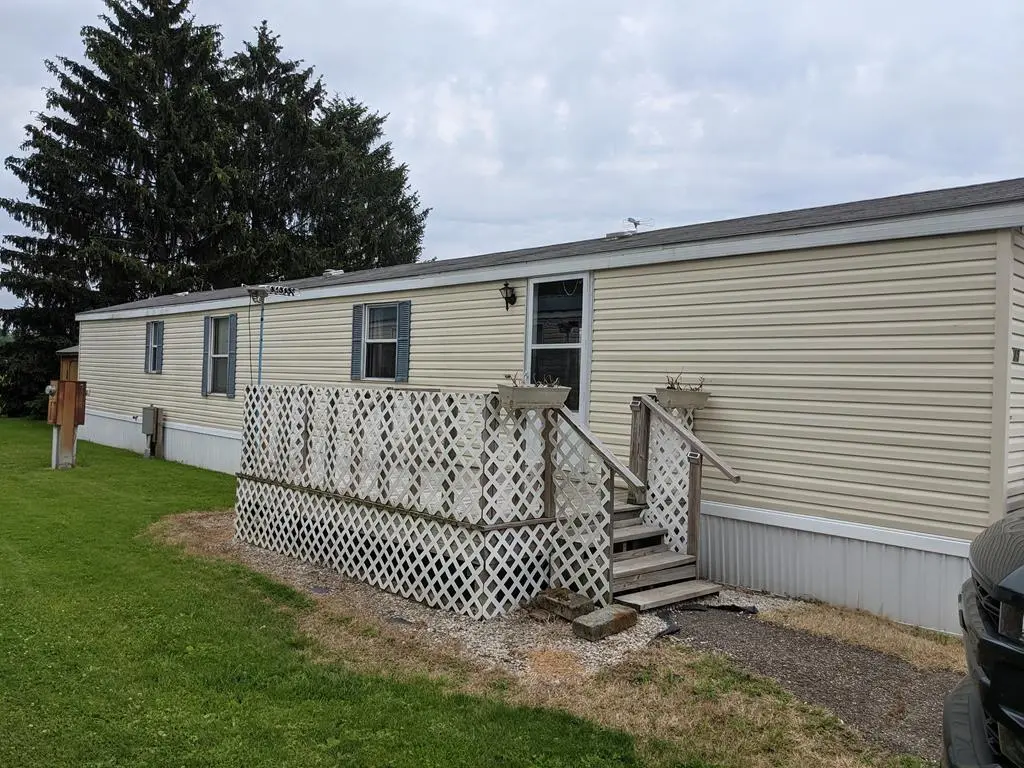
Singlewide 1991 Shultz mobile home, updated 2015. Situated at 229 Gilead Street, Lot 15, Cardington. Lot rent is 225/month and includes trash. Water & Sewer is billed separately by landlord. Newer shed, 8x12. Furnace, duct work, insulation under mobile was replaced 5 years ago. 8x10 deck, water heater were replaced 2 years ago. 2 bedrooms, 1 bath. Affordable living.
Key facts
- Well maintained home
- Convenient location
- Move in ready
Tags
Neighborhood map
What this means for you Summary
Snapshot
- This is a 2-bed/1.0-bath manufactured listed at $20k.
Deal economics
- At list price, monthly cash flow is $602 ($7k/yr) — positive.
- The deal already cash-flows at list — no discount required.
- Meets the 1% rule at list price ($1k rent vs $20k).
- Recommended offer: $19k (3.0% below list) — sets the bar for market timing.
Location & tenants
- Location reads 73/100 on livability (#310 in OH) — a middle-class / working-renter tenant base. Strengths: crime A+, cost of living A+, housing A+; Watch: schools C-, employment D+, amenities F.
- Cardington-Lincoln Local (rural): math 48% / reading 58% proficiency, ranked #395 of 656 in OH (top 60%) — acceptable for families but not a draw, mixed tenant base, ~2y average lease.
- Market conditions: 33 active listings in the ZIP; 1 comparable units currently listed for rent nearby; 129 units permitted in Morrow County in 2024 (0 in 5+ unit buildings).
- This rent is only 18% of the median local income ($70k/yr) — well below the 30% rent-burden line; pricing power to push rent on renewal without tenant pushback.
Forward outlook
- Local home prices are declining (-3.0%/yr); year-one equity from $138 of loan paydown is wiped out by about $597 of value loss. Plan a longer hold.
- Morrow County population projected at -10% by 2050 — secular population decline; favor cash flow + early exit over multi-decade hold.
- At projected returns (-3.0% appreciation + 3.0% rent growth), your $6k cash investment doubles in ~1 year — after that, you're playing with house money.
Negotiation context
- It's been on market 45 days — a 3% lower offer ($19k) is reasonable based on typical stale-listing flexibility.
- 3 sale attempts since 5y ago; this cycle's ask has dropped $30k (60%) from the opening price — seller is motivated, your offer sets the floor, not the list.
Risks & watch-outs
- Watch-outs: flood insurance adds $66/mo.
- Climate carrying-cost: severe flood risk — expect insurance premiums to compound above CPI over the hold.
Questions for the listing agent
- It's been on market 45 days. Have you received any prior offers? Is the seller open to a 3% concession, seller financing, or rate buy-down credit?
- What's the actual annual flood-insurance premium (NFIP or private), and is the property in a SFHA with mandatory coverage?
- Is there a deadline driving the sale (1031 exchange, divorce, estate, relocation)? That informs how much negotiation room exists.
- The area grade is low — what's the realistic commute time and amenity access for the typical tenant pool here? Any planned neighborhood developments (good or bad) we should know about?
- What's the average days-on-market for RENTAL listings here right now (not sales)? A rising rental-DOM trend means longer vacancies and softer asking-rent achievability than the comps imply.
- What's the recent tenant-quality profile in this submarket — average credit score on applications, eviction rate, late-payment / NSF rate, and stable-employment percentage? A property-management company in the area should have these aggregated.
- How much new for-sale + rental construction is in the pipeline within 1–3 miles? Heavy new supply typically softens prices + rents 12–24 months out; constrained supply supports both.
Investment metrics
- 1% rule
- 5.13% ✓
- Cap rate
- 46.59%
- Cash-on-cash
- 143.92%
- DSCR
- 7.40
- GRM
- 1.6
CMA / ARV
- ARV (median comp)
- $12,000
- List price
- $19,900
- Delta
- 65.83%
- Verdict
- OVERPRICED
- Comps
- 1 within 2.0 mi
Show comp detail 1 sale within ~0.75 mi
| Address | Dist | Beds/Ba | Sqft | Sold | Price | $/sf | Match |
|---|---|---|---|---|---|---|---|
| 229 Gilead St Lot 15 St | 0.00mi | 2/1.0 | 1,034 (0%) | 0mo | $12,000 | $12 | 100 |
Match score weights: distance 35% · size 25% · config 20% · recency 20%. Top-matched comps best support the ARV.
Projected returns pro-forma
-3.0% appreciation · 3.0% rent growth · sell at horizon
- IRR
- —
- Equity multiple
- 7.31×
- Total profit
- $35,162
- Equity at exit
- $2,967
- IRR
- —
- Equity multiple
- 15.39×
- Total profit
- $80,203
- Equity at exit
- $1,721
Cash invested: $5,572 (down + closing). Projections, not guarantees.
Landlord ↔ Tenant lean methodology
- Overall (STATE)
- 73 Landlord-Friendly
- State Ohio
- 73 Landlord-Friendly · R+6
- County
- — inherits STATE
- City
- — inherits STATE
ZIP-level market 43315
- Home prices YoY
- -25.8%
- Active inventory
- 33
- Price-to-rent
- 1.6×
Monthly cashflow live
- Estimated rent
- $1,020 medium interval (Pro) →
- Mortgage (P&I)
- −$104
- Tax est. 1.5%
- −$25 /mo · $298/yr
- Insurance
- −$8
- Flood insurance flood zone
- −$66 /mo · $798/yr
- HOA
- −$0
- Vacancy / Maint / Mgmt
- −$214
- Net cashflow
- $602
Break-even live
UW: 25.0% down · 7.5% · 30yr · 1.5% tax · 5.0% vac · 8.0% maint · 8.0% mgmt
Financing live
Cash to close
- Down payment
- $4,975
- Closing costs
- $597
- Reserves months
- —
- Total cash needed
- —
Loan-product check · same deal, 3 products live
Conventional
25% down · 7.5% · 30yr
- Down + closing
- —
- Monthly P&I
- —
- Monthly cashflow
- —
- DSCR
- —
- Eligible?
- —
Personal DTI + credit; lowest rate.
DSCR
20% down · 8.5% · 30yr
- Down + closing
- —
- Monthly P&I
- —
- Monthly cashflow
- —
- DSCR
- —
- Eligible?
- —
No personal income docs; deal must DSCR.
Hard money
10% down · 12.0% · 12mo
- Down + closing
- —
- Monthly P&I
- —
- Monthly cashflow
- —
- DSCR
- —
- Eligible?
- —
Short-term bridge; refi at stabilization.
Rent comps 1 comps
| Address | Beds | Baths | Sqft | Rent | $/sqft | DOM | Units | Dist |
|---|---|---|---|---|---|---|---|---|
| 400 Park St Cardington, OH | 3.0 | 1.5 | 1127 | $1,020 | $0.91 | 17d | 1 | 0.82mi |
Listing history 14 events
-
2026-06-07statusdays on market $19,900 Pending 45 DOM
-
2026-06-05days on market $19,900 Active 44 DOM
-
2026-06-03remarks 627-char remark
-
2026-06-03pricestatusdays on market $19,900 Active 42 DOM
-
2026-05-05price $24,900
-
2026-04-21price $29,900
-
2026-04-14price $36,000
-
2026-04-06price $43,000
-
2026-03-31$50,000 Active
-
2021-07-13soldstatus $25,700 Closed 374-char remark
Show marketing remark (374 chars)
Singlewide 1991 Shultz mobile home, updated 2015. Situated at 229 Gilead Street, Lot 15, Cardington. Lot rent is 225/month and includes trash. Water & Sewer is billed separately by landlord. Newer shed, 8x12. Furnace, duct work, insulation under mobile was replaced 5 years ago. 8x10 deck, water heater were replaced 2 years ago. 2 bedrooms, 1 bath. Affordable living.
-
2021-07-13soldstatus $25,700
Show marketing remark (374 chars)
Singlewide 1991 Shultz mobile home, updated 2015. Situated at 229 Gilead Street, Lot 15, Cardington. Lot rent is 225/month and includes trash. Water & Sewer is billed separately by landlord. Newer shed, 8x12. Furnace, duct work, insulation under mobile was replaced 5 years ago. 8x10 deck, water heater were replaced 2 years ago. 2 bedrooms, 1 bath. Affordable living.
-
2021-06-29historical Contingent Finance and Inspection 374-char remark
Show marketing remark (374 chars)
Singlewide 1991 Shultz mobile home, updated 2015. Situated at 229 Gilead Street, Lot 15, Cardington. Lot rent is 225/month and includes trash. Water & Sewer is billed separately by landlord. Newer shed, 8x12. Furnace, duct work, insulation under mobile was replaced 5 years ago. 8x10 deck, water heater were replaced 2 years ago. 2 bedrooms, 1 bath. Affordable living.
-
2021-06-28$25,700
-
2021-06-24$25,700 Active 374-char remark
Show marketing remark (374 chars)
Singlewide 1991 Shultz mobile home, updated 2015. Situated at 229 Gilead Street, Lot 15, Cardington. Lot rent is 225/month and includes trash. Water & Sewer is billed separately by landlord. Newer shed, 8x12. Furnace, duct work, insulation under mobile was replaced 5 years ago. 8x10 deck, water heater were replaced 2 years ago. 2 bedrooms, 1 bath. Affordable living.
ⓘ Source: listings_history table (triggers on properties + properties_extension) + one-shot
backfill from property_details.listing_events for pre-trigger history.
Climate risk First Street
- Flood 8/10 Severe FEMA zone X (unshaded) · 97% chance over 30 yrs
- Wildfire 1/10 Low
- Heat 3/10 Moderate 7 d/yr ≥98°F today · 17 d/yr by 30 yrs out
- Wind 2/10 Low 0% chance of damaging wind over 30 yrs
- Air quality 2/10 Low 1 unhealthy d/yr today · 2 by 30 yrs out
Nearby sold comps map
Loading sold comps map…
Walkable amenities ~0.75 mi
Loading nearby amenities…
Taxation est. · year 1
- Rental income
- $12,240
- − Mortgage interest
- −$1,115
- − Property taxes
- −$298
- − Insurance
- −$897
- − Repairs & maintenance
- −$979
- − Management
- −$979
- − Depreciation
- −$579
- Taxable income
- $7,392
- Est. tax owed @ 24.0%
- −$1,774
- After-tax cash flow
- $5,448/yr
For passive investors: Depreciation is non-cash, so a rental often shows a tax loss while cash-flowing — sheltering income. Rental losses are passive: they offset passive income freely, and up to $25,000/yr can offset ordinary (W-2) income if you actively participate and your MAGI is under $100k (phasing out to $0 by $150k); unused losses carry forward. On sale, claimed depreciation is recaptured at up to 25%, and gains may owe capital-gains tax (a 1031 exchange can defer both). Figures are a year-1 estimate at your 24.0% rate — not tax advice; consult a CPA.
Schools (NCES district)
- District
- Cardington-Lincoln Local
- NCES district ID
- 3904879
- Math proficiency
- 48% ▼ -12.00%
- Reading proficiency
- 58% ▼ -1.00%
- Median HH income
- $50,782
- Composite
- 45.31/100
- National rank
- #2646
- State rank
- #395 of 656 in OH
Livability — Cardington
- Score
- 73/100
- State rank
- #310
- US rank
- #5049
Category grades
Schools grade is shown separately in the Schools card above.
Census & demographics
- Census place
- Cardington, OH
- County
- Morrow · 41,908 people
- Metro
- Columbus, OH
- Population (ZIP)
- 6,996
- Household income
- $69,621
- Rent vs Own
- Severe rent burden
- 4.1
Population outlook (Morrow County) Hauer SSP2
- Today (2025)
- 35,607 people
- By 2030
- 35,482 · -0.4%
- By 2040
- 34,369 · -3.5%
- By 2050
- 32,038 · -10.0%
- By 2075
- 25,090 · -29.5%
- By 2100
- 17,123 · -51.9%
Race, ethnicity, and origin ACS 2023
- Neighborhood character
- Predominantly White (93%)
- Race & ethnicity
- White 93% Two or more races 4% Black 1%
- Common ancestry
- Slovak 7% Portuguese 5% Romanian 3%
- Foreign-born
- 0%
- Languages at home
- 99% English-only · German/W. Germanic 1%
Political lean MEDSL · Morrow
- 2024 margin
- Solid R (+55.7) · D 21.7% · R 77.5%
- 2008→2024 swing
- -32.4pp toward R · 2008: -23.4pp · 2024: -55.7pp
- All cycles
- 2024: R+55.7 2020: R+54.3 2016: R+49.5 2012: R+24.6 2008: R+23.4
Not yet ingested
- Civics
- —
Market trends
- HPI YoY
- ▼ -81.79%
- Current HPI
- 235.5712
- Rent YoY
- —
- Metro
- —
- State GDP YoY
- ▲ 1.98%
- F500 in state
- 48
Industry mix (Fortune 500 HQ in OH)
| Industry | F500 HQs | Revenue |
|---|---|---|
| Insurance | 3 | $145B |
|
||
| Industrial Machinery | 3 | $49B |
|
||
| Financial Services | 3 | $24B |
|
||
| Consumer Goods | 2 | $93B |
|
||
| Aerospace / Defense | 2 | $47B |
|
||
| Utilities | 2 | $33B |
|
||
Price history
-3.1% since first listed10 events — show timeline
- 2026-05-05 Price Changed $24,900 MARMLS
- 2026-04-21 Price Changed $29,900 MARMLS
- 2026-04-14 Price Changed $36,000 MARMLS
- 2026-04-06 Price Changed $43,000 MARMLS
- 2026-03-31 Listed $50,000 MARMLS
- 2021-07-13 Sold (MLS) $25,700 MARMLS
- 2021-07-13 Sold (MLS) $25,700 CBRMLS
- 2021-06-29 Contingent — CBRMLS
- 2021-06-28 Listed $25,700 MARMLS
- 2021-06-24 Listed $25,700 CBRMLS
Cash-flow waterfall
monthlySold comps — $/sqft
last 12 mo · ≤1 miLoading sold comps…